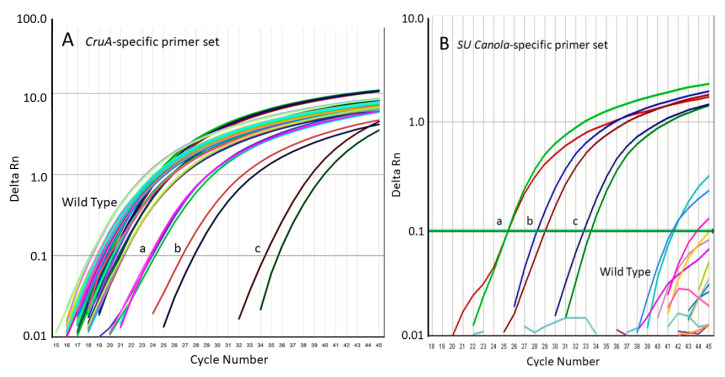
Figure 5.
Quantitative PCR amplification curves for the results shown in Table 3. Panel (A), amplification using the qPCR method specific for the canola endogenous reference gene (CruA); Panel (B), amplification using the qPCR method specific for the AHAS1C-SU SNV of SU canola. Positive controls are DNA from SU canola event 40K at 300 (a), 30 (b), and 3 (c) ng 40K DNA per reaction.

