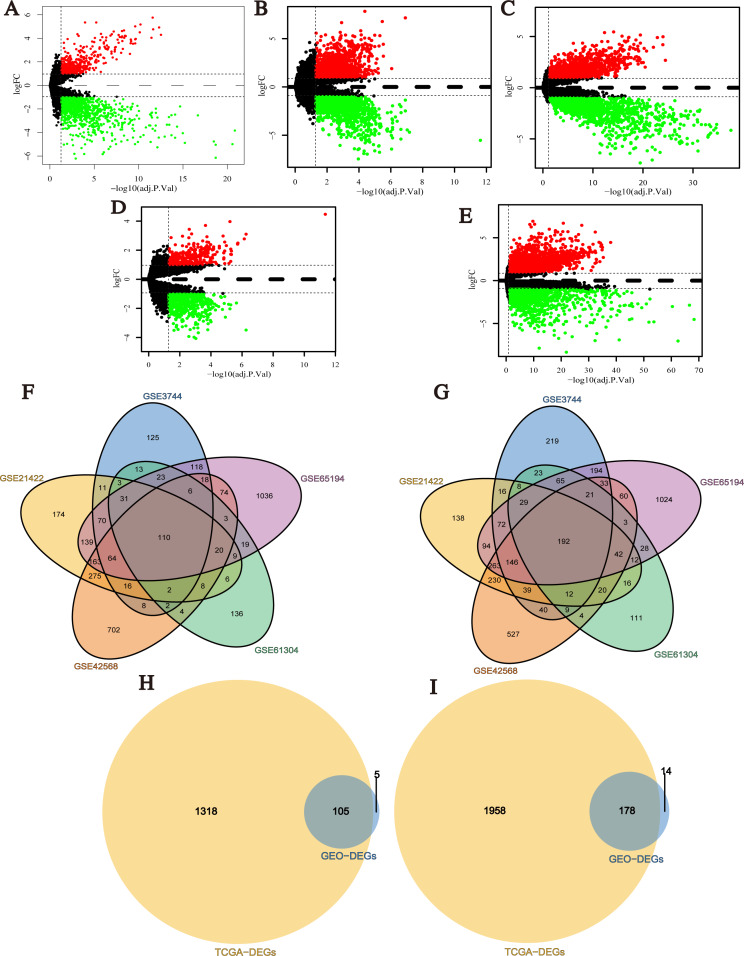
Figure 2. Identification of differentially expressed genes (DEGs) between breast cancer tumor tissues and normal tissues.
(A–E) Volcano plots of differential expression analysis for GSE3744, GSE21422, GSE42568, GSE61304, and GSE65194. Red: up-regulated; green: down-regulated. (F) Up-regulated DEGs selected by integrating five GEO datasets. (G) Down-regulated DEGs selected by integrating 5 GEO datasets. (H) Up-regulated overlapping DEGs obtained by integrating GEO datasets and TCGA BRCA dataset. (I) Down-regulated overlapping DEGs obtained by integrating GEO datasets and TCGA BRCA dataset.

