

Summary
Obesity prevention policies are a priority for many governments and intergovernmental agencies. Policy makers not only use systematic reviews of effectiveness but also consider contextual issues including cost and cost‐effectiveness, equity, rights, acceptability and feasibility. To support their work, the present narrative review examines three contextual issues (costs, equity and acceptability) in relation to three policies for obesity prevention: sweetened beverage taxes, front‐of‐pack nutrition labelling and restrictions on advertising to children. Literature searches led to over 1100 documents, of which 125 informed the present review. Beverage taxes were found likely to be highly cost‐effective, moderately favourable for health equity, supported by the public (depending on the use of revenues) and by health professionals and civil society groups and opposed by commercial interests. Depending on the design, front‐of‐pack nutritional labelling is likely to be highly cost‐effective, moderately favourable for health equity, supported by the public, health professionals and civil society groups, and opposed by commercial interests. Restrictions on child‐directed advertising are likely to be highly cost‐effective in the longer term, moderately favourable for health equity, supported by the public, health professionals and civil society groups and opposed by commercial interests (unless voluntary). The evidence base needs strengthening, but the authors find that all three policies merit consideration by governmental authorities, and should be implemented to reduce obesity risk.
Keywords: Labelling, marketing, taxes, equity
1. INTRODUCTION
Worldwide, the prevalence of obesity in the adult population rose dramatically during the last decade and without significant interventions will increase further in the coming decade, with prevalence levels anticipated to reach 18% in men and surpass 21% in women by 2025. 1 Recognizing the rising prevalence of obesity, the member states of the World Health Assembly agreed in 2013 to work towards a target, by 2025, of a 25% reduction in mortality for non‐fcommunicable disease (NCDs) and no increase in the prevalence of adult obesity or diabetes above 2010 levels. 2
To meet their commitments, governments have been encouraged to consider a range of population‐wide policies to influence health behaviour and reduce the obesogenicity of the environment. 3 , 4 , 5 Prominent among these policies are three that are explored in the present paper: (i) to implement fiscal measures in the form of taxes or levies on sugar‐sweetened beverages (SSBs), (ii) to require informative nutritional labelling on the front of packaged foods and beverages and (iii) to reduce the exposure of children to the promotional marketing of specified foods and beverages. According to the World Cancer Research Fund International's NOURISHING database (https://www.wcrf.org/int/policy/nourishing-database), 37 regional or national governments have sugar‐sweetened taxes or levies, six national governments have mandatory front‐of‐pack(FOP) interpretative labelling schemes and over 30 countries have some form of mandatory restriction on marketing of foods to children on one or more forms of media.
Several systematic reviews of the effectiveness of these three policies have been undertaken, 6 , 7 , 8 , 9 , 10 and further ones have been commissioned by the World Health Organization. 11 However, when developing such policies, policy makers also need evidence on contextual factors to inform their recommendations for implementation. In the World Health Organization's Handbook for Guideline Development (2nd Edition), 12 recommendations for policy action are based on the quality of the evidence that the policy will have the anticipated effect, along with seven contextual concerns that will affect implementation: (i) importance and value of the policy for those affected by it, (ii) balance of benefits and harms, (iii) costs and cost‐effectiveness, (iv) priority and prevalence of the health problem, (v) impact on inequities and rights, (vi) acceptability to stakeholders and (vii) feasibility, for example, in terms of cultural and legal frameworks.
The purpose of the present paper is to conduct a narrative review for the three obesity prevention policies (i.e., sugary beverage taxes, FOP labelling and restrictions on marketing to children) to determine how these policies influence three of the contextual factors listed, namely, costs and cost‐effectiveness, impact on inequities and acceptability to stakeholders. We believe these are critical for the success of interventions and will be important to policy makers seeking to justify the introduction and assess the effectiveness, scaling‐up and sustainability of obesity prevention initiatives.
2. METHODS
2.1. Definitions
The WHO Handbook 12 provides further clarity on the three contextual factors reviewed here. For cost and cost‐effectiveness, it states this ‘can be informed by a formal economic evaluation based on estimates collected during evidence retrieval and by modelling of cost–benefit and cost–effectiveness. If a full evaluation is not possible, resource implications can be anticipated and described in a qualitative manner’ (p. 126). Costs to specific industries or to households are not normally part of a cost benefit analysis, but these are described in the present review as they may be relevant to policy makers when evaluating business impacts or household budget implications.
For impact on inequities and rights, it states this concerns how the intervention, or its absence, ‘might affect equity and human rights … The greater the likelihood that implementation of the intervention will reduce inequities or increase equity and the more the intervention has implications for progressive realization of the right to health, the greater the likelihood of a strong recommendation for the intervention’ (p. 127).
For stakeholder acceptability it states that this ‘is affected by several factors, such as who benefits from an intervention and who is harmed by it; who pays for it or saves money on account of it; and when the benefits, harms and costs occur. Lack of acceptability may revolve around the distribution of the benefits, harms and costs of a given intervention; its undesirable short‐term effects despite desirable long‐term effects (benefits); or the ethical principles or judicial considerations involved’ (pp. 127–128).
In order to clarify the literature review, we constructed a PICO table for the three policy interventions: SSB taxes and levies (shortened here to ‘SSB taxes’), FOP interpretative nutritional labelling (‘FOP labelling’) and restricting children's exposure to promotional marketing (‘Marketing’) (Table 1).
TABLE 1.
PICO framework and inclusion/exclusion criteria
| PICO feature | SSB taxes | FOP labelling | Marketing |
|---|---|---|---|
| Population | General population | General population | Children (defined by regulator or <18 years) |
| Interventions | Interventions in respect of sweetened beverages using taxes, levies, duties or tariffs for the purposes of influencing dietary behaviour. | Interventions to provide information on the nutritional content of foods and non‐alcoholic beverages on front panels of food packaging. Excludes nutrition or health claims. Excludes quantitative ingredient listing. Excludes nutrition information panels on side or rear of pack. | Regulatory interventions to restrict the exposure of children to commercial messages for foods and non‐alcoholic beverages or to reduce the strength or impact of those messages. |
| Comparisons | Modelled alternative interventions, before/after time series comparisons, no intervention. | ||
| Outcomes |
Cost implications: cost to regulator, cost to commercial interest and cost savings identified Equity implications: comparisons of impact of the measure on subpopulations defined by socio‐economic measures Acceptability: statements in favour or against policies (made by general public, commercial sectors, civil society groups and health professionals) |
||
2.2. Search methods
Literature searches were undertaken in Medline (PubMed) and Cochrane Library for peer‐reviewed literature and through Google Scholar for additional peer‐reviewed and grey literature. Additional follow‐up was undertaken to assess stakeholder acceptability by examining the references in the literature found and reports from government and intergovernmental agencies and non‐governmental organizations and foundations, commercial associations and professional societies. The search terms used for Medline, Cochrane Library and Google Scholar are shown in Table 2.
TABLE 2.
Search terms
| Medline (PubMed) | Cochrane Library | Google Scholar | |
|---|---|---|---|
| Taxes on sugar‐sweetened beverages |
435 results (fiscal[All Fields] OR tax[All Fields] OR (“taxes”[MeSH Terms] OR “taxes”[All Fields] OR “taxation”[All Fields])) AND (((“food”[MeSH Terms] OR “food”[All Fields]) OR (“beverages”[MeSH Terms] OR “beverages”[All Fields])) AND ((“economics”[Subheading] OR “economics”[All Fields] OR “cost”[All Fields] OR “costs and cost analysis”[MeSH Terms] OR (“costs”[All Fields] AND “cost”[All Fields] AND “analysis”[All Fields]) OR “costs and cost analysis”[All Fields]) OR (“cost‐benefit analysis”[MeSH Terms] OR (“cost‐benefit”[All Fields] AND “analysis”[All Fields]) OR “cost‐benefit analysis”[All Fields] OR (“cost”[All Fields] AND “benefit”[All Fields]) OR “cost benefit”[All Fields]) OR (“health resources”[MeSH Terms] OR (“health”[All Fields] AND “resources”[All Fields]) OR “health resources”[All Fields] OR “resource”[All Fields])) AND ((“socioeconomic factors”[MeSH Terms] OR (“socioeconomic”[All Fields] AND “factors”[All Fields]) OR “socioeconomic factors”[All Fields] OR “inequality”[All Fields]) OR disparity[All Fields] OR (“education”[Subheading] OR “education”[All Fields] OR “educational status”[MeSH Terms] OR (“educational”[All Fields] AND “status”[All Fields]) OR “educational status”[All Fields] OR “education”[All Fields] OR “education”[MeSH Terms]) OR socio‐economic[All Fields] OR (“literacy”[MeSH Terms] OR “literacy”[All Fields]))) |
1 result (fiscal OR tax) AND (food OR beverages) AND ((cost OR cost‐benefit OR resource) OR (inequality OR disparity OR education OR socio‐economic LOR literacy)) |
100 results (fiscal OR tax) AND (food OR beverages) AND ((cost OR cost‐benefit OR resource) OR (inequality OR disparity OR education OR socio‐economic OR literacy)) |
| Front‐of‐pack nutrition labelling |
290 results (“food labeling”[MeSH Terms] OR (“food”[All Fields] AND “labeling”[All Fields]) OR “food labeling”[All Fields] OR (“nutrition”[All Fields] AND “label”[All Fields]) OR “nutrition label”[All Fields]) AND (((“food”[MeSH Terms] OR “food”[All Fields]) OR (“beverages”[MeSH Terms] OR “beverages”[All Fields])) AND ((“economics”[Subheading] OR “economics”[All Fields] OR “cost”[All Fields] OR “costs and cost analysis”[MeSH Terms] OR (“costs”[All Fields] AND “cost”[All Fields] AND “analysis”[All Fields]) OR “costs and cost analysis”[All Fields]) OR (“cost‐benefit analysis”[MeSH Terms] OR (“cost‐benefit”[All Fields] AND “analysis”[All Fields]) OR “cost‐benefit analysis”[All Fields] OR (“cost”[All Fields] AND “benefit”[All Fields]) OR “cost benefit”[All Fields]) OR (“health resources”[MeSH Terms] OR (“health”[All Fields] AND “resources”[All Fields]) OR “health resources”[All Fields] OR “resource”[All Fields])) AND ((“socioeconomic factors”[MeSH Terms] OR (“socioeconomic”[All Fields] AND “factors”[All Fields]) OR “socioeconomic factors”[All Fields] OR “inequality”[All Fields]) OR disparity[All Fields] OR (“education”[Subheading] OR “education”[All Fields] OR “educational status”[MeSH Terms] OR (“educational”[All Fields] AND “status”[All Fields]) OR “educational status”[All Fields] OR “education”[All Fields] OR “education”[MeSH Terms]) OR socio‐economic[All Fields] OR (“literacy”[MeSH Terms] OR “literacy”[All Fields]))) |
1 result (nutrition AND labelling) AND (food OR beverages) AND ((cost OR cost‐benefit OR resource) OR (inequality OR disparity OR education OR socio‐economic OR literacy)) |
100 results (nutrition AND labelling) AND (food OR beverages) AND ((cost OR cost‐benefit OR resource) OR (inequality OR disparity OR education OR socio‐economic OR literacy)) |
| Marketing to children |
156 results (((“marketing”[MeSH Terms] OR “marketing”[All Fields]) OR (“advertising as topic”[MeSH Terms] OR (“advertising”[All Fields] AND “topic”[All Fields]) OR “advertising as topic”[All Fields] OR “advertising”[All Fields]) OR commercials[All Fields]) AND (“child”[MeSH Terms] OR “child”[All Fields])) AND ((“food”[MeSH Terms] OR “food”[All Fields]) OR (“beverages”[MeSH Terms] OR “beverages”[All Fields])) AND ((“economics”[Subheading] OR “economics”[All Fields] OR “cost”[All Fields] OR “costs and cost analysis”[MeSH Terms] OR (“costs”[All Fields] AND “cost”[All Fields] AND “analysis”[All Fields]) OR “costs and cost analysis”[All Fields]) OR (“cost‐benefit analysis”[MeSH Terms] OR (“cost‐benefit”[All Fields] AND “analysis”[All Fields]) OR “cost‐benefit analysis”[All Fields] OR (“cost”[All Fields] AND “benefit”[All Fields]) OR “cost benefit”[All Fields]) OR (“health resources”[MeSH Terms] OR (“health”[All Fields] AND “resources”[All Fields]) OR “health resources”[All Fields] OR “resource”[All Fields])) AND ((“socioeconomic factors”[MeSH Terms] OR (“socioeconomic”[All Fields] AND “factors”[All Fields]) OR “socioeconomic factors”[All Fields] OR “inequality”[All Fields]) OR disparity[All Fields] OR (“education”[Subheading] OR “education”[All Fields] OR “educational status”[MeSH Terms] OR (“educational”[All Fields] AND “status”[All Fields]) OR “educational status”[All Fields] OR “education”[All Fields] OR “education”[MeSH Terms]) OR socio‐economic[All Fields] OR (“literacy”[MeSH Terms] OR “literacy”[All Fields])) |
2 results ((marketing OR advertising OR commercials) AND child) AND (food OR beverages) AND ((cost OR cost‐benefit OR resource) OR (inequality OR disparity OR education OR socio‐economic OR literacy)) |
100 results ((marketing OR advertising OR commercials) AND child) AND (food OR beverages) AND ((cost OR cost‐benefit OR resource) OR (inequality OR disparity OR education OR socio‐economic OR literacy)) |
Papers were restricted to English language available publications. For the Medline and Cochrane Library searches, the results included primary studies and reviews and included all material in the database up to the date of the search: 5 June 2019 for Medline and 1 November 2019 for the Cochrane Library. For Google Scholar, the first 100 results listed by relevance were examined for each of the three policy intervention searches. This search was conducted and results downloaded on 13 June 2019.
Data extraction was undertaken by two researchers separately and cross checked in overlapped samples. Data extraction followed a template requesting summary findings relevant to the tables shown below, along with material for illustrative case studies (reported in Panels 1–4), and to identify evidence gaps. Data were collected for each of the three contextual factors (costs, equity and acceptability), taking in turn each of the three policies (SSB taxes, FOP labelling and marketing).
Panel 1. Fiscal measures in Hungary: Equity impacts.
A peer‐reviewed paper by Biró 35 used data collected a little more than a year after the introduction of the PHP tax and compared the pattern of household purchases of ‘processed’ (including taxed) foods and ‘unprocessed’ (not including taxed foods) during the previous 5 years. Beverages were excluded from the analysis as the consumption data could not distinguish sufficiently the taxed from the untaxed types of product. The author reports small but significant changes in the patterns of consumption following the introduction of the PHP tax:
Purchased quantities of processed foods declined after the tax (3.4%) not only in the categories that were subject to tax but also in other categories too (e.g., processed meat and dairy products).
Expenditure on processed foods increased after the tax (6.5%).
There was no change in the purchased quantities of unprocessed foods and weak evidence of an increase in expenditure on unprocessed foods.
The increased range and size of the tax imposed in January 2012 led to a stronger rise in the purchase of unprocessed foods.
For households in the lowest income quartile, expenditure on and quantities purchased of both processed and unprocessed foods declined, especially expenditure on processed foods.
Households in the top two income quartiles showed the greatest increase in expenditure on processed foods.
From these findings, Biró 35 concluded that the tax had the desired effect of improving the healthfulness of the diet primarily among lower income households, probably because lower income families were likely to have a higher sensitivity to food prices, whereas better‐off households tended to absorb the extra costs of the tax.
Evaluations published jointly by the WHO and the Hungarian National Institute for Health were based on survey data, taking a subsample of the 2014 Hungarian National Diet and Nutritional Status Survey of adults. 14 , 16 , 36 , 37 Data were collected by interview, which included items on product consumption frequency, changes in consumption patterns since the PHP tax, the reasons for changing consumption, what products were being substituted, and knowledge about the PHP tax and the products taxed. Interviewee background variables included educational level and anthropometric measures (height, weight and waist circumference). Results showed the following:
The majority of consumers maintained a lower consumption of the taxed products, with a significant minority showing lower consumption in 2014 than a previous study found in 2012.
A significant number of participants stated that they cut their consumption due to awareness of the unhealthfulness of the products. A second reason for reducing consumption (especially for sugary drinks) was the increased price.
Reduced consumption of unhealthy products was more common among adults with overweight and obesity compared with adults with normal weight or underweight. Socio‐economic differentials were found.
In every product group, a greater proportion of adults with lower (primary) education than with higher education changed their consumption in one way or another.
A change to lower priced products and to different (cheaper) brands was found among those adults with lower levels of education compared those with higher levels of education.
Among lower educated adults who reduced consumption, only a small proportion stated the reason was based on discovering that the product was unhealthy whereas price was a reason cited by a large proportion.
The evidence in the evaluations of the Hungarian PHP tax supports modelling studies which predict that people in lower socio‐economic groups are particularly sensitive to price and will find cheaper products and brands and reduce overall consumption following price rises. The fact that higher income groups tended to continue their original consumption patterns and to pay the PHP tax indicates different price elasticities and behavioural responses across socio‐economic groups. It also indicates that tax revenue can be raised from higher income earners, and in the case of the hypothecated arrangement in Hungary, this revenue is dedicated to public health service provision in the country, a counter‐regressive measure.
Panel 4. Front‐of‐pack labelling in France: Equity impacts.
A French study of consumer behaviour in a laboratory model retail environment compared five FOP labelling formats and evaluated purchasing behaviour of a panel of shoppers before and after the introduction of each format label. 76 The participant's scores were analysed for the group as a whole (691 participants) and also for the subset of participants whose monthly household income fell below €2000 (270 participants). The results showed that income levels made little difference to the results: The Nutri‐Score format (later adopted by the national government) remained the most effective, with an increase in the healthfulness of their choices shown by the lower income participants that was nearly as large as that seen for the group as a whole. A similar study from the same research group found the colour‐codedNutri‐Score format to have the greatest impact among individuals with no nutritional knowledge, compared with other formats. 77
These findings support earlier results from the same research group that showed that the highest percentage of participants favouring simpler formats (e.g., a single symbol or single set of traffic lights rather than multiple traffic lights) came from lower educated groups and manual workers, whereas the highest percentage of participants favouring more complex formats (such as multiple traffic lights and a spectrum model) were from higher educated groups and managerial workers. 78 That paper concluded by suggesting that simpler formats should be preferred ‘so as to efficiently target subgroups with low socio‐economic status and poor nutritional knowledge, and who are thus at higher risk of diet‐related chronic diseases than other segments of the population’ (p. 401).
The authors of the 2017 study conclude that the Nutri‐Score format is significantly more efficient than others, including for disadvantaged populations. This conclusion was echoed in a statement made by the French health minister, Marisol Touraine, when she launched the scheme in March 2017: ‘The first question was whether or not simplified nutrition labelling systems were likely to lead to changes in consumers' purchasing behaviour. The answer is clearly yes … The combination of multiple approaches systematically explored (by categories of products, buyers, etc.) reveals a clear overall superiority for Nutri‐Score … This advantage of Nutri‐score is even more marked when we observe specifically the behaviour of consumers who buy the cheapest products’. 79
3. FINDINGS
For the search of the Medline (PubMed) and Cochrane Library datasets, the PRISMA charts (Figure 1) indicate the numbers of records returned from the searches for each of the three policy interventions, and the subsequent examination and filtering of these records to obtain papers for data extraction. A fourth PRISMA chart in Figure 1 shows the records obtained from the Google Scholar search and the subsequent examination and filtering of these records to obtain papers for data extraction.
FIGURE 1.
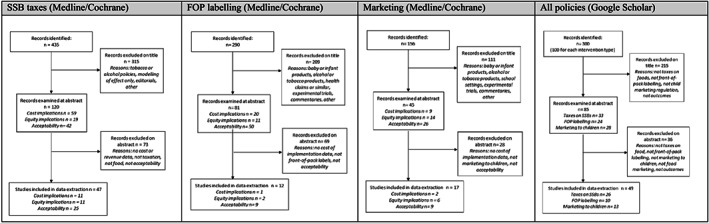
PRISMA charts for three policy interventions using Medline, Cochrane Library and Google Scholar
Analyses of the references in the selected literature led to further reports considered important to include in the present review. The searches of governmental, non‐governmental and other sites produced a wide range of papers which were examined after the main data extraction exercise, in order to assess the scope of additional information they could provide. Over 100 documents were reviewed. In particular, the information on stakeholder views and acceptability was considerably enhanced, especially in consultation responses (the sites examined included those of Codex Alimentarus, European Commission, UK government and parliament and Australian government). Future research efforts could be more intensively focused on this source of information as a rich source of stakeholders' stated positions.
From the Medline and Cochrane Library searches, 76 documents were used for data extraction and citation in the present report, comprising 47 documents for SSB taxes, 12 for FOP labelling and 17 for marketing to children. From the Google Scholar and follow‐up searches, a further 49 documents were used, comprising 26 documents were used for SSB taxes, 10 for FOP labelling and 13 for children's marketing.
The results are described here in three parts: for SSB taxes, FOP labelling and marketing policies. In each part, results are described for the three main factors under review: (i) cost implications, (ii) equity implications and (iii) acceptability to stakeholders. This is followed by a section concerning gaps in the evidence.
3.1. SSB taxes
A total of 47 documents retrieved from the Medline and Cochrane Library datasets were eligible for examination (11 concerning cost implications, 11 concerning equity implications and 25 concerning stakeholder acceptability). A further 26 documents were eligible from the search of Google Scholar and follow‐up. Details of the countries referred to in the documents are given in the narrative review below.
3.1.1. Cost implications
Work by the Organization for Cooperation and Development (OECD) has indicated cost benefit advantages to be gained from ‘fiscal measures that increase the price of unhealthy food content or reduce the cost of healthy foods rich in fibre’ such as fruits and vegetables. 13 The study was a general comparative modelling study using data from Brazil, China, India, Mexico, Russia, South Africa and England. The assessment of the costs is described only sparsely as ‘administration, training, mass media, and other activities’, but the use of fiscal measures is endorsed as cost‐effective. In a subsequent 2019 review, the OECD includes estimates of the costs and benefits of policy interventions but does not include fiscal measures among the policies examined. 5
In July 2011, Hungary passed legislation to impose taxes applied on the salt, sugar and stimulant content of various categories of foods and beverages including sugar‐sweetened drinks, energy drinks and pre‐packagedsugar‐sweetened products. 14 Direct benefits of the tax hypothecated for the health services averaged around HUF 20bn per year for 2012, 2013 and 2014. 15 Costs of implementation for the state are not available. Concerns that the tax might significantly reduce manufacturers' revenue and increase unemployment were addressed in a study of the Hungarian tax published by the WHO in 2013 which found that, of the 35 companies paying the most (over 80%) tax, net sales revenue and number of employees increased from 2010 to 2011, the years before and after introduction of the tax. 16
Very few research papers make estimates of the costs of implementing health‐related food taxes or subsidies or of the resources that may be generated by the revenue from taxes. It can be argued that tax payments are a transfer payment, not an expenditure or resource cost, and that tax revenue should be excluded from cost–benefit or cost‐effectiveness calculations. However, the resources generated for governments may be part of the policy analysis, and we report estimates of these here. The 2009 ACE Obesity studies 17 on cost‐effective policies did not assess fiscal interventions, but an update from Sacks et al. 18 modelled Australian data and estimated that a ‘junk food’ tax would cost $AU18m annually after introduction, based on steady‐state costs of administering the tax. This study used the WHO‐CHOICE methods 19 for estimating cost‐effectiveness of health policies. Long et al. 20 estimated that implementing an SSB excise tax in the United States would generate revenues of $US12.5bn annually while its implementation cost would be less than 1% of that cost in the first year, at $US51m, based on tax‐collection agents' salaries and industry auditing and tax‐reporting costs (see also Gortmaker et al. 21 ). A second Australian study, by Lal et al. 22 estimated revenues from an SSB tax to be $AU650m annually with intervention costs of $AU5m in the first year and $AU4m in subsequent years.
The UK government's 2018 soft drinks industry levy on SSBs raised over £150m in the first 6 months of its implementation and £336 m in the most recent year (October2018–September2019), 23 which is hypothecated to promote physical activity in primary schools. 24 The SSB tax in Mexico is reported to have raised over $1.2bn in 2014. 25
Few studies have been made of the costs to industry in lost sales of SSBs, or compensatory increases in low‐sugar or nonsugar beverage sales. A time‐series study of the SSB tax in Berkeley, California, 26 found that retailers experienced little impact on overall sales: as sales of taxed beverages declined, sales of nontaxed beverages increased and consumer spending per transaction remained unaffected.
Two papers analysed the cost of imposing a health‐related food tax in terms of impact on employment. Powell et al. 27 considered an SSB tax and used a macroeconomic simulation model taking account of reduced demand for beverages, increased tax revenues and effects on income levels, in California and Illinois. They found a net increase in employment, with declines in the industry offset by new employment in nonbeverage industries and in government sectors. Guerrero‐López et al. 28 used time‐series data in the beverage and snack‐food industries and in retail stores following the imposition of taxes in Mexico and found no significant change in employment in the relevant manufacturing industries and a small increase in employment in retail stores. It might be argued on a priori grounds that employment levels are very low in a highly automated production plant for ultra‐processed beverages and snacks capable of long storage periods, compared with employment levels in less automated production for fresh and perishable foods, but the authors found no analyses to test this suggestion.
3.1.2. Equity implications
Health‐related taxes are designed to fulfil two purposes: to deter the purchase of a product by raising its price and to raise tax revenues which may or may not be directed specifically for health purposes. The application of health‐related food taxes is criticized by some parties (see ‘acceptability’ below) for their impact on lower income households, for whom food purchases constitute a substantial part of their earnings, potentially making the tax regressive (taking a larger percentage of income from low‐income earners than from high‐income earners). Equally, if it is more effective as a disincentive among higher level consumers of unhealthy products, it would have a greater targeted impact on health improvement.
The evidence for social disparities in the impact of health‐related food taxes has depended primarily on modelling using econometric methods for estimating consumer demand in relation to price fluctuation and most recently on the few examples of real‐life case studies. Recent examples include Peñalvo et al. 29 showing health benefits of food taxes to be greatest among lower socio‐economic populations in the United States and Lal et al. 22 showing greatest health benefits from SSB taxes for the most socially disadvantaged groups in Australia. A second Australian modelling study 30 found that a volumetric SSB tax (20c per litre) gave greater reduction in per capita bodyweight than a valoric tax (20% of sale price) and also imposed a lower tax burden and that this comparison held especially for lower income households.
A systematic review of 11 studies 31 found that taxation of SSBs would be expected to lead to similar reductions in bodyweight across all socio‐economic groups with some studies showing greater bodyweight benefits in lower socio‐economic groups (higher consumers). A second review of 12 studies 32 concluded that taxation reduced consumption among those who consumed most and that health benefits were therefore likely to be distributed similarly.
A modelling study in Denmark that specifically examined how households in different socio‐economic groups would respond to fluctuation in food prices showed that even small changes in value added taxes could differentially improve the diet of poorer people. 33 The study focused on the consumption of saturated fats, fibre and sugar and found the dietary impact of taxes is stronger for lower social classes than in other groups of the population.
For Hungary and Mexico, two series of documents are available, one on the impact of taxes on products high in salt and sugar (known as the Public Health Product tax) introduced in Hungary 14 in 2011 and one on the impact of similar taxes introduced in Mexico 34 in 2014 (see Panels 1 and 2). In brief, the Hungarian studies found that people in lower socio‐economic groups are particularly sensitive to price and will seek cheaper products and reduce overall consumption following price rises, whereas higher income groups tend to continue their original consumption patterns and to pay the additional tax. This indicates different price elasticities and behavioural responses across socio‐economic groups and that tax revenue can be raised from higher income earners, which can be dedicated to public health service provision in the country (a socially progressive measure). The Mexican studies show a sustained decrease in consumption of taxed products, and those with lowest socio‐economic status (SES) had the greatest reduction in purchases. 34 Households that initially showed greater preferences for taxed foods showed a larger decline in taxed food purchases.
Panel 2. Fiscal measures in Mexico: Equity impacts.
A series of papers from the Mexican Institute for Public Health, published with the University of North Carolina and supported by the Robert Wood Johnson Foundation, have analysed the data on sales of soft drinks and on non‐essential (snack) foods, after the introduction of the health‐related taxes in January 2014. 34 , 38 , 39 The evidence has been used widely in policy‐related documents, for example, by Public Health England 40 and the WHO. 41
In summary, first year data showed purchases of taxed beverages decreased by 4% initially, rising to a 12% decline by December 2014. 39 All three socio‐economic groups analysed showed a reduction in purchases of taxed beverages, but reductions were higher among the households of low SES, averaging a 9% decline during 2014, and up to a 17% decrease by December 2014, compared with pre‐tax trends.
A second‐year study 42 showed purchases of taxed beverages decreased 5.5% on average in 2014 and 9.7% in 2015. Households at the lowest socio‐economic level had the largest decreases in purchases of taxed beverages in both years. A second paper on this data showed that, among households with the highest levels of consumption of taxed beverages, those with lowest SES had the greatest reduction in purchases of taxed beverages. 38
A study of snack foods 38 (non‐essential, high‐energy dense products which were also subject to a health‐related tax) showed post‐tax declines in the taxed food purchases of 4.8% in Year 1 and 7.4% in Year 2, yielding a 2‐year mean decline of 6.0%. Households with greater preferences for taxed foods showed a larger decline in taxed food purchases.
An exception is reported for Chile, where a 5% sales tax on SSBs led to greater reduction of consumption among higher income groups than lower income groups 43 , 44 possibly indicating that the tax itself was too small to have purchasing effects, but the messaging accompanying the introduction of the tax had an effect on behaviour in higher income groups. 10
3.1.3. Acceptability to stakeholders
This section describes the documented views of stakeholders by category, as shown in Table 3. Few peer‐reviewed papers were found in the searches, so additional material was sought in consultation responses, stakeholder statements and grey literature reports. This may lead to conclusions that are biased by the availability of material or the type of source. It is a major concern and needs addressing in further studies.
TABLE 3.
Acceptability of sugar‐sweetened beverage (SSB) tax policies to stakeholders
| Stakeholder | Supportive | Opposing |
|---|---|---|
| General public | South Korea: 72% adults support health taxes in general (includes tobacco and alcohol and unhealthy food). 45 New Zealand: broad support across stakeholders 46 and 10 000 petition to government for tax. 47 Australia: citizens' juries support for three measures—education, front‐of‐pack labelling and food taxes. 48 , 49 United States: tax support strongest among Democrats, women and those concerned for child obesity 50 and when reinvested in health. 51 Israel: support for tax dependent on use for health promotion (mix of stakeholders). 52 A systematic review of the literature concluded that public acceptability was increased if the revenue was used for beneficial purposes. 53 | South Africa: cynicism that the tax is for health purposes, not government revenue. 54 United Kingdom: mistrust of the use of the revenue, and concern tax is insufficient or ineffective as a dietary intervention. 55 , 56 United States: a public opinion survey in 2011 found the majority viewed SSB taxes as arbitrary and ineffective for changing general dietary behaviour, an intrusion into privacy and harmful to the poor. 57 |
| Commercial interests: manufacturers | United Kingdom: 22% not opposed to SSB levy in treasury consultation. 58 | South Africa: preference for self‐regulation and public–private partnerships. 59 Denmark: strong lobbying and judicial action against fat tax. 60 , 61 United Kingdom: 78% opposed to the SSB levy, expressing concerns over definitions of sugar (added, free, extrinsic) and the inclusion of juices or milk drinks. 58 |
| Commercial interests: retailers | United Kingdom: treasury consultation—SSB levy received support from large majority (73%) of retailers. 58 | |
| Civil society groups | Australia: 10 leading health and community organizations support tax. 62 UK levy supported Jamie Oliver Foundation, Sustain, Obesity Health Alliance, Food Foundation and others. 63 , 64 | United Kingdom: Institute for Economic Affairs, UK Tax Payers' Alliance and campaign group ‘People Against the Sugar Tax’. 58 |
| Health professionals | Supported by US Society of Behavioral Medicine, 65 Dietitians of Canada, 66 British Medical Association (sugar tax with fruit and veg subsidy) 67 and other UK medical bodies. 68 In a UK government consultation on SSB levy, 95% of medical and health bodies were supportive. 58 |
The present review found that surveys of the public show general support for health‐related taxes, especially if these are used for clear health benefits, although there is some concern that the taxes are not effective at changing behaviour and may be regressive (increasing the financial burden on lower income families). Stakeholders with commercial interest in the sale of high in fat, sugar or salt (HFSS) foods tend to oppose increased taxes or levies, whereas those concerned with health or consumer protection generally favour fiscal measures as a means to intervene in food systems.
3.2. FOP nutrition labelling interventions
A total of 12 documents retrieved from the Medline and Cochrane Library datasets were eligible for examination (one concerning cost implications, two concerning equity implications and nine concerning stakeholder acceptability). A further 10 documents were eligible from the search of Google Scholar and follow‐up. Details of the countries referred to in the documents are given in the narrative review below.
3.2.1. Cost implications
The OECD has indicated cost benefit advantages to be gained from ‘regulatory measures that improve nutritional information’, primarily through FOP food labelling. 13 The study was a general comparative modelling study using data from Brazil, China, India, Mexico, Russia, South Africa and England. The assessment of the costs is described only sparsely as ‘administration, training, mass media, and other activities’, but the use of food labelling measures is endorsed as cost‐effective. A later review by OECD estimates the costs to industry of food labelling, finding that the costs are primarily for redesigning and printing the packaging, and possibly reformulating products to improve their labelling profiles. 5
Very few research papers make estimates of the costs of implementing FOP labelling measures. The 2009 ACE Obesity 17 studies on cost‐effective policies did not assess labelling interventions, but an update from Sacks et al. 18 modelled Australia data and estimated that a traffic light labelling scheme would cost $AU81m annually after introduction (including implementing the legislation and food industry repackaging costs). This study found the measure to be dominant (i.e., to save more than it cost).
Concerning back‐of‐pack labelling, the US Food and Drug Administration made a cost benefit analysis for the introduction of the revised Nutrition Facts labelling in 2016. 69 It found mean costs of $0.5bn and benefits of $2.0bn per year, calculated over 20 years, in 2014 dollars, at 7% interest. The FDA also required manufacturers to comply with the rules within 2 years for larger companies, and 3 years for smaller companies, subsequently extended a further 18 months for both deadlines. 70
3.2.2. Equity implications
There are few studies of the impact of FOP nutritional labelling (FOPNL) differentiated by ethnic, educational, occupational or other socio‐economic group. It can be argued that informational labelling helps those who are already seeking healthy foods, implying a potentially regressive effect if those with the most education and health consciousness respond to the labelling. Labels with clear colour coding or other form of warning might be more likely to reach audiences beyond the health conscious. There is some empirical evidence from two countries: the United Kingdom, which implemented a policy of voluntary FOP traffic light labelling in 2006, and France which introduced a voluntary colour‐coded FOP label in 2017 (see Panels 3 and 4). In summary, the evidence shows that, in the United Kingdom, a colour‐coded ‘traffic light’ format tended to be better understood by lower income or lesser educated consumers than was a numerical format, and in France, colour‐codedformats—especially a single‐colour ‘Nutri‐Score’ format—were better understood and preferred by lower income and lesser educated consumers, and affected their purchasing behaviour.
Panel 3. Front‐of‐pack labelling in the United Kingdom: Equity impacts.
Methodological approaches differ: In some trials, the researchers used a consumer panel to provide assessments of different designs for comprehension and choices, or a focus group to provide insights and opinions on suitability of label designs. In one UK study, data were collected by a retailer electronically at the point of sale, before and after the introduction of a ‘traffic light’ colour‐coded FOP labelling scheme.
Among adults, a panel trial of % Guideline Daily Amounts (%GDA, a scheme proposed by the food industry to summarize the content of key nutrients numerically) and traffic light formats showed that %GDA was better understood by participants in social classes A, B and C1 compared with social classes C2, D and E. 71 Seventy‐six percent of adults in the A, B and C1 group understood the %GDA format, compared with 60% of adults in the C2, D and E group. Despite being unfamiliar with the colour‐coding based on per 100‐g portions, a greater proportion of lower class adults (24%) compared with higher class adults (17%) understood that a red signal implied high level of a relevant nutrient (either per 100 g or per product).
A series of panel tests conducted for the Food Standards Agency 72 found that the coexistence of a number of different label formats in the marketplace causes consumer confusion and a single approach would enhance use and comprehension of labels. The best‐comprehended component used on labels was text (the words ‘high, medium and low’), the next best was traffic light colour coding and the least comprehended was %GDA information. A format that combined all three approaches in one display had the highest comprehension for all SES groups.
The UK government launched a series of ‘citizens’ forums comprising a nationwide series of discussion groups set up to establish a dialogue with the public on food. 73 Topics included FOP labelling and the summary report from the citizens' forums noted ‘… concern that those with poor numeracy and literacy skills could find certain numerical elements on the Front of Pack—such as percentage of GDA or amounts of nutrients in grams—difficult to manipulate and make comparisons with. These individuals lacked confidence in dealing with numbers and as such were likely to feel discouraged from using the labels or reach incorrect conclusions as to the nutritional value of a product when using them’ (pp. 22–23). 73
A second comment echoed these concerns: ‘… respondents perceived that the use of nutritional values to make healthier choices required the consumer to calculate the amount of nutrients contained in the food they have chosen and the amount consumed across the day. This was considered inconvenient or difficult to use, especially for those consumers with poor numeracy and literacy skills. Having too much information on the nutrition label, for example expressing the nutritional values in grams and as a percentage of the Guideline Daily Amount, could also be confusing for these consumers’ (p. 30). 73
It should be noted that a UK government survey in 2011 found 29% of the adult population had insufficient numeracy skills (below Level 2) such that ‘they may not be able to compare products and services for the best buy, or work out a household budget’. 74
In a different approach, a study of retailers electronic sales figures before and after the introduction of a limited set of products carrying the UK ‘traffic light’ colour‐coded FOP signalling was undertaken in 2007. 75 Sales figures for the 4 weeks prior to label introduction and the 4 weeks following were analysed for two product categories: ready meals and sandwiches. Data for ready meals included subgroup analysis for social group. Results showed that all products increased in sales, but the increased sales for the healthiest product tended to be greater than for the least healthy products for most subgroups, including lower income or less‐educated consumers.
3.2.3. Acceptability to stakeholders
This section reports the documented views of stakeholders by category, as shown in Table 4. Sources include consultation responses (primarily the UK government's proposals concerning FOP labelling) and various peer‐reviewed and grey literature reports. The evidence indicates general support for increased nutrition information, especially in easily understood formats. Stakeholders with commercial interest in the sale of HFSS foods have been resistant but are increasingly accepting some formats, especially among retail chains' own‐brand products, whereas health and consumer groups are strongly in favour, especially if the format clearly indicates products which do not contribute to healthy eating patterns.
TABLE 4.
Acceptability of front‐of‐pack(FOP) nutrition labelling policies to stakeholders
| Stakeholder | Supportive | Opposing |
|---|---|---|
| General public | Many European public‐interest consumer organizations call for interpretive FOP labels. 80 As FOP labelling becomes more widespread, recent surveys show public support (e.g., Canadian youth 81 and Australian parents 82 ). UK retailers have reported that their customers have demanded traffic light colours on FOP labels on products. 83 | Some concerns over the FOP format: multiple traffic lights versus single colour, keyhole symbol, numerical formats and socio‐economic impacts. 73 , 77 |
| Commercial interests: manufacturers |
Most manufacturers support %GDAs, some support interpretive FOP formats including colour coding. 84 , 85 Nestlé: Recent moves to promote traffic light labelling in EU subject to regulatory approval. 86 |
Historic opposition to traffic light schemes as ‘demonizing’ individual products. Continues in some countries, for example, Italy. 87 Labels should not deter ‘the most healthy and genuine pleasures’ Ferrero. 88 FoodDrink Europe have urged Codex to ensure the FOP labelling proposal follows existing guidance on claims and labels, especially to avoid labelling ‘which could arouse or exploit fear in the consumer’ … and that the information contained in the nutrient declaration ‘should not lead consumers to believe that there is exact quantitative knowledge of what individuals should eat in order to maintain health, but rather to convey an understanding of the quantity of nutrients contained in the product’. 89 |
| Commercial interests: retailers |
Many retailers (majority in the United Kingdom) have adopted FOP labels. 90 FOP labels have increased demand for healthier foods. 83 |
United Kingdom: some opposition to traffic light formats in 2011. 91 Tesco UK: ‘Overly complex labelling requirements are difficult to comply with and difficult to enforce even for well‐resourced companies … a particular challenge for smaller and medium sized suppliers … imposes cost burdens and increases the risk of non‐compliance’. 92 |
| Civil society groups |
Consumers International (CI) supports Codex measures for FOP if they ‘are government mandated; support the right to health; are aligned with WHO recommendations; protect a country's ability to develop a FOPNL that is suitable to that country's needs and responsive to their disease burdens; and protect against conflict of interest’. 93 With 10 other international non‐governmental organizations, CI urged Codex to empower governments to mandate clear FOP labelling. 94 UK consultation response: consensus support for consistent, single system of FOP labels which combines interpretive additional forms of expression: traffic light colours and wording ‘high, medium, low’ for energy, fat, saturates, sugars and salt; labels should be informative and easy to understand ‘at a glance’ and interpretive additional forms of expression incentivize food businesses to reformulate foods and drink. 95 British Market Research Bureau: FOP labels with interpretive additional forms of expression are helpful for consumers across all socio‐economic groups. 96 |
Numerical formats (e.g., %GDAs) not understood by many adults or children (see ‘equity’ concerns, above). 97 UK consultation consensus opposition to %GDA labels: unclear whether they represent a maximum or a target amount; based on arbitrary portion sizes; GDA signals lack colour coding; not shown to support consumers across all socio‐economic groups or incentivize reformulation. 95 |
| Health professionals | Consensus support in the United Kingdom for consistent, single system of FOP labels which combine interpretive additional forms of expression: traffic light colours and wording ‘high, medium, low’ for energy, fat, saturates, sugars and salt; they should help consumers to know ‘at a glance’ what is in the food at point of purchase, and this should incentivize food businesses to reformulate foods and drinks. 95 | Concern that the Codex process could lead to guidance reflecting the ‘lowest common denominator’ and could limit or constrain policy space for countries desiring to implement innovative, mandatory and/or strongly interpretive (rather than descriptive) forms of labelling. 98 |
Abbreviation: GDAs, Guideline Daily Amounts.
3.3. Interventions to restrict children's exposure to the marketing of unhealthy foods and beverages
A total of 17 documents retrieved from the Medline and Cochrane Library datasets were eligible for examination (two concerning cost implications, six concerning equity implications and nine concerning stakeholder acceptability). A further 13 documents were eligible from the search of Google Scholar and follow‐up. Details of the countries referred to in the documents are given in the narrative review below.
3.3.1. Cost implications
Modelling by the OECD considers cost benefit advantages to be gained from measures to restrict the marketing of unhealthy foods to children. 13 The study is a general comparative modelling study using data from Brazil, China, India, Mexico, Russia, South Africa and England. The assessment of the costs is described only sparsely as ‘administration, training, mass media, and other activities’, but the use of regulations to reduce children's exposure to promotional marketing of less healthy foods and beverages is stated to be the single most cost‐effective measure analysed by the OECD authors.
A later review from the OECD included estimates of the costs to industry of policy interventions including marketing 5 and found that advertising restrictions or bans can result in costs to a company if an alternative marketing strategy is needed but notes that ‘partial bans have generally resulted in a shift of marketing spend and sales rather than a reduction’. This implies that the costs borne by advertising agencies and by commercial media if food and beverage advertising is restricted will also be offset by other sources of advertising revenue.
The 2009 ACE Obesity 17 studies on cost‐effective policies included ‘reduction of TV advertising of high fat and/or high sugar foods and drinks to children’ as one of the policy interventions modelled for cost‐effectiveness. The policy was the most cost‐effective of the 13 child‐oriented policies evaluated. Costs were based on the need for monitoring and enforcing compliance with revised regulation, and they did not include any costs associated with changing the regulations, additional food costs to families in switching products or the impact on revenue stream of advertising companies or producers of foods. A recent study from Australia by Brown et al. 99 modelled the cost‐effectiveness of restricting TV advertising of foods HFSS until 9.30 pm and found the measure likely to be cost saving, with 1.4 times higher total cost savings and 1.5 times higher health benefits in the most disadvantaged socio‐economic group.
Gortmaker et al. 21 included a slightly different policy in an analysis of cost‐effectiveness of seven interventions for childhood obesity. It used systematic reviews and a microsimulation modelling approach to estimate the cost‐effectiveness of removing tax subsidies for advertisements promoting unhealthy food and beverages to children (i.e., removing such advertising from tax‐deductible expenses claimed by businesses in their tax returns). This measure was estimated to be cost saving, the benefits in health care savings being greater than the costs to implement the policy.
3.3.2. Equity implications
Although there is considerable evidence linking socio‐economic disparities to different dietary patterns, including higher levels of consumption of foods which are highly advertised—notably soft drinks, sweetened breakfast cereals, confectionery, savoury snacks and fast food stores—among lower income or lesser educated families, there is a lack of clear evidence directly linking the advertising of these products to consumption levels at household level or among children in particular. Such evidence would provide a potential causal link between differential exposure to marketing and differential consumption patterns.
A review by Lupiáñez‐Villanueva et al. 100 used mixed methods including a literature review to analyse marketing through social media in reaction to social disparities but found a lack of definitive evidence. They found evidence that ‘children from families with a higher socioeconomic status were able to recognise other types of food logos that differed from the popular fast food’ and also differential concerns by parents about digital advertising: those who described themselves as part of the lowest social status groups tended to worry more about data tracking, digital identity theft, unhealthy lifestyle ads and spending too much money on in‐app purchases, whereas parents of higher social status groups showed more concern about targeted advertisements in addition to data tracking and digital identity theft.
A review by Public Health England 101 found insufficient evidence of different exposure across socio‐economic groups but noted the potential for differential responses to marketing interventions. The review cited a study by Adams et al. 102 of family viewing and exposure to food advertising, which found total exposure to all food advertising and to HFSS food advertising was more than twice as high among the least compared with the most affluent viewers. In a study of US television family programming, Harris et al. 103 found fast food advertisements appear more frequently during African American‐targeted TV programming than during general audience programming. A follow‐up report found that disparities in exposure to advertising for HFSS foods increased over the period 2013–2017, with ethnically Black children particularly highly exposed. 104 Also in the United States, a controlled study by Zimmerman and Shimoga 105 found that low‐income students ate more unhealthy snacks (and more total calories) after advertising exposure than higher income students.
A study in Norway by Klepp et al. 106 found that lower class children watch more TV and have greater exposure to both healthy and unhealthy food advertisements. Children exposed to healthier food advertisements ate more fruit and vegetables. A correlational study of the Health Behaviour of Schoolchildren survey by Vereecken et al. 107 found higher levels of TV viewing in lower class households. Higher viewing was significantly associated with greater consumption of confectionery, snacks and lower consumption of fruit and vegetables (after controlling for SES). A study in the United States by Donohue et al. 108 conducted in the 1970s found that children's understanding of the intention of advertising differed by ethnic group: 39% of children from African‐American households did not understand the intention of advertising, compared with 18.9% of White children.
Lastly, a review by Mills et al. 109 noted the lack of evidence, reporting that ‘important details such as socio‐economic position and ethnicity were rarely provided’. A review of health inequities and food marketing undertaken for the European Commission 110 noted: ‘There is a significant lack of evidence on which to base a firm conclusion. … [In principle] interventions in marketing would benefit all groups without widening or narrowing SES differentials in health behaviour. Interventions to reduce TV advertising should have greater impact in lower SES groups, as both exposure and responsiveness to advertising of unhealthy foods are highest in lower SES groups’ (p. 47).
3.3.3. Acceptability to stakeholders
This section reports the documented views of stakeholders by category, as shown in Table 5. Sources include consultation responses, stakeholder statements and various peer‐reviewed and grey literature reports. The evidence indicates support for controls on marketing to children among the general public, tempered by concerns over limiting free speech. Commercial stakeholders have resisted regulation and offered voluntary measures. Health and consumer groups are strongly in favour of statutory controls.
TABLE 5.
Acceptability of marketing restriction policies to stakeholders
| Stakeholder | Supportive | Opposing |
|---|---|---|
| General public | Opinion polls in the United Kingdom show a majority (69%) support comprehensive measures to protect children from HFSS food marketing pressure across all media. 111 In South Korea, 44% of a sample of general population adults supported controls on TV food marketing, 45 56% in the United States (with 8% strongly opposed) 112 and widespread support across Europe. 113 | Concerns in Mexico over limiting free speech, 114 views that parents are responsible, not companies. 115 |
| Commercial interests: manufacturers | Support voluntary but opposed to mandatory regulation: have undertaken gradual introduction of increasingly specific voluntary measures through the IFBA 116 and regional initiatives such as the European Pledge 117 and the US CFBAI 118 | |
| Commercial interests: advertising agencies | UK Advertising Association: children's exposure to HFSS advertising is low and insignificant; calorie intakes have decreased in recent decades; the key factors associated with child obesity are not caused by advertising; HFSS advertising restrictions implemented in the United Kingdom have failed to reduce or curb a rise in child obesity; policies should focus on increasing physical activity and community‐level interventions. 119 | |
| Civil society groups |
UK Obesity Health Alliance of 40 NGOs: Governments have a duty to protect children from commercial pressures to consume unhealthy food; legislative, regulatory approaches are preferred to self‐regulation. 120 Consumers International and World Obesity Federation: proposal Global convention for protecting and promoting healthy diets: Restricting advertising, promotion and sponsorship of unhealthy food and beverage products will help to reduce consumption. 121 |
NGOs oppose self‐regulation as problematic: poor definitions of advertising, forms of marketing communications and media platforms; lack of meaningful sanctions; and not effective to address digital marketing. 34 , 122 |
| Health professionals | American Heart Association: ‘There is no ethical, political, scientific, or social justification for marketing and advertising low‐nutrient, high‐calorie foods to children’. 123 The British Medical Association supports stronger controls on advertising to children. 124 The World Obesity Federation has called for stronger action to protect children from online marketing. 125 |
Abbreviations: CFBAI, Children's Food and Beverage Advertising Initiative; HFSS, products containing high levels of fat, salt, and/or sugar; IFBA, International Food and beverage Association; NGOs, non‐governmental organizations.
4. EVIDENCE GAPS
There are large gaps in the evidence base, as can be seen from the paucity of evidence described above. Specific issues that may benefit from further research are discussed here.
4.1. Cost implications
Cost–benefit analyses focus on benefits provided by reduced health care costs (cost offsets), and the estimates for these cost offsets are usually restricted to the main non‐communicable diseases linked to diet and often only consider longer term effects on these diseases. This is the case for the OECD analysis of the benefits of restricting marketing to children. Similarly, the study by Lal et al. 22 considered nine disease outcomes likely to be affected by an SSB tax but did not include dental disease, the most common sugar‐related disease of all which starts in early childhood. Studies could be extended to include a wider range of conditions that are linked to dietary patterns and to overall quality of life measures. They could also include the wider societal costs that would be reduced if health improved, including lost work productivity and the need for social care and family support.
The ‘cost’ side of the cost–benefit equation does not normally note the value of lost food and beverage sales and their impact on industry profitability, industry employment and gross domestic product. Reductions in purchases are a saving to consumers who are potentially then free to spend this saving elsewhere. For obesity, the increased body mass of consumers seen over the last three decades has been calculated to be worth over £US60bn annually in higher sales of foods and beverages, in the United States alone. 126 It might also be argued that a reduction in population obesity prevalence might lead to lower sales of specialist food products for weight loss. Such specific lost markets may be offset by increased sales of other products in this or other markets. Furthermore, a population with lower obesity prevalence may be more economically productive, adding to employment in other sectors and raising GDP. These broader issues are beyond the scope of the present paper.
In respect of the implementation of fiscal policies such as beverage taxes, there is evidence (e.g., in the United Kingdom) that companies can rapidly reformulate and adapt their marketing strategies to meet the challenge of a levy or tax on soft drinks, but there may be transitional costs to reformulate products so that they fall into lower tax categories. For FOP labelling, effective formats would be expected to lead to reduced sales of the less healthy products, and it is not clear what may replace them. There are costs to the food industry in reformulating to improve the label profile, and in marketing and promoting the reformulated products, although for both labelling and promotional marketing, it can be noted that companies routinely revise their designs and strategies, so any transitional costs would be small. In respect of restrictions on marketing to children, potential costs may be experienced by the advertising industry and the media platforms, but robust evidence for this remains to be produced.
4.2. Equity implications
In relation to taxes on foods and beverages, fiscal modelling studies are not necessarily sensitive to socio‐economic nuances: They usually rely on estimates of price elasticities calculated from large populations, but these elasticities may be inappropriate in some subpopulation groups. Specifically, the impact of price changes should be more closely linked to household incomes and patterns and preferences of spending. For example, descriptions of Aboriginal purchasing habits in remote communities in northern Australia indicate that ‘customers will pay almost anything for something they want. Conversely if they do not want something it is impossible to give it away’. 127 One survey of Aboriginal communities found over 60% of household food budget is spent on less healthy (discretionary) foods, despite a very low level of per capita income, and interventions to increase the price of these foods through taxation would likely serve to restrict even further the amount spent on core, healthier products. 128 Further evidence on price elasticities assessed separately for specific population groups and specific contexts is needed. 55
Similarly, there are few studies of subsidies of healthier types of food as a means to improve health, in the context of social inequalities. Localized interventions may show impacts on target groups, but their sustained impact on health needs to be evaluated. National schemes to support free school meals, free fruit and vegetables for children, food vouchers for low‐income women and children or for pregnant women, are all valuable targeted schemes to improve overall nutrition, and are implemented in many countries, but their assessment lies outside the current review. There is a lack of evidence on the relative merits of subsidies versus taxes in their impact on health, especially in subpopulations.
In addition, modelling studies of taxes on unhealthy products do not appear to include an analysis of the out‐of‐pocket costs of medical care borne by individuals or households, which might be reduced by improved dietary health. In populations where insurance schemes are not universal and comprehensive, the introduction of health‐related food taxes may reduce out‐of‐pocket health care contributions, and those savings may be counted as a household benefit. The equity impact of this needs analysis.
Concerning FOP labelling, there is a lack of evidence across socio‐economic groups for the use and understanding of different formats. Acceptance and use of FOP labelling appears to be best for labels with interpretative colour coding, and this applies to less‐educated, lower income or lower numerate consumers nearly as much as other consumers. It is not known if this would also apply to children, who can be presumed to understand the colours of traffic lights where they might not understand percentage daily intake, for example. No studies were found on children's use of FOP. There is also very little information on numeracy and literacy levels in relation to the use of nutrition label information. 129
The presence of interpretative FOP labelling (e.g., with traffic light signals or other warning formats) may encourage manufacturers to reformulate their products towards a healthier profile. Lower income and lesser educated individuals tend to be less likely to use nutrition information displayed on the pack, so reformulation towards more healthful products would benefit all consumers in proportion to their consumption of the products, even if they do not read the label information. There is some evidence for this in respect of the ‘Choices’ logo used in the Netherlands. 130 It is reported that no reformulation occurred in Chile prior to the introduction in 2015 of that country's legislation requiring strong warnings on the front of less healthy foods. 131
With respect to marketing to children, there is a serious paucity of evidence on the differential impact of advertising on children across social groups. A growing body of literature using laboratory controlled trials is able to show how advertisements for foods impact on food intake, 132 but few of these studies consider the demographic differences of the participants, and if the data are collected, they are used to adjust the findings to remove any differential effect. Research funding bodies should be urged to require differential examination of potential inequities in vulnerability and response to unhealthy food promotion in future research programmes.
One large gap in the evidence available is integrated marketing, using multiple platforms including social media, brand‐ownedweb‐based media, video bloggers and others forms of media platforms for marketing messages. A recent analysis of industry papers found that, when Philip Morris Companies sold Kraft General Foods in 2007, the latter had a ‘fully integrated’ minority marketing programme that combined target marketing with racial/ethnic events promotion, racial/ethnic media outreach and corporate donations to racial/ethnic leadership groups. 133 It might be assumed that integrated marketing can contribute powerfully to a normative culture of consumption of HFSS foods among specific population groups, but there appears to be little evidence on the role of marketing on generating dietary norms, especially among population subgroups.
Children's exposure is likely to be higher, as web‐based messages may be viewed for longer periods than TV commercials, may involve children using advergaming, and children may be encouraged to reproduce and recirculate commercial messages (‘viral’ marketing and user‐generated branded messaging). These issues are currently gaining attention in policy circles, 100 , 134 , 135 but there is a serious lack of evidence in peer‐reviewed literature on the impact overall, and still less on socio‐economic disparities.
4.3. Acceptability to stakeholders
We have commented already on the lack of peer‐reviewed evidence on stakeholder acceptability for policies and the need in the present review to seek evidence from grey literature, government consultation responses and civil society statements. Some specific comments may be made concerning FOP labelling. Several countries have now introduced government‐led voluntary or statutory schemes despite some resistance from commercial interests. Further research may examine different formats to assess their acceptability and usefulness among less well‐educated purchasers and to assess whether acceptability differs across countries, cultures and cuisines. The findings will be important in supporting and defending interventions to avoid legal challenge. 136 Meanwhile, new labelling formats are developing and stakeholder positions are changing: For example, food producers' opposition to colour‐coded forms of interpretative labelling in the early 2000s appears to be giving way to support, at least in Europe, for a colour‐coded scheme like the UK traffic lights 137 or the French Nutri‐Score format. 138 This changing scene makes evaluation necessary on a continuing basis.
5. DISCUSSION
There is broad consensus among public health professionals that strong actions, including regulatory measures, are needed to advance obesity prevention policies but that implementation has been weak: Governments have lacked sufficient will to take necessary action, commercial bodies have undermined policies in order to protect their interests, and consumers have not demanded action. 139 , 140 International bodies such as the World Health Organization have urged governments to introduce obesity prevention policies, and in order to strengthen policy makers' ability to argue for such policies, a range of arguments are needed, including evidence of effectiveness and consideration of contextual issues. This review sets out to provide support for the three contextual factors: costs, equity and stakeholders acceptability, in relation to three policy interventions: SSB taxes, FOP nutrition labelling and restrictions to reduce children's exposure to food and non‐alcoholic beverage marketing.
The reviews undertaken here are at best only indicative of the material available. As we have noted, the research material is sparse and uneven across the themes and policies. For example, estimating the costs and effectiveness of interventions has largely relied on modelling methods in a limited number of countries, and these do not appear to have been validated against actual policy interventions and their sustained effects over time.
Similarly, demonstration of inequities or social disparities arising from specific policies depends on factors such as differential exposure to the initial risk and to the intended intervention, differential responses and alternative response strategies. Subgroup cross‐price elasticities may be significant in some contexts and not others and may fluctuate under external influences such as promotional advertising campaigns, social marketing campaigns and media stories. These concerns remain seriously underexplored.
Even harder to review comprehensively is the acceptability of policies to stakeholders. Collating the variety and nuance of views across a range of interested parties even in a single member state is a significant research task and has been undertaken in only a few countries (e.g., see the PorGrow 141 and Polmark 142 projects). The views and stated positions change over time and are likely to be influenced by media stories or media personalities such as Jamie Oliver, as well as by the underlying beliefs and ideological positions held, on the relative importance of social determinants of behaviour or individual responsibility and freedom of choice.
Despite these caveats, some generalizations can be made and patterns of evidence described and summarized here.
5.1. Cost implications
All three policy interventions have evidence in favour of being highly cost‐effective, indeed cost saving, when comparing estimates of the cost of implementing and maintaining an intervention against the health care savings predicted to accrue from the intervention. The health care savings are likely to be underestimates as not all health benefits are considered, nor the savings from reduced social care and increased economic productivity gained from improvements in population health. In the 2019 OECD analysis of cost‐effectiveness of policies for obesity, better food and menu labelling is anticipated to have a significant impact in the near term, whereas restrictions on marketing to children has the greatest impact long term, providing $6.6 saving for $1 invested. 5 Health‐related food taxes are not assessed in the OECD study.
5.2. Equity implications
Evidence from two countries, Hungary and Mexico, provide the most substantial evidence of the impact of food taxes on different social groups by income or education levels. Both show a favourable effect, reducing consumption and reducing expenditure on the taxed foods and beverages.
The differential effects of FOP food labelling are dependent on the format of the FOP nutritional information: Those formats requiring least literacy or numeracy have greater impact on lower educated or lower income consumers. In addition, to the extent that FOP panels drive reformulation, all consumers benefit to the degree that they replace the original with the reformulated products in their diets.
Children's exposure to marketing may have a social gradient, though this is not necessarily the case in all countries as it depends on having easy access to the available media. Restrictions to marketing will benefit children in proportion to their initial exposure. Digital marketing channels are largely unexplored in terms of children's exposure differentiated across household income, parental education or ethnic group.
5.3. Stakeholder acceptability
A number of conclusions can be drawn from the evidence described here on stakeholder views. Stakeholders with commercial interest in the sale of HFSS foods can be expected to resist any forms of interference in their market activities, be it through raised prices, FOP information or restricted marketing. Nonetheless, when statutory regulation is introduced the industry can change rapidly. In the case of the UK SSB levy, the majority of manufacturers had reformulated some or all products in the 2‐yearlead‐up to the levy's operation. AG Barr, makers of IRN‐BRU, said 99% of its product portfolio was reformulated to fall below the taxable threshold, and Lucozade Suntory Ribena reformulated all its drinks to contain less than 5 g of sugar per 100 ml, resulting in 50% cuts to the sugar content of its flagship products Ribena, Lucozade Energy and Orangina. 143 As a result of company efforts to reformulate, the predicted revenue for the UK government of £520 million in its first year of the levy's operation was revised down to £275 million.
Stakeholders in organizations representing health promotion or consumer protection generally favour increased access to information on processed food packs (especially when these are easily understood) and to the protection of children from commercial inducements to unhealthy behaviour. Increased prices of snacks or SSBs may meet public resistance and should be mitigated with subsidies for healthier products or with guarantees that the revenue raised from the taxes will be used for socially valuable purposes: in the United Kingdom this was for school sports, in Hungary, for public health services.
6. CONCLUSION
In the formation of policies by national governments, and in the development of policy guidelines for member states by the WHO, policy‐making staff consider a number of contextual factors, as we have listed in the introduction. The present paper was written to support that process.
From the literature review undertaken here we make the following summary assessments:
SSB taxes: These are likely to be highly cost‐effective, moderately favourable for health equity, moderately supported by public (depending on the use of revenues), strongly supported by health professionals and civil society groups and moderately opposed by commercial interests.
FOPNL: Likely to be highly cost‐effective, moderately favourable for health equity (especially when not purely numerical), moderately supported by public, strongly supported by health professionals and civil society groups (depending on the format) and moderately opposed by commercial interests (depending on the format).
FOP warnings: Likely to be highly cost‐effective, highly favourable for health equity, moderately supported by public, highly supported by civil society groups and health professionals and highly opposed by commercial interests.
Restriction of children's exposure to marketing: Likely to be very highly cost‐effective (shown in the longer term, with a lack of analysis for the shorter term), moderately favourable for health equity, moderately to strongly supported by the public, strongly supported by health professionals and civil society groups and moderately to strongly opposed by commercial interests (unless voluntary).
Based on these assessments, the authors believe the contextual evidence for all three policy interventions support their adoption and promotion by international, national and local authorities, as part of a portfolio of prevention measures to reduce obesity risk in the population.
FUNDING
Research was conducted as part of the STOP project (http://www.stopchildobesity.eu/). The STOP project has received funding from the European Union's Horizon 2020 research and innovation programme under Grant Agreement No. 774548. The content of this document reflects only the authors' views, and the European Commission is not liable for any use that may be made of the information it contains.
CONFLICT OF INTEREST STATEMENT
No conflict of interest was declared.
Lobstein T, Neveux M, Landon J. Costs, equity and acceptability of three policies to prevent obesity: A narrative review to support policy development. Obes Sci Pract. 2020;6:562–583. 10.1002/osp4.423
REFERENCES
- 1. NCD Risk Factor Collaboration (NCD‐RisC) . Worldwide trends in body‐mass index, underweight, overweight, and obesity from 1975 to 2016: a pooled analysis of 2416 population‐based measurement studies in 128.9 million children, adolescents, and adults. Lancet, 2017;390:2627‐2642. Predictions to 2025 available at http://www.ncdrisc.org. [DOI] [PMC free article] [PubMed] [Google Scholar]
- 2. WHO . Global action plan for the prevention and control of NCDs 2013–2020. World Health Organization, Geneva, 2013 https://www.who.int/nmh/events/ncd_action_plan/en/ [Google Scholar]
- 3. Branca F, Nikogosian H, Lobstein T (eds). ‘Actions and policies to prevent obesity’ Chapter 13 in The Challenge of Obesity in the WHO European Region and the Strategies for Response. Copenhagen: World Health Organization Regional Office for Europe, 2007. [Google Scholar]
- 4. World Obesity Federation and WHO . Taking Action on Childhood Obesity. Geneva: World Health Organization; 2018. [Google Scholar]
- 5. OECD . The Heavy Burden of Obesity: The Economics of Prevention. Paris: Organization for Economic Cooperation and Development; 10.1787/67450d67-en. [DOI] [Google Scholar]
- 6. Russell SJ, Croker H, Viner RM. The effect of screen advertising on children's dietary intake: a systematic review and meta‐analysis. Obes Rev. 2019;20:554‐568. [DOI] [PMC free article] [PubMed] [Google Scholar]
- 7. Bes‐Rastrollo M, Sayon‐Orea C, Ruiz‐Canela M, Martinez‐Gonzalez MA. Impact of sugars and sugar taxation on body weight control: a comprehensive literature review. Obesity (Silver Spring). 2016;24:1410‐1426. [DOI] [PubMed] [Google Scholar]
- 8. Volkova E, Ni MC. The influence of nutrition labeling and point‐of‐purchase information on food behaviours. Curr Obes Rep. 2015;4:19‐29. [DOI] [PubMed] [Google Scholar]
- 9. Chambers SA, Freeman R, Anderson AS, MacGillivray S. Reducing the volume, exposure and negative impacts of advertising for foods high in fat, sugar and salt to children: a systematic review of the evidence from statutory and self‐regulatory actions and educational measures. Prev Med. 2015;75:32‐43. [DOI] [PubMed] [Google Scholar]
- 10. Teng AM, Jones AC, Mizdrak A, Signal L, Genç M, Wilson N. Impact of sugar‐sweetened beverage taxes on purchases and dietary intake: systematic review and meta‐analysis. Obes Rev. 2019;20:1187‐1204. [DOI] [PMC free article] [PubMed] [Google Scholar]
- 11. First meeting of the WHO Nutrition Guidance Expert Advisory Group (NUGAG) Subgroup on Policy Actions. Geneva: World Health Organization, 2018. https://www.who.int/nutrition/events/2018-1st-NUGAG-policyactions-meeting-11to14dec/en/index1.html
- 12. WHO . Handbook for Guideline Development. 2nd edition Geneva: World Health Organization, 2014. https://apps.who.int/iris/handle/10665/145714 [Google Scholar]
- 13. Cecchini M, Sassi F, Lauer JA, Lee YY, Guajardo‐Barron V, Chisholm D. Tackling of unhealthy diets, physical inactivity, and obesity: health effects and cost‐effectiveness. Lancet. 2010;376:1775‐1784. [DOI] [PubMed] [Google Scholar]
- 14. Martos É. The Hungarian policies to reduce population sugar intake. Eur J Public Health. 2015;25:235. [Google Scholar]
- 15. Martos É. Assessment of the Impact of a Public Health Product Tax. Budapest: National Institute of Pharmacy and Nutrition; 2015. [Google Scholar]
- 16. National Institute for Health Promotion . Impact Assessment of the Hungarian Public Health Product Tax. Budapest: National Institute for Health Development; 2013. [Google Scholar]
- 17. Carter R, Moodie M, Markwick A, et al. Assessing Cost‐Effectiveness in Obesity (ACE‐Obesity): an overview of the ACE approach, economic methods and cost results. BMC Public Health. 2009;9:419 10.1186/1471-2458-9-419. [DOI] [PMC free article] [PubMed] [Google Scholar]
- 18. Sacks G, Veerman JL, Moodie M, Swinburn B. ‘Traffic‐light’ nutrition labelling and ‘junk‐food’ tax: a modelled comparison of cost‐effectiveness for obesity prevention. Int J Obes (Lond). 2011;35:1001‐1009. [DOI] [PubMed] [Google Scholar]
- 19. World Health Organization . WHO‐CHOICE. Geneva: World Health Organization, 2014. https://www.who.int/choice/cost-effectiveness/en/ [Google Scholar]
- 20. Long MW, Gortmaker SL, Ward ZJ, et al. Cost effectiveness of a sugar‐sweetened beverage excise tax in the US. Am J Prev Med. 2015;49:112‐123. [DOI] [PMC free article] [PubMed] [Google Scholar]
- 21. Gortmaker SL, Wang YC, Long MW, et al. Three interventions that reduce childhood obesity are projected to save more than they cost to implement. Health Aff. 2015;34:1932‐1939. [DOI] [PMC free article] [PubMed] [Google Scholar]
- 22. Lal A, Mantilla‐Herrera AM, Veerman L, et al. Modelled health benefits of a sugar‐sweetened beverage tax across different socioeconomic groups in Australia: a cost‐effectiveness and equity analysis. PLOS Med. 2017;14 10.1371/journal.pmed.1002326. [DOI] [PMC free article] [PubMed] [Google Scholar]
- 23. UK Soft Drinks Industry Levy Statistics . London: HM revenue and customs, 2019. https://assets.publishing.service.gov.uk/government/uploads/system/uploads/attachment_data/file/848936/2019_Oct_SDIL_Comm.pdf
- 24. Sugar tax revenue helps tackle childhood obesity. London: HM Treasury, 2018. https://www.gov.uk/government/news/sugar-tax-revenue-helps-tackle-childhood-obesity
- 25. Análisis de Los Informes Sobre La Situación Económica, Las Finanzas Públicas y La Deuda Pública Al Cuarto Trimestre de 2014. Mexico City: Centro de Estudio de las Finanzas Publicas, 2015;1‐46. http://www.cefp.gob.mx/publicaciones/documento/2015/marzo/cefp0032015.pdf [Google Scholar]
- 26. Silver LD, Ng SW, Ryan‐Ibarra S, et al. Changes in prices, sales, consumer spending, and beverage consumption one year after a tax on sugar‐sweetened beverages in Berkeley, California, US: a before‐and‐after study. PLoS Med. 2017;14:e1002283 10.1371/journal.pmed.1002283. [DOI] [PMC free article] [PubMed] [Google Scholar]
- 27. Powell LM, Wada R, Persky JJ, Chaloupka FJ. Employment impact of sugar‐sweetened beverage taxes. Am J Public Health. 2014;104:672‐677. [DOI] [PMC free article] [PubMed] [Google Scholar]
- 28. Guerrero‐López CM, Molina M, Colchero MA. Employment changes associated with the introduction of taxes on sugar‐sweetened beverages and nonessential energy‐dense food in Mexico. Prev Med (Baltim). 2017;105:S43‐S49. [DOI] [PubMed] [Google Scholar]
- 29. Peñalvo JL, Cudhea F, Micha R, et al. The potential impact of food taxes and subsidies on cardiovascular disease and diabetes burden and disparities in the United States. BMC Med. 2017;15:208 10.1186/s12916-017-0971-9. [DOI] [PMC free article] [PubMed] [Google Scholar]
- 30. Sharma A, Hauck K, Hollingsworth B, Siciliani L. The effects of taxing sugar‐sweetened beverages across different income groups. Health Econ. 2014;23:1159‐1184. [DOI] [PubMed] [Google Scholar]
- 31. Backholer K, Sarink D, Beauchamp A, et al. The impact of a tax on sugar‐sweetened beverages according to socio‐economic position: a systematic review of the evidence. Public Health Nutr. 2016;19:3070‐3084. [DOI] [PMC free article] [PubMed] [Google Scholar]
- 32. Cabrera Escobar MA, Veerman JL, Tollman SM, Bertram MY, Hofman KJ. Evidence that a tax on sugar sweetened beverages reduces the obesity rate: a meta‐analysis. BMC Public Health. 2013;13:1072 10.1186/1471-2458-13-1072. [DOI] [PMC free article] [PubMed] [Google Scholar]
- 33. Smed S, Jensen JD, Denver S. Socio‐economic characteristics and the effect of taxation as a health policy instrument. Food Policy. 2007;32:624‐639. [Google Scholar]
- 34. Ng SW, Rivera JA, Popkin BM, Colchero MA. Did high sugar‐sweetened beverage purchasers respond differently to the excise tax on sugar‐sweetened beverages in Mexico? Public Health Nutr. 2019;22:750‐756. [DOI] [PMC free article] [PubMed] [Google Scholar]
- 35. Bíró A. Did the junk food tax make the Hungarians eat healthier? Food Policy. 2015;54:107‐115. [Google Scholar]
- 36. World Health Organization Regional Office for Europe . Assessment of the impact of a public health product tax. Budapest; 2015.
- 37. Health Equity Pilot Project (HEPP) . The impact of taxes on “junk Food” in Hungary—case study. 2017. https://ec.europa.eu/health/sites/health/files/social_determinants/docs/hepp_case-studies_02_en.pdf
- 38. Taillie LS, Rivera JA, Popkin BM, Batis C. Do high vs. low purchasers respond differently to a nonessential energy‐dense food tax? Two‐year evaluation of Mexico's 8% nonessential food tax. Prev Med (Baltim). 2017;105:S37‐S42. [DOI] [PMC free article] [PubMed] [Google Scholar]
- 39. Colchero MA, Popkin BM, Rivera JA, Ng SW. Beverage purchases from stores in Mexico under the excise tax on sugar sweetened beverages: observational study. BMJ. 2016;352:h6704 10.1136/bmj.h6704. [DOI] [PMC free article] [PubMed] [Google Scholar]
- 40. Ells LJ, Roberts K, McGowan VJ, Machaira T. Sugar reduction: the evidence for action. Annexe 2: a mixed method review of behaviour changes resulting from experimental studies that examine the effect of fiscal measures targeted at high sugar food and non‐alcoholic drink. London: Public Health England, 2015. https://assets.publishing.service.gov.uk/government/uploads/system/uploads/attachment_data/file/470173/Annexe_2._Fiscal_evidence_review.pdf.
- 41.Fiscal policies for diet and the prevention of noncommunicable diseases. Geneva: World Health Organization, 2016.
- 42. Colchero MA, Rivera‐Dommarco J, Popkin BM, Ng SW. In Mexico, evidence of sustained consumer response two years after implementing a sugar‐sweetened beverage tax. Health Aff. 2017;36:564‐571. [DOI] [PMC free article] [PubMed] [Google Scholar]
- 43. Caro JC, Corvalan C, Reyes M, Silva A, Popkin B, Taillie LS. Chile's 2014 sugar‐sweetened beverage tax and changes in prices and purchases of sugar‐sweetened beverages: an observational study in an urban environment. PLoS Med. 2018;15:e1002597 10.1371/journal.pmed.1002597. [DOI] [PMC free article] [PubMed] [Google Scholar]
- 44. Nakamura R, Mirelman AJ, Cuadrado C, Silva‐Illanes N, Dunstan J, Suhrcke M. Evaluating the 2014 sugar‐sweetened beverage tax in Chile: an observational study in urban areas. PLoS Med. 2018;15:e1002596 10.1371/journal.pmed.1002596. [DOI] [PMC free article] [PubMed] [Google Scholar]
- 45. Kim KH, Kang E, Yun YH. Public support for health taxes and media regulation of harmful products in South Korea. BMC Public Health. 2019;19:665 10.1186/s12889-019-7044-2. [DOI] [PMC free article] [PubMed] [Google Scholar]
- 46. Signal LN, Watts C, Murphy C, Eyles H, Ni Mhurchu C. Appetite for health‐related food taxes: New Zealand stakeholder views. Health Promot Int. 2018;33:791‐800. [DOI] [PubMed] [Google Scholar]
- 47. Sundborn G, Thornley S, Baeglehole R, Bezzant N. Policy brief: a sugary drink tax for New Zealand and 10,000‐strong petition snubbed by Minister of Health and National Government. N Z Med J. 2017;130:114‐116. [PubMed] [Google Scholar]
- 48. Street JM, Sisnowski J, Tooher R, Farrell LC, Braunack‐Mayer AJ. Community perspectives on the use of regulation and law for obesity prevention in children: a citizens' jury. Health Policy (New York). 2017;121:566‐573. [DOI] [PubMed] [Google Scholar]
- 49. Moretto N, Kendall E, Whitty J, et al. Yes, the government should tax soft drinks: findings from a citizens' jury in Australia. Int J Environ Res Public Health. 2014;11:2456‐2471. [DOI] [PMC free article] [PubMed] [Google Scholar]
- 50. Donaldson EA, Cohen JE, Rutkow L, Villanti AC, Kanarek NF, Barry CL. Public support for a sugar‐sweetened beverage tax and pro‐tax messages in a Mid‐Atlantic US state. Public Health Nutr. 2015;18:2263‐2273. [DOI] [PMC free article] [PubMed] [Google Scholar]
- 51. Jou J, Niederdeppe J, Barry CL, Gollust SE. Strategic messaging to promote taxation of sugar‐sweetened beverages: lessons from recent political campaigns. Am J Public Health. 2014;104:847‐853. [DOI] [PMC free article] [PubMed] [Google Scholar]
- 52. Tamir O, Cohen‐Yogev T, Furman‐Assaf S, Endevelt R. Taxation of sugar sweetened beverages and unhealthy foods: a qualitative study of key opinion leaders' views. Isr J Health Policy Res. 2018;7:43 10.1186/s13584-018-0240-1. [DOI] [PMC free article] [PubMed] [Google Scholar]
- 53. Eykelenboom M, van Stralen MM, Olthof MR, et al. Political and public acceptability of a sugar‐sweetened beverages tax: a mixed‐method systematic review and meta‐analysis. Int J Behav Nutr Phys Act. 2019;16:78 10.1186/s12966-019-0843-0. [DOI] [PMC free article] [PubMed] [Google Scholar]
- 54. Bosire EN, Stacey N, Mukoma G, Tugendhaft A, Hofman K, Norris SA. Attitudes and perceptions among urban South Africans towards sugar‐sweetened beverages and taxation. Public Health Nutr. 2019;1‐10. 10.1017/S1368980019001356 [DOI] [PMC free article] [PubMed] [Google Scholar]
- 55. Wright A, Smith KE, Hellowell M. Policy lessons from health taxes: a systematic review of empirical studies. BMC Public Health. 2017;17:583 10.1186/s12889-017-4497-z. [DOI] [PMC free article] [PubMed] [Google Scholar]
- 56. Thomas‐Meyer M, Mytton O, Adams J. Public responses to proposals for a tax on sugar‐sweetened beverages: a thematic analysis of online reader comments posted on major UK news websites. PLoS One. 2017;12 10.1371/journal.pone.0186750. [DOI] [PMC free article] [PubMed] [Google Scholar]
- 57. Barry CL, Niederdeppe J, Gollust SE. Taxes on sugar‐sweetened beverages. Am J Prev Med. 2013;44:158‐163. [DOI] [PubMed] [Google Scholar]
- 58. UM Government . Soft Drinks Industry Levy. Summary of Responses. London: HM Revenue & Customs; 2016. https://assets.publishing.service.gov.uk/government/uploads/system/uploads/attachment_data/file/575828/Soft_Drinks_Industry_Levy_-_summary_of_responses.pdf. [Google Scholar]
- 59. Myers A, Fig D, Tugendhaft A, Mandle J, Myers J, Hofman K. Sugar and health in South Africa: potential challenges to leveraging policy change. Glob Public Health. 2017;12:98‐115. [DOI] [PubMed] [Google Scholar]
- 60. Bødker M, Pisinger C, Toft U, Jørgensen T. The rise and fall of the world's first fat tax. Health Policy (New York). 2015;119:737‐742. [DOI] [PubMed] [Google Scholar]
- 61. Vallgårda S, Holm L, Jensen JD. The Danish tax on saturated fat: why it did not survive. Eur J Clin Nutr. 2015;69:223‐226. [DOI] [PubMed] [Google Scholar]
- 62. Massive treaty: 10 health organisations join call for sugar tax. Rethink sugary drink. Melbourne: Australian Dental Association and 9 other organisations, 2017. http://www.rethinksugarydrink.org.au/media/health-organisations-join-call-for-sugar-tax.html
- 63. What is the soft drinks industry levy (sugar tax)?London: Jamie Oliver Campaigns, 2018. https://www.jamieoliver.com/features/soft-drinks-industry-levy/
- 64. The UK's sugar levy. London: The Food Foundation, 2017. https://foodfoundation.org.uk/wp-content/uploads/2017/07/2-Briefing-Sugar-Levy_vF.pdf
- 65. Taber DR, Dulin‐Keita A, Fallon M, et al. Society of behavioral medicine (SBM) position statement: enact taxes on sugar sweetened beverages to prevent chronic disease. Transl Behav Med. 2019;9:179‐183. [DOI] [PubMed] [Google Scholar]
- 66. Dietitians of Canada . Taxation and sugar‐sweetened beverages: position of dietitians of Canada. Can J Diet Pract Res. 2016;77:110‐110. [DOI] [PubMed] [Google Scholar]
- 67. Kelly E, Roycroft G. Food for Thought: Promoting Healthy Diets among Children and Young People. London: British Medical Association; 2015. [Google Scholar]
- 68. Barber S, Baker C, Foster D. The Soft Drinks Industry Levy. London: UK Parliament; 2017. http://researchbriefings.files.parliament.uk/documents/CBP-7876/CBP-7876.pdf [Google Scholar]
- 69. FDA . Food labeling: revision of the nutrition and supplement facts labels. Federal Register. May 27, 2016;81(103):33742–33999. [PubMed] [Google Scholar]
- 70. FDA . Food labeling: revision of the nutrition and supplement facts labels: extension of compliance dates. Federal Register. May 4, 2018;83(87):19619–19626. [Google Scholar]
- 71. Millward Brown . How has awareness, comprehension and usage of GDA labelling evolved?London: Food & Drink Federation, 2008. http://www.fdf.org.uk/publicgeneral/MillwardBrown_research_Sep08.pdf [Google Scholar]
- 72. Front of pack (FOP) nutrition labelling. London, Food Standards Agency. 2007. https://www.food.gov.uk/sites/default/files/multimedia/pdfs/board/fsa100307.pdf
- 73. Stockley R, Jordan E, Hunter A. Citizens' forums on food: front of pack (FoP) nutrition labelling prepared for: Food Standards Agency. London: Food Standards Agency, 2010. https://webarchive.nationalarchives.gov.uk/20100929125556/http://www.food.gov.uk/multimedia/pdfs/citforumfop.pdf
- 74. Department for Business, Innovation & Skills . 2011 skills for life survey. London: UK Government, 2012. https://www.gov.uk/government/publications/2011-skills-for-life-survey
- 75. Sacks G, Rayner M, Swinburn B. Impact of front‐of‐pack “traffic‐light” nutrition labelling on consumer food purchases in the UK. Health Promot Int. 2009;24:344‐352. [DOI] [PubMed] [Google Scholar]
- 76. Crosetto P, Lacroix A, Muller L, Ruffieux B. Modification des achats alimentaires en réponse à cinq logos nutritionnels. Cah Nutr Diététique. 2017;52:129‐133. [Google Scholar]
- 77. Ducrot P, Méjean C, Julia C, et al. Objective understanding of front‐of‐package nutrition labels among nutritionally at‐risk individuals. Nutrients. 2015;7:7106‐7125. [DOI] [PMC free article] [PubMed] [Google Scholar]
- 78. Méjean C, Macouillard P, Péneau S, Hercberg S, Castetbon K. Perception of front‐of‐pack labels according to social characteristics, nutritional knowledge and food purchasing habits. Public Health Nutr. 2013;16:392‐402. [DOI] [PMC free article] [PubMed] [Google Scholar]
- 79. Touraine M, quoted in English translation by Michail N. 5‐C NutriScore to be France's official nutrition label. Crawley: Food Navigator, 2017. https://www.foodnavigator.com/Article/2017/03/16/5-C-NutriScore-to-be-France-s-official-nutrition-label
- 80. Petition on European food labels seeks 1m signatures. The Connexion. 2019. https://www.connexionfrance.com/French-news/Pro-Nutri-Score-petition-on-European-food-labels-seeks-1m-signatures
- 81. Bhawra J, Reid JL, White CM, Vanderlee L, Raine K, Hammond D. Are young Canadians supportive of proposed nutrition policies and regulations? An overview of policy support and the impact of socio‐demographic factors on public opinion. Can J Public Health. 2018;109:498‐505. [DOI] [PMC free article] [PubMed] [Google Scholar]
- 82. Comans T, Moretto N, Byrnes J. Public preferences for the use of taxation and labelling policy measures to combat obesity in young children in Australia. Int J Environ Res Public Health. 2017;14:324 10.3390/ijerph14030324. [DOI] [PMC free article] [PubMed] [Google Scholar]
- 83. Evidence from UK supermarkets Sainsbury and ASDA to House of Lords Science and Technology Committee inquiry into behaviour changeLondon: UK Parliament, 2011.
- 84. Italy to fight food traffic light system (3). Rome: Redazione ANSA, 2017. http://www.ansa.it/english/news/lifestyle/food_wine/2017/03/08/italy-to-fight-food-traffic-light-system-3_d1cee032-20b8-4340-bfde-bd208b4e5658.html [Google Scholar]
- 85. Front of pack labelling. Policy position. London: Food & Drink Federation, 2017. http://www.fdf.org.uk/keyissues.aspx?issue=636
- 86. Schulz F. No colour‐codedNutri‐Score for Nestlé in Germany. Brussels: Euractiv, 2019. https://www.euractiv.com/section/agriculture-food/news/no-colour-coded-nutriscore-for-nestle-in-germany/
- 87. Rixon P. New Italian body set up to fight traffic light labelling. IEG Policy. New York: HIS Markit, 2017. https://iegpolicy.agribusinessintelligence.informa.com/PL213331/New-Italian-body-set-up-to-fight-traffic-light-labelling
- 88. Nutella threatened by EU label laws, Italians claim. The Telegraph (London) 17 June 2010. https://www.telegraph.co.uk/foodanddrink/foodanddrinknews/7836423/Nutella-threatened-by-EU-label-laws-Italians-claim.html
- 89. Comments from FoodDrinkEurope. Codex Committee on Food Labelling Forty‐fourth Session Asunción, Paraguay, 16–20 October 2017. http://www.fao.org/fao-who-codexalimentarius/sh-proxy/en/?lnk=1&url=https%253A%252F%252Fworkspace.fao.org%252Fsites%252Fcodex%252FMeetings%252FCX-714-44%252FCRDs%252Ffl44_crd18.pdf
- 90. Campbell D. All supermarkets to adopt “traffic‐light labelling” for nutrition. The Guardian (London) 24 October 2012. https://www.theguardian.com/business/2012/oct/24/supermarkets-traffic-light-labelling-nutrition
- 91. McDonald A. Market leaders Migros and Coop are against the traffic light view. New York: Kxan36 News, 2019. https://www.kxan36news.com/market-leaders-migros-and-coop-are-against-the-food-traffic-light-view
- 92. Labelling: competitiveness, consumer information and better regulation for the EU. Statement from Tesco. Brussels: European Commission Consultation, 2006. https://ec.europa.eu/food/sites/food/files/safety/docs/labelling-nutrition_better-reg_indiv-resp_153.pdf
- 93. Codex committee started negotiations on front‐of‐pack nutrition labelling. London: Consumers International. 2019. https://www.consumersinternational.org/news-resources/news/releases/codex-committee-started-negotiations-on-front-of-pack-nutrition-labelling/
- 94. Statement of common concerns of public health and consumer groups regarding the Codex Alimentarius Committee on food labelling's proposed draft guidelines on front‐of‐pack nutrition labelling. Ottawa: Codex, 13–17 May 2019 (CCFL45). London: Consumers International and 10 other NGOs, 2019. http://consumersinternational.org/media/302313/codex-fopnl-cso-statement-final.pdf
- 95. Joint response to UK consultation on front of pack nutrition labelling. London: British Heart Foundation and 28 other NGOs, 2011. https://www.cancerresearchuk.org/sites/default/files/joint_response_to_uk_fop_consultation_final.pdf
- 96. Malam S. Comprehension and use of UK nutrition signpost labelling schemes. London: MRB Social Research, 2008. https://webarchive.nationalarchives.gov.uk/20120403230459/http:/www.food.gov.uk/multimedia/pdfs/quantrationale.pdf
- 97. Lobstein T, Landon J, Lincoln P. The problems with Guideline Daily Amounts (GDAs). A review of GDAs and their use for signalling nutritional information on food and drink labels. London: National Heart Forum, 2007. https://studyres.com/doc/17781795/misconceptions‐and‐misinformation‐‐the‐problems‐with‐gdas
- 98. Thow AM, Jones A, Schneider CH, Labonté R. Global governance of front‐of‐pack nutrition labelling: a qualitative analysis. Nutrients. 2019;11:268 10.3390/nu11020268. [DOI] [PMC free article] [PubMed] [Google Scholar]
- 99. Brown V, Ananthapavan J, Veerman L, et al. The potential cost‐effectiveness and equity impacts of restricting television advertising of unhealthy food and beverages to Australian children. Nutrients. 2018;10:622 10.3390/nu10050622. [DOI] [PMC free article] [PubMed] [Google Scholar]
- 100. Lupiáñez‐Villanueva F, Gaskell G, Veltri G, et al. Study on the impact of marketing through social media, online games and mobile applications on children's behaviour. Final Report. Brussels: European Commission, 2016. https://ec.europa.eu/info/sites/info/files/online_marketing_children_final_report_en.pdf
- 101. Ells LJ, Roberts K, Mcgowan VJ, Machaira T. Sugar reduction: the evidence for action. Annexe 3: a mixed method review of behaviour changes resulting from marketing strategies targeted at high sugar food and non‐alcoholic drink. London: Public Health England, 2015. https://assets.publishing.service.gov.uk/government/uploads/system/uploads/attachment_data/file/470174/Annexe_3._Marketing_evidence_review.pdf
- 102. Adams J, Tyrrell R, Adamson AJ, White M. Socio‐economic differences in exposure to television food advertisements in the UK: a cross‐sectional study of advertisements broadcast in one television region. Public Health Nutr. 2012;15:487‐494. [DOI] [PubMed] [Google Scholar]
- 103. Harris JL, Schwartz MB, Brownell KD, et al. Evaluating fast food nutrition and marketing to youth fast food FACTS: evaluating fast food nutrition and marketing to youth. New Haven: Rudd Center for Food Policy and Obesity, 2010. http://fastfoodmarketing.org/media/FastFoodFACTS_Report_2010.pdf
- 104. Harris JL, Frazier W, Kumanyika S, Ramirez AG. Increasing disparities in unhealthy food advertising targeted to Hispanic and Black youth. Rudd Center for Food Policy & Obesity University of Connecticut, 2019. http://uconnruddcenter.org/files/Pdfs/TargetedMarketingReport2019.pdf
- 105. Zimmerman FJ, Shimoga SV. The effects of food advertising and cognitive load on food choices. BMC Public Health. 2014;14:342 10.1186/1471-2458-14-342. [DOI] [PMC free article] [PubMed] [Google Scholar]
- 106. Klepp K‐I, Wind M, de Bourdeaudhuij I, et al. Television viewing and exposure to food‐related commercials among European school children, associations with fruit and vegetable intake: a cross sectional study. Int J Behav Nutr Phys Act. 2007;4:46 10.1186/1479-5868-4-46. [DOI] [PMC free article] [PubMed] [Google Scholar]
- 107. Vereecken CA, Todd J, Roberts C, Mulvihill C, Maes L. Television viewing behaviour and associations with food habits in different countries. Public Health Nutr. 2006;9:244‐250. [DOI] [PubMed] [Google Scholar]
- 108. Donohue TR, Meyer TP, Henke LL. Black and White children: perceptions of TV commercials. J Mark. 1978;42:34‐40. [Google Scholar]
- 109. Mills SDH, Tanner LM, Adams J. Systematic literature review of the effects of food and drink advertising on food and drink‐related behaviour, attitudes and beliefs in adult populations. Obes Rev. 2013;14:303‐314. [DOI] [PubMed] [Google Scholar]
- 110. Evidence review: the impact of interventions and policies on SES differentials in obesity and diet. Health Equity Pilot Project (HEPP). Brussels: European Commission, 2017. https://ec.europa.eu/health/sites/health/files/social_determinants/docs/hepp_screport_nutrition_b1000days_en.pdf
- 111. Restricting children's exposure to junk food advertising—Obesity Health Alliance Policy Position. London: Obesity Health Alliance, 2019. (citing commissioned YouGov poll results). http://obesityhealthalliance.org.uk/wp-content/uploads/2019/02/OHA-9pm-watershed-position-Feb-2019.pdf
- 112. Tripicchio G, Heo M, Diewald L, et al. Restricting advertisements for high‐fat, high‐sugar foods during children's television programs: attitudes in a US population‐based sample. Child Obes. 2016;12:113‐118. [DOI] [PubMed] [Google Scholar]
- 113. Suggs LS, McIntyre C. European Union public opinion on policy measures to address childhood overweight and obesity. J Public Health Policy. 2011;32:91‐106. [DOI] [PubMed] [Google Scholar]
- 114. Dorfman L, Wallack L, Woodruff K. More than a message: framing public health advocacy to change corporate practices. Heal Educ Behav. 2005;32:320‐336. [DOI] [PubMed] [Google Scholar]
- 115. Théodore F, Juárez‐Ramírez C, Cahuana‐Hurtado L, Blanco I, Tolentino‐Mayo L, Bonvecchio A. Barriers and opportunities for the regulation of food and beverage advertising to children in Mexico. Salud Publica Mex. 2014;56:s123‐s129. [PubMed] [Google Scholar]
- 116. Responsible marketing. Geneva: International Food & Beverage Alliance, 2017. https://ifballiance.org/commitments/responsible-marketing-to-children
- 117. EU Pledge. Brussels: World Federation of Advertisers, 2019. https://eu-pledge.eu/
- 118. Children's Food and Beverage Advertising Initiative (CFBAI). Arlington: BBB National Programs Inc, 2019. https://bbbprograms.org/programs/CFBAI/
- 119. The challenge of childhood obesity: the advertising industry's perspective. London: The Advertising Association, 2019. https://www.adassoc.org.uk/wp-content/uploads/2019/03/Advertising-Association-report-The-challenge-of-childhood-obesity-1.pdf
- 120. Protect children from all junk food advertising, say health experts—and parents agree. London: Obesity Health Alliance, 2019. http://obesityhealthalliance.org.uk/2019/02/28/protect-children-junk-food-advertising-say-health-experts-parents-agree/
- 121. Consumers International and the World Obesity Federation . Recommendations towards a global convention to protect and promote healthy diets. London: Consumers International, 2014. https://www.consumersinternational.org/media/2211/recommendations-for-a-convention-on-healthy-diets-low-res-for-web.pdf
- 122. Recommendations for an international code on marketing of foods and non‐alcoholic beverages to children. London: IASO, Consumers International, International Obesity Taskforce, 2008. https://s3.eu-central-1.amazonaws.com/ps-wof-web-dev/site_media/uploads/ConsumersInternationalMarketingCode.pdf
- 123. Sheet Fact : Unhealthy and unregulated food advertising and marketing to children. Washington: American Heart Association, 2019. https://www.heart.org/-/media/files/about-us/policy-research/fact-sheets/healthy-schools-and-childhood-obesity/food-marketing-and-advertising-to-children-fact-sheet.pdf
- 124. BMA briefing: childhood obesity. London: British Medical Association, 2018. https://www.bma.org.uk/collective-voice/influence/uk-governments/westminster/briefings/childhood-obesity
- 125. Brinsden H, Neveux M. Digital marketing of food: considerations for European policymakers. London: World Obesity Federation, 2018. https://www.worldobesity.org/resources/policy-dossiers/pd-2
- 126. Lobstein T, Jackson‐Leach R, Moodie ML, et al. Child and adolescent obesity: part of a bigger picture. Lancet. 2015;385:2510‐2520. [DOI] [PMC free article] [PubMed] [Google Scholar]
- 127. McMillan SJ. Food and nutrition policy issues in remote Aboriginal communities: lessons from Arnhem Land. Aust J Public Health. 2010;15:281‐285. [DOI] [PubMed] [Google Scholar]
- 128. Lee A, Lewis M. Testing the price of healthy and current diets in remote aboriginal communities to improve food security: development of the Aboriginal and Torres Strait Islander healthy diets ASAP (Australian Standardised Affordability and Pricing) methods. Int J Environ Res Public Health. 2018;15:2912 10.3390/ijerph15122912. [DOI] [PMC free article] [PubMed] [Google Scholar]
- 129. Malloy‐Weir L, Cooper M. Health literacy, literacy, numeracy and nutrition label understanding and use: a scoping review of the literature. J Hum Nutr Diet. 2017;30:309‐325. [DOI] [PubMed] [Google Scholar]
- 130. Vyth EL, Steenhuis IH, Roodenburg AJ, Brug J, Seidell JC. Front‐of‐pack nutrition label stimulates healthier product development: a quantitative analysis. Int J Behav Nutr Phys Act. 2010;7:65 10.1186/1479-5868-7-65. [DOI] [PMC free article] [PubMed] [Google Scholar]
- 131. Kanter R, Reyes M, Vandevijvere S, Swinburn B, Corvalán C. Anticipatory effects of the implementation of the Chilean Law of Food Labeling and Advertising on food and beverage product reformulation. Obes Rev. 2019;20:129‐140. [DOI] [PubMed] [Google Scholar]
- 132. Boyland EJ, Nolan S, Kelly B, et al. Advertising as a cue to consume: a systematic review and meta‐analysis of the effects of acute exposure to unhealthy food and nonalcoholic beverage advertising on intake in children and adults. Am J Clin Nutr. 2016;103:519‐533. [DOI] [PubMed] [Google Scholar]
- 133. Nguyen KH, Glantz SA, Palmer CN, Schmidt LA. Transferring racial/ethnic marketing strategies from tobacco to food corporations: Philip Morris and Kraft General Foods. Am J Public Health. 2020;110:329‐336. [DOI] [PMC free article] [PubMed] [Google Scholar]
- 134. Tatlow‐Golden M, Boyland E, Jewell J, et al. Tackling food marketing to children in a digital world: trans‐disciplinary perspectives. Children's rights, evidence of impact, methodological challenges, regulatory options and policy implications for the WHO European Region. Copenhagen: World Health Organization Regional Office for Europe, 2016. [Google Scholar]
- 135. Monitoring and restricting digital marketing of unhealthy products to children and adolescents. Moscow: World Health Organization Regional Office for Europe, 2018.
- 136. Kanter R, Vanderlee L, Vandevijvere S. Front‐of‐package nutrition labelling policy: global progress and future directions. Public Health Nutr. 2018;21:1399‐1408. [DOI] [PMC free article] [PubMed] [Google Scholar]
- 137. Hercberg S, Chantal J. Front‐of‐pack labels: why are certain agro‐industrial firms resisting? The Conversation. 2017. https://theconversation.com/front-of-pack-nutrition-labels-why-are-certain-agro-industrial-firms-resisting-87975
- 138. Nestlé announces support for Nutri‐Score in Continental Europe. Vevey: Nestlé, 2019. https://www.nestle.com/asset-library/documents/media/nestle-supports-nutri-score-in-continental-europe-june-2019.pdf
- 139. Swinburn BA, Kraak VI, Allender S, et al. The global syndemic of obesity, undernutrition, and climate change: the Lancet Commission report. Lancet. 2019;393:791‐846. [DOI] [PubMed] [Google Scholar]
- 140. Lyn R, Heath E, Dubhashi J. Global implementation of obesity prevention policies: a review of progress, politics, and the path forward. Curr Obes Rep. 2019;8:504‐516. [DOI] [PubMed] [Google Scholar]
- 141. Millstone E, Lobstein T. The PorGrow project: overall cross‐national results, comparisons and implications. Obes Rev. 2007;8:29‐36. [DOI] [PubMed] [Google Scholar]
- 142. The PolMark Project : Policies on Marketing food and beverages to children. London: International Association for the Study of Obesity, 2010. https://s3.eu-central-1.amazonaws.com/ps-wof-web-dev/site_media/uploads/The_PolMark_Project_Executive_Report_FINALJuly_2010.pdf
- 143. The UK sugar tax: one year on. London: Rathbone Greenbank Investments, 2019. https://www.rathbonegreenbank.com/insight/uk-sugar-tax-one-year