

Abstract

Osteoarthritic joints contain lower-molecular-weight (MW) hyaluronan (hyaluronic acid, HA) than healthy joints. To understand the relevance of this HA size effect for joint lubrication, the friction and surface structure of cartilage-emulating surfaces with HA of different MWs were studied using a surface force balance (SFB) and atomic force microscopy (AFM). Gelatin (gel)-covered mica surfaces were coated with high-MW HA (HHA), medium-MW HA (MHA), or low-MW HA (LHA), and lipids of hydrogenated soy l-α-phosphatidylcholine (HSPC) in the form of small unilamellar vesicles, using a layer-by-layer assembly method. SFB results indicate that the gel-HHA-HSPC boundary layer provides very efficient lubrication, attributed to hydration lubrication at the phosphocholine headgroups exposed by the HA-attached lipids, with friction coefficients (COF) as low as 10–3–10–4 at contact stresses at least up to P = 120 atm. However, for the gel-MHA-HSPC and gel-LHA-HSPC surfaces, the friction, initially low, increases sharply at much lower pressures (up to 30–60 atm at most). This higher friction with the shorter chains may be due to their weaker total adhesion energy to the gelatin, where the attraction between the negatively charged HA and the weakly positively charged gelatin is attributed largely to counterion-release entropy. Thus, the complexes of LHA and MHA with the lubricating HSPC lipids are more easily removed by shear during sliding, especially at high stresses, than the HHA-HSPC complex, which is strongly adhered to gelatin. This is ultimately the reason for lower-pressure lubrication breakdown with the shorter polysaccharides. Our results provide molecular-level insight into why the decrease in HA molecular weight in osteoarthritic joints may be associated with higher friction at the articular cartilage surface, and may have relevance for treatments of osteoarthritis involving intra-articular HA injections.
1. Introduction
Healthy articular cartilage is a self-lubricating system with extremely low friction coefficients (COF), as low as 10–3 even at pressures up to 100 atm.1,2 Compared to healthy joints, osteoarthritic (OA) joints exhibit degraded articular cartilage, which may be associated with breakdown in lubrication, and reveal a decrease in the molecular weight (MW) of hyaluronic acid (HA), a polysaccharide ubiquitous in cartilage and in the surrounding synovial fluid.3−5 It is of interest therefore to examine the effect of HA MW on the lubrication of articular cartilage in synovial joints.
One method that has been used to overcome the shortage of HA in OA joints is its replenishment via intra-articular injection of high-MW HA (HHA), known as viscosupplementation.6−11 In spite of the wide application of the HHA in viscosupplementation, there is still debate on whether it is significantly better than placebo.8,10,12,13 Indeed, the precise mechanistic role of HA in maintaining the health and effective lubrication of synovial joint is still not fully understood,6,14 since HA solutions at the shear rates between cartilage surfaces in joints have viscosity close to water,15,16 while boundary layers of HA on its own cannot provide the necessary lubrication to the healthy joints under high pressure, regardless of their MW.17−20 Thus, it has been suggested that instead of working directly as a lubricant, HA is potentially interacting with other components in the cartilage to form supramolecular boundary layers, which in turn mediate the lubrication.21−26 The increasing friction in OA joints may then be correlated with the different molecular interactions of lower-molecular-weight HA with other components in the synovial joints. Single-molecule microscopy reveals that the diffusion coefficient of HA in healthy synovial fluid was on average 30% slower than expected by sample viscosity, suggesting that HA undergoes intermolecular interactions in healthy joints. However, these interactions were diminished or missing in samples from patients with osteoarthritis.27 Other studies also suggest specific interactions of HA with other synovial joint macromolecules, some—though not all—of which depend on the HA MW.18 This suggests that HAs of different MWs may interact differently with other components in synovial joints, especially the surface-active phospholipids,28−32 which are key bio-lubricants that, in the form of boundary layers, can provide both low friction (COF 10–3–10–4) and high load-bearing capacity (contact stresses ca. 100–150 atm) comparable to healthy cartilage.33−39
Other studies directly revealed the synergistic interaction of HA with l-α-phosphatidylcholine (PC) lipids in the context of boundary lubrication. Seror et al.40 demonstrated that a boundary layer consisting of surface-attached HA together with dipalmitoylphosphatidylcholine (DPPC) liposomes could provide extremely efficient lubrication (COF ca. 10–3) up to contact stresses P > 100 atm. Later, Zhu and co-workers41 extended this work to three kinds of PC lipids (hydrogenated soy l-α-phosphatidylcholine (HSPC) (C16(15%),C18(85%)), 1,2-dimyristoyl-sn-glycero-3-phosphocholine (DMPC) ((C14)2), and 1-palmitoyl-2-oleoyl-sn-glycero-3-phosphocholine (POPC) (C16, C18:1)). This work revealed that POPC and DMPC form less robust complexes with the surface-attached HA layer and provided good lubrication (COF down to 10–2– 4 × 10⁻³) only at low pressures up to 10–20 atm, while the HSPC remains as robust liposomes on the HA layer, thus reducing COF to the order of 10–3 even at pressures up to 150 atm. This implies that the lubrication closely depends on the molecular interactions of the different liposomes with the HA as well as on the integrity of the different lipid assemblies. Sorkin and co-workers39 showed that POPC and DMPC on bare mica show good lubrication when measured in their dispersion, while Zhu et al. demonstrated the poor lubrication between two opposing surfaces with POPC and DMPC on mica-HA layer in a rinsed system, i.e., no reservoir of lipids in the surrounding medium. This revealed the importance of lipid availability from a surrounding reservoir to maintain the integrity of such liquid-disordered-phase PC lipid layers, and may hint at the importance of lipids in synovial fluid acting as such a reservoir also for PC-based boundary layers on articular cartilage.
In the present study, we aimed to get deeper insights into the effect of the MW of HA on the lubrication by lipids of surfaces, which are coated by known components of the articular cartilage surface, using a surface force balance (SFB), and to reveal the underlying mechanism by analyzing the structure by atomic force microscopy (AFM). The surface is made by coating with gelatin, different-MW HA, and HSPC liposomes, using layer-by-layer assembly. Gelatin, which is the denatured form of collagen I, is spin-coated on atomically smooth mica surfaces to approximate an articular cartilage surface. Gelatin is used even though collagen II is known to be dominant in articular cartilage (especially at its surface), mainly because of its better solubility and easy access. HA of different MWs is then adsorbed on the gelatin layer, followed by HSPC in the form of single unilamellar vesicles (SUVs). We designate this surface complex, whose components (collagen, HA, and lipids) are known to be present at articular cartilage surfaces,21 a “cartilage-emulating” surface. Three kinds of HA molecules have been used: high-molecular-weight HA (HHA) corresponding to healthy synovial joints,42 medium-molecular-weight HA (MHA), and low-molecular-weight HA (LHA) corresponding to osteoarthritic joints.42,43 Results indicate that the mica-gel-HHA-HSPC surface boundary complex provides very efficient lubrication, with friction coefficients as low as 10–3–10–4 even at pressures up to P = 120 atm, while for the surface complexes with MHA or with LHA, lubrication is good only at lower pressures (up to 30–50 atm). Hydration lubrication by exposed, highly hydrated phosphocholine groups is active in all three cases; the more effective lubrication by the mica-gel-HHA-HSPC boundary complexes may be attributed to more effective binding of the HHA-HSPC SUV complexes on the gelatin-coated surface. Likewise, the failure of lubrication at higher pressures by the mica-gel-MHA-HSPC and mica-gel-LHA-HSPC surface complexes can be attributed to the weaker attachment of the shorter HAs to the gelatin, resulting in their removal—together with the lubricating PC lipids attached to them—by the sliding friction.
2. Materials and Methods
2.1. Materials
Gelatin (“gel”) from porcine skin was purchased from Sigma-Aldrich (CAS 9000–70–8). Hyaluronic acid of three different nominal molecular weights was obtained from Lifecore Biomedical LLC (Chaska, MN), together with detailed molecular-weight averages for each sample (Supporting Information, SI). For the low-molecular-weight HA (LHA), we have Mw = 3.53 × 10⁴ Da and Mw/Mn = 1.32; for the medium-molecular-weight HA, MHA, Mw = 2.40 × 10⁵ Da and Mw/Mn = 1.42; and for the high-molecular-weight HA, (HHA), Mw = 1.80 × 10⁶ Da and Mw/Mn = 1.02, all taken from the manufacturer’s data provided for these samples based on size exclusion chromatography. Hydrogenated soy l-α-phosphatidylcholine (HSPC), with acyl tail contents of approximately 15% C16:0 and 85% C18:0, MW = 762.10 g/mol, >99% purity, and main gel-to-liquid transition temperature Tm = 53 °C, was purchased from Lipoid (Ludwigshafen, Germany).
2.2. Liposome Preparation
HSPC SUVs were prepared following standard approaches.44 Briefly, multilamellar vesicles (MLVs) of HSPC were prepared by dispersing the HSPC lipids in water and bath sonicating for 15 min at 65 °C. Then, the MLVs were progressively downsized using an extruder (Northern lipid, Inc., Burnaby, BC, Canada) through polycarbonate filters with defined pore sizes starting with 400 nm (5 cycles) and 200 nm (8 cycles) and ending with 50 nm (10 cycles). The size of the SUVs prepared was measured by dynamic light scattering (DLS) using a Zetasizer Nano-ZS instrument (Malvern Instruments, Malvern, U.K.). The average diameter of HSPC SUVs is 70 ± 10 nm. Water used in all experiments, for both the liposome preparation and the subsequent measurements, was Milli-Q water of resistivity 18.2 MΩ·cm (designated pure or conductivity water).
2.3. Preparation of Cartilage-Emulating Surfaces
2.3.1. Spin Coating of Gelatin on Mica Surface (Mica-Gel Surface)
Gelatin is dissolved in conductivity water at 1.0 mg/mL. The solutions were stirred for 2 h upon heating to 50 °C. Freshly cleaved mica was first spin-coated with one drop of the gelatin solution for 30 s at 1500 rpm and rinsed by water several times before SFB experiments.
2.3.2. Adsorption of HA Molecules of Different MWs on Gel-Coated Mica
Hyaluronic acid of different MWs (LHA, MHA, and HHA) was dissolved in pure water at 0.10 mg/mL, respectively, and the solutions were stirred overnight before use. Then, the mica-gel surface is dipped in a 0.10 mg/mL HA solution. After overnight incubation, the excess HA molecules on the surfaces were rinsed in a beaker containing 200 mL of water. The obtained surfaces were abbreviated as mica-gel-LHA, mica-gel-MHA, and mica-gel-HHA corresponding to the different HA MWs.
2.3.3. Liposome-Coated Mica-Gel-HA Surfaces
The mica-gel-HA surfaces were immersed overnight in the HSPC SUVs dispersion added to the SFB bath, and the subsequent SFB experiments were carried out in the HSPC dispersions. The obtained surfaces were abbreviated as mica-gel-LHA-HSPC, mica-gel-MHA-HSPC, and mica-gel-HHA-HSPC corresponding to the different HA MWs.
2.4. Atomic Force Microscopy (AFM)
The samples were prepared by freezing the mica-gel or mica-gel-HA and mica-gel-HA-HSPC surfaces in a Petri dish precooled by liquid nitrogen to help retention and imaging of the surface microstructures.45,46 Immediately afterward, the frozen sample was lyophilized under vacuum overnight to allow complete drying. Imaging of surfaces was carried out with an atomic force microscope (MFP-3D SA, Oxford Instruments Asylum Research, Inc., Santa Barbara). Scanning in tapping mode in air was done using an Olympus-AC240TS cantilever with a spring constant of 2 N/m.
2.5. Surface ζ-Potential (SZP)
A Malvern Zetasizer Nano-ZS model ZEN 1020 instrument equipped with a commercial dip cell attachment was used to measure the SZP of these surfaces coated by gelatin, HA, or HSPC liposomes at 25 °C. Detailed descriptions about this method have been described in refs (47−49). Briefly, mica surfaces (3.5 × 5 mm2), which fit the dimensions of the surface ζ-cell sample holder, were coated with gel, HA, and HSPC SUVs following the same procedures as described in Section 2.3. After that, the prepared surfaces were attached to the sample holder by epoxy (Araldite) and were rinsed by about 5 mL of pure water prior to being placed into the measuring cell containing tracer particle solutions (a standard sterically stabilized polystyrene latex (DTS 1235) was used when studying the SZP of mica-gel-HA surfaces). Gelatin and HSPC SUV solutions were used as tracer particles when studying the surface ζ-potential of mica-gel and mica-gel-HA-HSPC surfaces, respectively. The apparent mobility of the tracer particles was measured at different displacements of 125, 250, 375, and 500 μm from the sample surface, using the slow field reversal mode. Then, the SZP is calculated by SZP = −intercept + ζtracer, where ζtracer is the ζ-potential of the tracer particle (determined at a distance far from the surface, 1000 μm in the present case) and the “intercept” on the y-axis is obtained by the linear extrapolation of the obtained mobilities for the particles at various distances. Each measurement has been repeated at least three times.
2.6. Surface Force Balance (SFB) Measurement Procedure
Normal and lateral force profiles were measured using the SFB between the two atomically smooth mica surfaces, as described in detail elsewhere.50 All experiments were carried out according to the following procedure: after mounting back-silvered mica sheets in the SFB, the air-contact positions (zero-position) of the interference fringes of equal chromatic order (FECO) were measured. Then, the SFB was replaced in the laminar hood and the lenses were transferred into clean conical flasks and taken into a clean room for the spin-coating procedures, as described in Section 2.3.1. Then the mica-gel-coated lenses were remounted in the SFB and force measurements were carried out. Following this, the lenses were taken out and incubated overnight in 0.10 mg/mL LHA, MHA, or HHA solution to enable adsorption of the HA onto the gelatin surfaces and then rinsed to remove HA excess. The mica-gel-HA surfaces were then rapidly remounted in the SFB while ensuring they remained wet throughout, and force measurements were carried out in water. After studying the mica-gelatin-HA interactions across liposome-free water, the SFB boat was refilled with 0.30 mM HSPC SUVs dispersions and incubated overnight; then, the force measurements were conducted in the HSPC SUVs dispersions. The normal forces (Fn) and shear forces (Fs), respectively, between mica-gel surfaces (without HA) in HSPC SUVs dispersion were also studied by SFB as a control experiment. The mica surface preparation and addition of water or HSPC SUVs solution to the SFB were carried out in a laminar hood to avoid contamination, while the force experiments were carried out as usual in a temperature-stabilized room (25 ± 0.2 °C). An important feature of the SFB is that the interferometric method determines the absolute value of the surface separation D (unlike scanning probe methods such as AFM) and thus enables deeper insight into the nature of the surface assemblies and how they may be changed by the interactions themselves. The mean pressure P between the compressed mica surfaces may also be evaluated as the normal force divided by the contact area, P = Fn/A. When there is a measurable flattening of the mica surfaces caused by the compression of the glue supporting the mica sheets, the contact area was calculated as A = πr2, where r is the mean radius of the circular or elliptical contact, measured from the flattening of the interference fringes. When the applied load is relatively low and the flattening is too low to measure accurately, the Hertz relation was used to evaluate the contact radius r, where r = (FnR/K)1/3, in which K is the effective elastic modulus of the mica/glue combination and has been measured separately as K = (5 ± 2) × 109 N/m2.
3. Results and Discussion
Control measurements were carried out on the interacting surfaces at every stage of their progressive coating by gelatin, HA, and liposomes, enabling a stage-by-stage examination of the interactions of each intermediate layer including mica-gel, mica-gel-HA, and finally mica-gel-HA-HSPC. Results shown are based on at least five independent experiments, with at least two for each set of conditions (including several independent contact points within each experiment).
3.1. Mica-Gelatin Surface Shows Poor Lubrication
The first stage in assembling the cartilage-emulating surface is the formation and characterization of the gelatin layer. A typical AFM height image of the lyophilized gelatin on a freshly cleaved mica test surface (Section 2.3) shown in Figure 1a indicates a layer with a root-mean-square (rms) roughness of ca. 1.7 nm.
Figure 1.
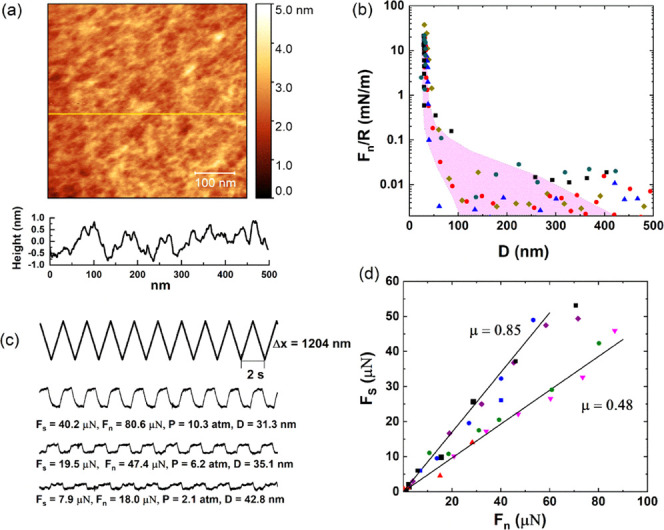
(a) Height AFM images of the mica surface spin-coated with gelatin, showing an RMS roughness of about 1.71 nm. (b) Forces normalized by radius (Fn/R) as a function of surface separation (D) between gelatin-coated mica surfaces across conductivity water at room temperature. The different symbols represent different approaches at same or different contact positions. The final separation distance between the surfaces at the highest applied loads for all profiles is 30 ± 5 nm. The purple shaded region roughly encompasses interactions larger than the scatter of ca. 0.01 mN/m. (c) Typical friction force traces between mica surfaces coated with the gelatin. The top zigzag trace is the back-and-forth lateral motion of the top surface, while the bottom three traces (at increasing loads from bottom to top) are the friction forces transmitted between the sliding surfaces at a sliding velocity of about 1.2 μm/s. (d) Friction forces (Fs) as a function of applied loads (Fn) between two gelatin-coated mica surfaces; the two fitting lines show the upper limit and the lower limit of the friction coefficient.
Following gluing of mica sheets on the lenses and their air-contact calibration in the SFB, they were similarly spin-coated with gel, and the normal and shear interactions between the two mica-gel surfaces across conductivity water were determined, as shown in Figure 1. Normalized force profiles Fn/R, where Fn is the normal force and R is the mean radius of curvature of the surfaces, were measured between two opposing gelatin-coated mica surfaces as a function of their closest separation D using the SFB. Profiles are shown in Figure 1b (normal force profiles are throughout normalized as Fn/R vs D, where R is the mean radius of curvature of the surfaces, which in the Derjaguin approximation is the surface interaction energy per unit area of flat parallel surfaces obeying the same force–distance law Fn(D)).51 The two interacting gelatin-coated surfaces come into contact at a “hard wall” separation (i.e., the limiting separation at the highest loads applied) of ca. 30 nm, indicating the thickness of the gelatin layer on each mica surface is around 15 nm. An initial weak repulsion commencing at D ≈ 150 nm may arise from double-layer electrostatic interactions52 due to the weak net positive charge on the gelatin surface; see later.
As the gelatin-bearing mica surfaces are progressively compressed, the lateral shear forces Fs between them were measured, at different loads and Fn and D values, as the top surface was sliding back and forth past the lower one. Typical friction force traces of the applied lateral motion Δx (the top zigzag trace) vs shear force (the lower traces) are shown in Figure 1c. The top triangular waveform is a set of back-and-forth lateral motion as a function of time applied on the upper lens (Δx), while the lower traces are the corresponding shear forces transmitted to the shear springs at the different compressions (mean pressures P = Fn/A, where A is the measured contact area) and separations. Sliding velocities used were around 1 μm/s for all data shown, although separate control experiments showed that the frictional force did not vary significantly, with the sliding velocity over the range of 0.1–2.2 μm/s. The plateaus in the shear force traces represent the sliding regime, from which the shear force was derived. The Fs, Fn, corresponding pressure (P), and D are shown below each shear force trace. The Fs vs Fn data are summarized in Figure 1d, and the friction coefficients μ are calculated as μ = Fs/Fn. We conclude that the shear force increases roughly linearly with the increase of normal force, with μ in the range of 0.48–0.85 at pressures up to ∼10 atm. In summary, the gelatin layer by itself cannot provide efficient lubrication.
3.2. Mica-Gel-HA Surfaces Show Similar Lubrication to the Mica-Gel Surface
Mica-gel-LHA, mica-gel-MHA, and mica-gel-HHA surfaces were imaged by AFM, as shown in Figure 2a–c. In these images, only the mica-gel-HHA surface shows clear differences to the bare gelatin surface (Figure 1a). HHA with an extended chain length of up to 6500 nm appears to form well-organized network structures, as presented in Figure 2c. The surface structure of the mica-gel-LHA surface (Figure 2a) and that of the mica-gel-MHA surface (Figure 2b) are similar to that of the mica-gel surface (Figure 1a), which makes it difficult to determine from the images whether LHA and MHA adsorbed on the gelatin surface. We attribute the more organized structure of the HHA to its much greater length compared to MHA or LHA (whose extended chain lengths are 1 or 2 orders of magnitude smaller), which makes it better able to form a network-like structure, as shown in Figure 2c. Therefore, we measures the surface ζ-potential, which measured the charge properties of the obtained surfaces. The results in Figure S1 (SI) indicate that the bare gelatin surface is slightly positively charged, while the surface ζ-potential changes to ca. −20, −40, and −55 mV when incubated overnight in LHA, MHA, and HHA respectively, indicating the adsorption of all HA samples on the gelatin surface, while suggesting a lower adsorbance, which may arise from a weaker binding of LHA and MHA relative to HHA.
Figure 2.

AFM topographic images of the (a) mica-gel-LHA, (b) mica-gel-MHA, and (c) mica-gel-HHA surfaces scanning in air, showing RMS roughnesses of around 1.63, 1.81, and 1.96 nm, respectively. (d) Forces normalized by radius (Fn/R) as a function of surface separation (D) between gelatin-coated mica surfaces following overnight incubation in HA solution across conductivity water at room temperature. The purple shaded region (from Figure 1b) indicates the Fn/R of gelatin layer. (e) Typical shear force vs time traces for the HHA layer. The top zigzag trace is the back-and-forth lateral motion of the top surface, while the lower four traces (at increasing loads from bottom to top) are the friction forces transmitted between the sliding surfaces at a sliding velocity of about 1.1 μm/s. (f) Friction forces (Fs) as a function of applied loads (Fn) between two surfaces incubated with MHA, LHA, and HHA, respectively. The purple shaded region indicates the friction force of gelatin layer (from Figure 1d).
The normal surface force profiles Fn(D)/R vs D of the mica-gel-HA surfaces in pure water are shown in Figure 2d. Comparing with the normal force profile of mica-gel surfaces (purple shaded area in Figure 2d), some of the approaching profiles between surfaces adsorbed with HA layers show a longer-ranged repulsion, especially for the mica-gel-HHA included systems. At the same time, the onset separation of the long-ranged repulsion decreases with the decrease of HA MW, which may be attributed to the decreasing steric repulsions due to the adsorbed HA molecules on the gelatin. Typical Fs(t) traces for the gel-HHA layers are shown in Figure 2e, while the shear force vs load between mica-gelatin-HA surfaces is presented in Figure 2f. For comparison, the Fs–Fn profiles of the mica-gel surfaces across pure water, taken from Figure 1d, are also presented as shown in the purple shaded area. For the mica-gel-HA surfaces, the effect of MW on the lubrication seems negligible and μ varies from 0.42–0.78 to 0.22–0.57 and 0.18–0.49 when the MW of HA decreases from 1.8 MDa to 240 kDa and 35 kDa, respectively. In brief, the COFs of the mica-gel-HA surface is in the order of 10–1–1, which are quite similar to that of the gelatin layer. This is consistent with previous studies that HA boundary layers are associated with a sliding COF of around 0.3.19,20,53
3.3. Adsorption of HSPC SUVs on the Mica-Gel and Mica-Gel-HA Surfaces May Greatly Improve Lubrication
HSPC SUVs with a diameter of around 70 ± 10 nm were prepared and incubated with the mica-gel and mica-gel-HA surfaces overnight and characterized as to structure and interactions.
3.3.1. HSPC SUVs Directly Adsorbed on Mica-Gel Surface
Following incubation of the mica-gel surface in the HSPC SUV dispersion (as a control in the absence of HA), the lyophilized mica-gel-HSPC surface was imaged in air by AFM, as shown in Figure 3a. There are some roughly circular entities seen on the gelatin surface ranging from 70 to 250 nm in diameter and 4–8 nm in height, attributed to adsorbed vesicles or aggregated vesicles (the rather small height, less than that of two bilayers, is similar to earlier AFM images of adsorbed liposomes, and is due to AFM height-measuring limitations associated with liposome distortion on the soft substrate35). The height profile in Figure 3a (bottom) shows three spheres with diameter around 70 nm and height around 7 nm, more clearly indicating liposomes adsorbed on the gelatin surface. The low density of the liposomes on the gelatin surface indicates that HSPC SUVs may adsorb on the gelatin layer to less than full coverage or that they are more densely adsorbed but only weakly attached and so partially removed by the AFM tip during scanning.41 The weak interaction between gelatin and HSPC SUVs is reasonable because the gelatin layer is overall slightly positively charged, as indicated in Figure S1, while the zwitterionic dipoles on the exposed phosphocholine groups on the liposomes favor a dipole/negative-charge interaction.34
Figure 3.
(a) Height AFM image of the mica-gelatin-HSPC surface, scanning in air. (b) Forces normalized by radius (Fn/R) as a function of surface separation (D) between mica-gelatin-HSPC surfaces across HSPC SUV dispersions at room temperature. The different symbols represent different approaches at same or different contact positions. The purple shaded region indicates the Fn/R of gelatin layer (Figure 1b). (c) Typical friction force traces between mica-gelatin-HSPC surfaces. The top zigzag trace is the back-and-forth lateral motion (Δx0) of the top surface, while the bottom four traces (at increasing loads from bottom to top) are the friction forces transmitted between the sliding surfaces at a sliding velocity around 1.0 μm/s. (d) Friction forces (Fs) as a function of applied loads (Fn) between two mica-gelatin-HSPC surfaces; different symbols represent different approaches at same or different contact positions in at least two independent SFB experiments.
The normal and shear forces between two mica-gel-HSPC surfaces were studied by SFB. The normal force between the two mica-gel-HSPC surfaces normalized by the radius (Fn/R) decays at large separations roughly exponentially, as indicated in Figure 3b. Some of the approaching profiles show a weak long-ranged repulsion, which could be due to steric repulsions between loosely bound HSPC liposomes on the gelatin surface, which are removed by the shear measurements as the surfaces approach. On closer approach, a sharp increase in the repulsive force was measured with decreasing D, which may be attributed to steric repulsions between opposing liposome layers that are more strongly bound to the gelatin surface. Some of the approaching profiles appear to show a kink from ∼75 to ∼53 nm, which may be due to the squeezing-out of the “loose” liposomes on top of the surface-attached layers. Finally, at the highest compressions, the separation between the two opposing surfaces no longer changes with the increase of normal force and reaches the final “hard wall” distance. The approaching profiles in Figure 3b indicate that the contact points between two mica-gel-HSPC surfaces can be divided into two groups according to their different final distances. The first kind of contact points reaches a final separation around 32 nm; this is consistent with the thickness of a bare gelatin layer (ca. 15 nm) on each of the surfaces and indicates an absence of HSPC SUVs on the gelatin, i.e., the shear and friction removed any liposomes that were attached. The second kind of contact points comes to a final separation of 53 ± 4 nm. This separation is consistent with the adsorption of one layer of HSPC SUVs on each gelatin surface. The majority of the contact points belong to the second kind.
The shear or frictional forces Fs transmitted between the mica-gel-HSPC surfaces as they slide past each other were determined at different compressions (Fn). Representative traces are shown in Figure 3c; quite efficient lubrication can be observed at a low pressure, and Fs increases with increasing Fn. The Fs vs Fn results are summarized in Figure 3d. Corresponding to the two kinds of contact points described in the normal force profiles, the shear force profiles in Figure 3d also show different variation with the increase of normal force. The solid symbols are data from the first kind, corresponding to a hard wall of around 32 nm (i.e., the removal of the liposomes so that the friction is essentially gelatin vs gelatin), while the open symbols are from the second kind of contact positions with a hard wall around 53 nm. As shown in Figure 3d, the first kind of contact points shows poor lubrication (μ ≈ 0.1) starting at low loads, suggesting the removal of HSPC from the gelatin layer already at such low loads and shear. The second kind (a hard wall around 53 nm) shows better lubrication, with μ ≈ (1–3) × 10–3 up to higher loads, before the lubrication breaks down abruptly and μ (as measured from the slope of the Fs vs Fn variation) increases to ca. 0.05. We may attribute the low friction to hydration lubrication at the bilayer–bilayer slip plane within the trapped liposome layer, while the abrupt increase in μ may be attributed to the removal of trapped liposomes on sufficient loading and shear. It is also noteworthy that for the second kind of contact positions, the pressure at which the lubrication breaks down may differ a lot from contact point to contact point, as shown in Figure 3d. This may be attributed to the incomplete coverage of the SUVs on the gelatin surface. For the contact positions where there is denser SUVs adsorption, they can—for a given critical-load/vesicle—withstand higher total loads, while for the contact positions with lower SUV, surface density, the friction increases sharply already at lower loads. Thus, adsorption of HSPC SUVs on the gelatin surface can improve the lubrication greatly, corresponding to a decrease in friction coefficient from ca. 10–1 to ca. 10–3 at pressures up to ca. 30 atm, whereupon, in our configuration, liposomes are removed by compression and shear and the friction increases.
3.3.2. HSPC SUVs Adsorbed on Mica-Gelatin-HA Surface
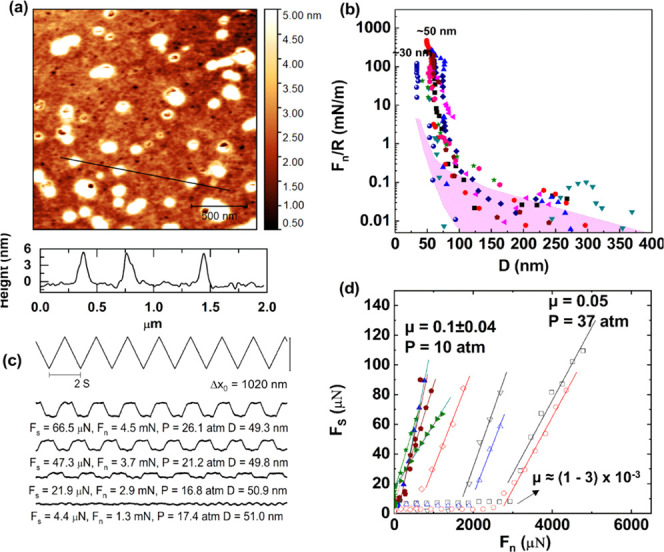
The mica-gel-HA surfaces adsorbed with different-molecular-weight HAs were further immersed in HSPC SUV dispersions overnight to obtain mica-gel-HA-HSPC surfaces. These surfaces were washed thoroughly prior to freeze drying (Section 2.4) and then imaged by AFM, as shown in Figure 4a–c. A comparison of the three AFM images indicates that the density of liposomes on the LHA layer is lower than that on the MHA and HHA ones, possibly due to their removal by the AFM tip, suggesting that the LHA shows the weakest binding to HSPC SUVs.
Figure 4.

Height AFM image (surface scanning in air) of the (a) mica-gelatin-LHA-HSPC, (b) mica-gelatin-MHA-HSPC surface, and (c) mica-gelatin-HHA-HSPC surface. Forces normalized by radius (Fn/R) as a function of surface separation (D) between (d) mica-gelatin-LHA-HSPC, (e) mica-gelatin-MHA-HSPC, and (f) mica-gelatin-HHA-HSPC surfaces across HSPC SUV dispersions at room temperature. The corresponding friction forces (Fs) at a sliding velocity around 1.0 to 1.2 μm/s are shown as a function of applied loads (Fn) between (g) mica-gelatin-LHA-HSPC, (h) mica-gelatin-MHA-HSPC, and (i) mica-gelatin-HHA-HSPC surfaces. The insets in (d) and (g) illustrate the jump-in and the corresponding abrupt increase in friction in the compression process of the mica-gelatin-LHA-HSPC surface, respectively. The purple shaded regions in (d–f) indicate the Fn/R between the gelatin layers alone (from Figure 1). The solid curves in (g–i) are a guide to the eye, and the arrows indicate the points at which further increase in the load leads to an abrupt increase in friction when the surfaces no longer slide relative to each other. The noted pressure and friction coefficients correspond to the highest load point.
Normal and shear forces between the mica-gel-HA-HSPC surfaces were then measured by SFB. In Figure 4d–f, normal force profiles Fn/R between mica-gel-HA-HSPC surfaces across an HSPC SUV dispersion (0.3 mM) are presented. There are two kinds of normal force profiles shown in Figure 4d, in which the approaching profiles were carried out with shear at different D values, for the mica-gel-LHA-HSPC surfaces: the first kind exhibits a jump-in from 51 ± 3 to 32 ± 2 nm when the pressure is around 30 atm, suggesting that two layers of liposomes are squeezed out under pressure; in other words, no liposomes layer remains on mica-gel-LHA surface under higher pressures. The second kind has no “jump-in” during the approach and shear process, with a final distance of around 50 nm, suggesting that one layer of liposomes remains on each mica-gel-LHA surface. Comparing with the mica-gel-LHA-HSPC, the normal force profiles of the mica-gel-MHA-HSPC system (Figure 4e) are more scattered. At the highest compressions, the hard wall separation between the two mica-gel-MHA-HSPC surfaces is around 52 ± 4 nm, while some of the approaching profiles show a kink from ∼72 to ∼52 nm due to the squeezing-out of the loose liposomes on top of the surface-attached layers. Figure 4f indicates the normal force profiles between two mica-gel-HHA-HSPC surfaces, and the final distance is around 54 ± 4 nm at pressures of up to 130 atm. Some of the approaching profiles also show a kink from ∼70 to 50 nm, corresponding to the squeezing-out of loosely bonded liposomes, similar to the mica-gel-MHA-HSPC system.
The corresponding friction forces Fs, derived from the shear traces at different compressions (similar to those in Figure 3c), are summarized in Figure 4g–i. The shear profiles in Figure 4g indicate that the COF of the mica-gel-LHA-HSPC surface is low, around 10–2–10–3, up to loads corresponding to some tens of atm. As shown in the inset in Figure 4g, there is a sharp increase in Fs from ∼10 to 40 μN; further compression of the surfaces leads to rigid coupling between the surfaces, i.e., no sliding between them at the highest shear force applied. Such rigid coupling corresponds to the normal force profiles shown in the inset in Figure 4d, in which a jump-in from ∼50 to ∼30 nm was observed when the HSPC SUVs were squeezed out under pressure. While the plots represented by the triangles in Figure 4g indicate a relatively moderate increase in friction with load initially, with a COF of around 10–2–10–3, and then above a critical maximal pressure (Pmax*, corresponding to the pressure values indicated at the highest load data points), the friction COF increases abruptly by at least 3–5-fold, as indicated by the arrows in Figure 4g. These contact positions correspond to the normal force profiles in Figure 4d, which undergo no final distance changes, thus indicating that there are still HSPC SUVs between the surfaces. In this case, we attribute the sharp increase in friction under the critical maximal pressure (26–36 atm for the mica-gel-LHA-HSPC surface), which is low relative to the maximal pressures measured in cartilage,2 to the removal of liposomes and the resulting low coverage of HSPS SUVs on the mice-gelatin-LHA surfaces, as already indicated by the AFM image in Figure 4a. The COF between mica-gelatin-MHA-HSPC surfaces, Figure 4h, is between 10–2 and 10–3, similar to the mica-gelatin-LHA-HSPC surface. However, the Pmax* of the MHA systems, around 45–62 atm prior to the abrupt increase in fiction (see arrows in Figure 4h), is significantly higher than the LHA ones, which can be attributed to stronger binding HSPC to the MHA layers. The HHA system, Figure 4i, shows the best lubrication, with a friction coefficient between 10–3 and 10–4 when the pressure is as high as 130 atm, with no indication of a breakdown in the lubrication up to these highest pressures applied, comparable to the healthy synovial joints at physiological pressures.21 Thus, compared to the low-molecular-weight HA system and the medium-MW HA system, the high-MW system shows much better lubrication and pressure resistance ability. This may be attributed to the robust binding of HSPC SUVs to the HHA layer, as indicated by the AFM image in Figure 4c.
The overall picture from our results is that the bare gelatin surface has the highest friction (COF 0.48–0.85), while the adsorption of HA on the gelatin layer does not improve the lubrication regardless of its MW, but further adsorbing of HSPC SUVs can greatly decrease the friction, attributed to hydration lubrication at the HSPC-HSPC slip plane, as discussed earlier. The frictional behavior for these different configurations is summarized in Table 1. The most interesting finding of this study is that lubrication by gelatin-LHA-HSPC, gelatin-MHA-HSPC, and gelatin-HHA-HSPC differs considerably from each other even though frictional energy dissipation at the HSPC-HSPC slip plane between the surfaces in the three cases should be similar. This is summarized in Table 1, which shows also that the maximal pressure P*max before the friction increases abruptly in the order: mica-gelatin-LHA-HSPC < mica-gelatin-MHA-HSPC; mica-gelatin-HHA-HSPC, from ∼30 to ∼60 atm; for the mica-gelatin-HHA-HSPC surface, the friction still remains as low as 10–3–10–4, and there is no abrupt rise in the friction up to the maximum pressure applied, ca. 130 atm. We attribute these differences to the progressively stronger attachment of the liposomes to the gelatin layer as the HA MW increases. We note also that any effects of wear for the case of the mica-gel-HHA-HSPC surfaces is not significant. This is seen from the very good lubrication at the same contact points on subsequent approaches between the mica-gel-HHA-HSPC surfaces, as well as from the approach to the same surface separation on recompression following a first approach and shear. Any significant wear would have resulted in increased friction, and in debris formation manifesting as a longer-ranged repulsion on subsequent approach, as has been seen in other studies35 but is not seen in the present study. From this, we may conclude that little wear has occurred within the parameters of our experiments. This may be attributed to the robustness of the surface layers and to the presence of HSPC SUV in the surrounding medium, which may serve as a reservoir to replace any lipids that are removed by shear.
Table 1. Summary of Sliding Friction Coefficients (COF) and the Corresponding Range of Maximal Applied Pressures of Surfaces Derived from SFB Experiments.
| coefficient of friction (COF) | maximal applied pressures (Pmax, atm) | |
|---|---|---|
| Mica-gelatin | 0.48–0.85 | ∼10 |
| Mica-gelatin-LHA | 0.18–0.49 | ∼12 |
| Mica-gelatin-MHA | 0.22–0.57 | ∼9 |
| Mica-gelatin-HHA | 0.42–0.78 | ∼12 |
| Mica-gelatin-HSPC | 10–1–10–2 | 12–37 |
| Mica-gelatin-LHA-HSPC | 10–2–10–3 | 26–36a |
| Mica-gelatin-MHA-HSPC | 10–2–10–3 | 45–62a |
| Mica-gelatin-HHA-HSPC | 10–3–10–4 | ∼120 |
| Mica-HSPC | 10–3–10–5 | ∼120 |
Indicates P*max, the pressure beyond which, on further compression, μ increased abruptly by at least 3–5-fold.
To explore this further, we consider the physical origins of the HA-gelatin attachment. As shown in the Supporting Information, the gelatin-coated mica has a slight positive ζ-potential ψgel, which we may take as the surface potential ψ0 of the gelatin, while the HA is a negatively charged polyelectrolyte. The main driving force for adsorption of polyelectrolytes to oppositely charged surfaces is generally due to the entropy increase arising from counterion release from the surface.54 From this mechanism, we may thus roughly estimate the net adsorption energy for the LHA, MHA, and HHA on the gelatin surface as follows. We evaluate the net positive surface charge density σ on the gelatin from the Grahame equation
| 1 |
where c0 is the electrolyte concentration, ε0 = 8.854 × 10⁻¹² F/m is the permittivity of free space, ε is the relative permittivity of the medium (ca. 80 for water), k is Boltzmann’s constant, T is the absolute temperature, e = 1.60 × 10⁻¹⁹ is the electron charge, and ψ0 is the surface potential.
As the SFB experiments of the mica-gel, mica-gel-LHA, mica-gel-MHA, and mica-gel-HHA systems were all conducted in purified water without adding salt, we expect c0 ≈ 3 × 10⁻⁵ M.55 Putting in values, where we take ψ0 = ψgel = 0.003 V (SI), we find σ = 1.2 × 10⁻⁶ C/m2, equivalent to a net charge (e) occupying on average an area A0 ≈ 4000 nm2. We may view each such net surface charge to be associated with a counterion, which may be released if replaced by a (similarly charged) HA monomer, and thus gain entropy (very roughly, a gain of order kT free energy per released counterion). As noted, this is likely the dominant driving force for HA adsorption. We may examine the area occupied by an HA molecule on the gel surface to see how many such counterions it might release. If we approximate this as R02, where R0 is the end-to-end dimension of the respective HA molecules,15 then we have R02(LHA) ≈ 2A0, R02(MHA) ≈ 10A0, and R02(HHA) ≈ 160A0. From this, we may deduce that an LHA molecule is likely to be in contact with just one or two opposite surface charges so that its counterion-release adsorption energy is of order kT; likewise, the MHA chains will have adsorption energies of a few kT, while the HHA molecules will be strongly adsorbed with energies of order tens of kT. For this reason, we believe that in the case of LHA and MHA, the molecules are only weakly (transiently) bound to the gel. In summary, friction between two sliding cartilage-emulating surfaces (i.e., mica coated with gelatin and HA) is low only in the presence of adsorbed HSPC SUVs, and for which the slip plane is attributed to be—in the hydration lubrication mechanism—between the hydrated phosphocholine headgroups of the opposing boundary layers. Indeed, in all cases where HSPC SUVs are attached to the surfaces, hydration lubrication is effective, at least under low pressure; this holds even for the mica-gel-HSPC system, for which the maximal contact stress, before the friction coefficient increases abruptly (see Figure 3), is around 12–37 atm. The increasing friction of the mica-gel-HSPC system at higher pressures may be caused by the removal of most of the liposomes under pressure and shear, due to their weak attachment to the gelatin. Once HA is attached to the gelatin and the liposomes are added, the friction is again low for all polysaccharide sizes, but the good lubrication breaks down at lower pressures for the lower-MW HAs. We may attribute this to the weaker attachment of the shorter polysaccharides to the gelatin. Thus, under increasing normal loads, the LHA-HSPC and MHA-HSPC complexes may be sheared off the gelatin (and thus lose their lubricating ability) at lower shear stresses upon sliding of the surfaces than in the case for the HHA-HSPC boundary layers. Our results suggest that the gel-HSPC lubrication breaks down when the PC vesicles are detached from the gelatin, while for gel-LHA-HSPC and gel-MHA-HSPC, it is the detachment of the HA (together with their attached vesicles) that results in lubrication breakdown.
4. Conclusions
The relation of osteoarthritis to the length of HA in synovial joints has been debated for many years.56 The present work suggests that decreased length of HA may significantly reduce its binding affinity to the cartilage surface and thereby the efficiency with which the polysaccharide may attach PC layers (in the form of either bilayers or vesicles). Specifically, our data show that PC vesicles attached via HA to a model (cartilage-emulating) surface are more easily removed—i.e., at lower pressures and shear stresses—when the HA mediating their attachment is of lower MW. Since the low friction of healthy cartilage has been attributed—via hydration lubrication—to PC-exposing boundary layers, where the PC layers themselves are attached via HA,21 this indication of reduction in cartilage-binding of lower-MW HA may be related to increased friction and thus increased degradation of the osteoarthritic cartilage. Clearly, our present cartilage-emulating surface is only a very rough approximation to real articular cartilage surfaces, and should be viewed as an initial step to understanding the lubrication breakdown in the osteoarthritis joints. The use in future studies of type II collagen (which is the collagen type mostly present at the articular cartilage surface57) in place of gelatin, and physiological salt concentrations (which would modulate the various HA and PC interactions) in place of conductivity water as the medium, would make the surfaces emulate more closely an articular cartilage surface, as would incorporation of lubricin into the boundary layers. Furthermore, while the detailed interactions of HA with cartilage likely differ from those with gelatin, one expects the interaction/unit length of HA to be independent of the HA length, whether interacting with cartilage or with gelatin, so that the LHA and MHA would attach more weakly overall than HHA to cartilage as well as to gelatin (though the absolute strength of the interactions differ). Our present study captures this essential point. Moreover, the future use physiological salt concentrations (which would modulate the various HA and PC interactions) is called for in place of conductivity water. Such increased salt concentration would likely weaken the electrosorption of all of the HA samples onto the oppositely charged collagen,58 but leave the relative strengths unchanged so that our conclusions regarding the breakdown of lubrication with LHA and MHA relative to HHA would remain. Evidently, at higher salt concentrations, the medium would more closely resemble the environment in synovial joints. Nonetheless, the present work strongly indicates directly for the first time that HA molecular weight may play an important role in lubrication by PC lipids at the articular cartilage surface, over the range of HA sizes present in healthy and in osteoarthritic joints. This is relevant both for understanding HA function in keeping effective lubrication in healthy cartilage and also from a practical point, as in intra-articular administration of HA (together with PC lipids) in osteoarthritis treatment.
Acknowledgments
The authors thank the Israel Science Foundation–National Science Foundation China joint program (grants ISF-NSFC 2577/17 and 21761142007), the McCutchen Foundation, and the Ministry of Science, Israel (grant no. 3–15716). This project has received funding from the European Research Council (ERC) under the European Union’s Horizon 2020 research and innovation program (grant no. 743016). This work was made possible in part through the historic generosity of the Harold Perlman family.
Supporting Information Available
The Supporting Information is available free of charge at https://pubs.acs.org/doi/10.1021/acs.biomac.0c01151.
Surface ζ-potential of the layer-by-layer assembled cartilage-emulating surfaces; calculation of the surface charge density; and manufacturer-provided molecular-weight characterization of HA samples (PDF)
The authors declare no competing financial interest.
Supplementary Material
References
- Forster H.; Fisher J. The Influence of Loading Time and Lubricant on The Friction of Articular Cartilage. Proc. Inst. Mech. Eng., Part H 1996, 210, 109–119. 10.1243/PIME_PROC_1996_210_399_02. [DOI] [PubMed] [Google Scholar]
- Hodge W.; Fijan R.; Carlson K.; Burgess R.; Harris W.; Mann R. Contact Pressures in The Human Hip Joint Measured in Vivo. Proc. Natl. Acad. Sci. U.S.A. 1986, 83, 2879–2883. 10.1073/pnas.83.9.2879. [DOI] [PMC free article] [PubMed] [Google Scholar]
- Dahl L.; Dahl I.; Engström-Laurent A.; Granath K. Concentration and Molecular Weight of Sodium Hyaluronate in Synovial Fluid From Patients with Rheumatoid Arthritis and Other Arthropathies. Ann. Rheum. Dis. 1985, 44, 817–822. 10.1136/ard.44.12.817. [DOI] [PMC free article] [PubMed] [Google Scholar]
- Takahashi T.; Tominaga K.; Takano H.; Ariyoshi W.; Habu M.; Fukuda J.; Maeda H. A Decrease in The molecular weight of hyaluronic acid in synovial fluid from patients with temporomandibular disorders. J. Oral Pathol. Med. 2004, 33, 224–229. 10.1111/j.0904-2512.2004.00024.x. [DOI] [PubMed] [Google Scholar]
- Brown M. P.; Trumble T. N.; Plaas A. H. K.; Sandy J. D.; Romano M.; Hernandez J.; Merritt K. A. Exercise and Injury Increase Chondroitin Sulfate Chain Length and Decrease Hyaluronan Chain Length in Synovial Fluid. Osteoarthritis Cartilage 2007, 15, 1318–1325. 10.1016/j.joca.2007.04.005. [DOI] [PubMed] [Google Scholar]
- Altman R.; Manjoo A.; Fierlinger A.; Niazi F.; Nicholls M. The Mechanism Of Action for Hyaluronic Acid Treatment in The Osteoarthritic Knee: A Systematic Review. BMC Musculoskeletal Disord. 2015, 16, 321 10.1186/s12891-015-0775-z. [DOI] [PMC free article] [PubMed] [Google Scholar]
- Bellamy N.; Campbell J.; Robinson V.; Gee T.; Bourne R.; Wells G. Viscosupplementation for The Treatment of Osteoarthritis of The Knee. Cochrane Database Syst. Rev. 2006, CD005321 10.1002/14651858.CD005321.pub2. [DOI] [PMC free article] [PubMed] [Google Scholar]
- Evanich J. D.; Evanich C. J.; Wright M. B.; Rydlewicz J. A. Efficacy of Intraarticular Hyaluronic Acid Injections in Knee Osteoarthritis. Clin. Orthop. Relat. Res. 2001, 390, 173–181. 10.1097/00003086-200109000-00020. [DOI] [PubMed] [Google Scholar]
- Scale D.; Wobig M.; Wolpert W. Viscosupplementation of Osteoarthritic Knees with Hylan: A Treatment Schedule Study. Curr. Ther. Res. 1994, 55, 220–232. 10.1016/S0011-393X(05)80166-3. [DOI] [Google Scholar]
- Divine J. G.; Zazulak B. T.; Hewett T. E. Viscosupplementation for Knee Osteoarthritis: A Systematic Review. Clin. Orthop. Relat. Res. 2007, 455, 113–122. 10.1097/BLO.0b013e31802f5421. [DOI] [PubMed] [Google Scholar]
- Moreland L. W. Intra-Articular Hyaluronan (Hyaluronic Acid) and Hylans for The Treatment Of Osteoarthritis: Mechanisms Of Action. Arthritis Res. Ther. 2003, 5, 54 10.1186/ar623. [DOI] [PMC free article] [PubMed] [Google Scholar]
- Kirchner M.; Marshall D. A Double-Blind Randomized Controlled Trial Comparing Alternate Forms Of High Molecular Weight Hyaluronan for The Treatment of Osteoarthritis of The Knee. Osteoarthritis Cartilage 2006, 14, 154–162. 10.1016/j.joca.2005.09.003. [DOI] [PubMed] [Google Scholar]
- Chen S.; Bomfim F.; Mukherjee T.; Wilder E.; Leyton-Mange A.; Aharon S.; Browne L.; Toth K.; Strauss E.; Samuels J. Viscosupplementation Efficacy is Similar in Single vs Multi-week Formulations But Higher in Younger Patients and Milder Radiographic Disease. Osteoarthritis Cartilage 2017, 25, S438 10.1016/j.joca.2017.02.755. [DOI] [Google Scholar]
- Sotres J.; Arnebrant T. Experimental Investigations of Biological Lubrication at The Nanoscale: The Cases of Synovial Joints and The Oral Cavity. Lubricants 2013, 1, 102–131. 10.3390/lubricants1040102. [DOI] [Google Scholar]
- Klein J. Molecular Mechanisms of Synovial Joint Lubrication. Proc. Inst. Mech. Eng., Part J 2006, 220, 691–710. 10.1243/13506501JET143. [DOI] [Google Scholar]
- Fouissac E.; Milas M.; Rinaudo M. Shear-Rate, Concentration, Molecular Weight, and Temperature Viscosity Dependences of Hyaluronate, A Wormlike Polyelectrolyte. Macromolecules 1993, 26, 6945–6951. 10.1021/ma00077a036. [DOI] [Google Scholar]
- Tadmor R.; Chen N.; Israelachvili J. Normal and Shear Forces between Mica and Model Membrane Surfaces with Adsorbed Hyaluronan. Macromolecules 2003, 36, 9519–9526. 10.1021/ma030379k. [DOI] [Google Scholar]
- Lee D. W.; Banquy X.; Das S.; Cadirov N.; Jay G.; Israelachvili J. Effects of Molecular Weight of Grafted Hyaluronic Acid on Wear Initiation. Acta Biomater. 2014, 10, 1817–1823. 10.1016/j.actbio.2014.01.013. [DOI] [PubMed] [Google Scholar]
- Kawano T.; Miura H.; Mawatari T.; Moro-Oka T.; Nakanishi Y.; Higaki H.; Iwamoto Y. Mechanical Effects Of The Intraarticular Administration Of High Molecular Weight Hyaluronic Acid Plus Phospholipid On Synovial Joint Lubrication and Prevention of Articular Cartilage Degeneration in Experimental Osteoarthritis. Arthritis Rheum. 2003, 48, 1923–1929. 10.1002/art.11172. [DOI] [PubMed] [Google Scholar]
- Mabuchi K.; Obara T.; Ikegami K.; Yamaguchi T.; Kanayama T. Molecular weight Independence of The Effect of Additive Hyaluronic Acid on The Lubricating Characteristics in Synovial Joints with Experimental Deterioration. Clin. Biomech. 1999, 14, 352–356. 10.1016/S0268-0033(98)00084-9. [DOI] [PubMed] [Google Scholar]
- Jahn S.; Seror J.; Klein J. Lubrication of Articular Cartilage. Annu. Rev. Biomed. Eng. 2016, 18, 235–258. 10.1146/annurev-bioeng-081514-123305. [DOI] [PubMed] [Google Scholar]
- Crockett R.; Grubelnik A.; Roos S.; Dora C.; Born W.; Troxler H. Biochemical Composition of The Superficial Layer of Articular Cartilage. J. Biomed. Mater. Res., Part A 2007, 82, 958–964. 10.1002/jbm.a.31248. [DOI] [PubMed] [Google Scholar]
- Das S.; Banquy X.; Zappone B.; Greene G. W.; Jay G. D.; Israelachvili J. N. Synergistic Interactions between Grafted Hyaluronic Acid and Lubricin Provide Enhanced Wear Protection and Lubrication. Biomacromolecules 2013, 14, 1669–1677. 10.1021/bm400327a. [DOI] [PubMed] [Google Scholar]
- Forsey R. W.; Fisher J.; Thompson J.; Stone M. H.; Bell C.; Ingham E. The Effect of Hyaluronic Acid and Phospholipid Based Lubricants on Friction Within A Human Cartilage Damage Model. Biomaterials 2006, 27, 4581–4590. 10.1016/j.biomaterials.2006.04.018. [DOI] [PubMed] [Google Scholar]
- Pasquali-Ronchetti I.; Quaglino D.; Mori G.; Bacchelli B.; Ghosh P. Hyaluronan–phospholipid Interactions. J. Struct. Biol. 1997, 120, 1–10. 10.1006/jsbi.1997.3908. [DOI] [PubMed] [Google Scholar]
- Wieland D. C. F.; Degen P.; Zander T.; Gayer S.; Raj A.; An J.; Dėdinaitė A.; Claesson P.; Willumeit-Römer R. Structure of DPPC–hyaluronan Interfacial Layers–effects of Molecular Weight and Ion Composition. Soft Matter 2016, 12, 729–740. 10.1039/C5SM01708D. [DOI] [PubMed] [Google Scholar]
- Kohlhof H.; Gravius S.; Kohl S.; Ahmad S. S.; Randau T.; Schmolders J.; Rommelspacher Y.; Friedrich M.; Kaminski T. P. Single Molecule Microscopy Reveals an Increased Hyaluronan Diffusion Rate in Synovial Fluid from Knees Affected by Osteoarthritis. Sci. Rep. 2016, 6, 21616 10.1038/srep21616. [DOI] [PMC free article] [PubMed] [Google Scholar]
- Liu C.; Wang M.; An J.; Thormann E.; Dėdinaitė A. Hyaluronan and Phospholipids in Boundary Lubrication. Soft Matter 2012, 8, 10241–10244. 10.1039/c2sm26615f. [DOI] [Google Scholar]
- Murakami T.; Yarimitsu S.; Nakashima K.; Sawae Y.; Sakai N. Influence of Synovia Constituents on Tribological Behaviors of Articular Cartilage. Friction 2013, 1, 150–162. 10.1007/s40544-013-0010-6. [DOI] [Google Scholar]
- Wang M.; Liu C.; Thormann E.; Dedinaite A. Hyaluronan and Phospholipid Association in Biolubrication. Biomacromolecules 2013, 14, 4198–4206. 10.1021/bm400947v. [DOI] [PubMed] [Google Scholar]
- Siódmiak J.; Bełdowski P.; Augé W. K.; Ledziński D.; Śmigiel S.; Gadomski A. Molecular Dynamic Analysis of Hyaluronic Acid and Phospholipid Interaction in Tribological Surgical Adjuvant Design for Osteoarthritis. Molecules 2017, 22, 1436 10.3390/molecules22091436. [DOI] [PMC free article] [PubMed] [Google Scholar]
- Veselack T.; Aldebert G.; Trunfio-Sfarghiu A.-M.; Schmid T. M.; Laurent M. P.; Wimmer M. A. Phospholipid Vesicles in Media for Tribological Studies against Live Cartilage. Lubricants 2018, 6, 19 10.3390/lubricants6010019. [DOI] [PMC free article] [PubMed] [Google Scholar]
- Sivan S.; Schroeder A.; Verberne G.; Merkher Y.; Diminsky D.; Priev A.; Maroudas A.; Halperin G.; Nitzan D.; Etsion I.; Barenholz Y. Liposomes Act as Effective Biolubricants for Friction Reduction in Human Synovial Joints. Langmuir 2010, 26, 1107–1116. 10.1021/la9024712. [DOI] [PubMed] [Google Scholar]
- Goldberg R.; Schroeder A.; Silbert G.; Turjeman K.; Barenholz Y.; Klein J. Boundary Lubricants with Exceptionally Low Friction Coefficients Based on 2D Close-Packed Phosphatidylcholine Liposomes. Adv. Mater. 2011, 23, 3517–3521. 10.1002/adma.201101053. [DOI] [PubMed] [Google Scholar]
- Sorkin R.; Kampf N.; Dror Y.; Shimoni E.; Klein J. Origins of Extreme Boundary Lubrication by Phosphatidylcholine Liposomes. Biomaterials 2013, 34, 5465–5475. 10.1016/j.biomaterials.2013.03.098. [DOI] [PubMed] [Google Scholar]
- Ateshian G. A.; Hung C. T. The Natural Synovial Joint: Properties of Cartilage. Proc. Inst. Mech. Eng., Part J 2006, 220, 657–670. 10.1243/13506501JET86. [DOI] [Google Scholar]
- Crockett R. Boundary Lubrication in Natural Articular Joints. Tribol. Lett. 2009, 35, 77–84. 10.1007/s11249-009-9430-x. [DOI] [Google Scholar]
- Raj A.; Wang M.; Zander T.; Wieland D. C. F.; Liu X.; An J.; Garamus V. M.; Willumeit-Römer R.; Fielden M.; Claesson P. M.; Dėdinaitė A. Lubrication synergy: Mixture of hyaluronan and dipalmitoylphosphatidylcholine (DPPC) vesicles. J. Colloid Interface Sci. 2017, 488, 225–233. 10.1016/j.jcis.2016.10.091. [DOI] [PubMed] [Google Scholar]
- Sorkin R.; Kampf N.; Zhu L.; Klein J. Hydration Lubrication and Shear-Induced Self-Healing of Lipid Bilayer Boundary Lubricants in Phosphatidylcholine Dispersions. Soft Matter 2016, 12, 2773–2784. 10.1039/C5SM02475G. [DOI] [PubMed] [Google Scholar]
- Seror J.; Zhu L.; Goldberg R.; Day A. J.; Klein J. Supramolecular Synergy in The Boundary Lubrication of Synovial Joints. Nat. Commun. 2015, 6, 6497 10.1038/ncomms7497. [DOI] [PMC free article] [PubMed] [Google Scholar]
- Zhu L.; Seror J.; Day A. J.; Kampf N.; Klein J. Ultra-low Friction Between Boundary Layers of Hyaluronan-Phosphatidylcholine Complexes. Acta Biomater. 2017, 59, 283–292. 10.1016/j.actbio.2017.06.043. [DOI] [PubMed] [Google Scholar]
- Takahashi T.; Tominaga K.; Takano H.; Ariyoshi W.; Habu M.; Fukuda J.; Maeda H. A Decrease in The Molecular Weight of Hyaluronic Acid in Synovial Fluid from Patients with Temporomandibular Disorders. J. Oral Pathol. Med. 2004, 33, 224–229. 10.1111/j.0904-2512.2004.00024.x. [DOI] [PubMed] [Google Scholar]
- Mazzucco D.; Scott R.; Spector M. Composition of Joint Fluid in Patients Undergoing Total Knee Replacement and Revision Arthroplasty: Correlation with Flow Properties. Biomaterials 2004, 25, 4433–4445. 10.1016/j.biomaterials.2003.11.023. [DOI] [PubMed] [Google Scholar]
- Lichtenberg D.; Barenholz Y. Liposomes: Preparation, Characterization, and Preservation. Methods Biochem. Anal. 1988, 33, 337–462. 10.1002/9780470110546.ch7. [DOI] [PubMed] [Google Scholar]
- Fan Y.; Wu C.; Wang M.; Wang Y.; Thomas R. K. Self-Assembled Structures of Anionic Hydrophobically Modified Polyacrylamide with Star-Shaped Trimeric and Hexameric Quaternary Ammonium Surfactants. Langmuir 2014, 30, 6660–6668. 10.1021/la501010s. [DOI] [PubMed] [Google Scholar]
- Yu D.; Wang Y.; Zhang J.; Tian M.; Han Y.; Wang Y. Effects of Calcium Ions On Solubility And Aggregation Behavior of An Anionic Sulfonate Gemini Surfactant in Aqueous Solutions. J. Colloid Interface Sci. 2012, 381, 83–88. 10.1016/j.jcis.2012.05.016. [DOI] [PubMed] [Google Scholar]
- Corbett J. C. W.; McNeil-Watson F.; Jack R. O.; Howarth M. Measuring surface zeta potential using phase analysis light scattering in a simple dip cell arrangement. Colloids Surf., A 2012, 396, 169–176. 10.1016/j.colsurfa.2011.12.065. [DOI] [Google Scholar]
- Alswieleh A. M.; Cheng N.; Canton I.; Ustbas B.; Xue X.; Ladmiral V.; Xia S.; Ducker R. E.; El Zubir O.; Cartron M. L.; Hunter C. N.; Leggett G. J.; Armes S. P. Zwitterionic Poly(amino acid methacrylate) Brushes. J. Am. Chem. Soc. 2014, 136, 9404–9413. 10.1021/ja503400r. [DOI] [PMC free article] [PubMed] [Google Scholar]
- Thomas T. E.; Aani S. A.; Oatley-Radcliffe D. L.; Williams P. M.; Hilal N. Laser Doppler Electrophoresis and Electro-Osmotic Flow Mapping: A Novel Methodology for The Determination of Membrane Surface Zeta Potential. J. Membr. Sci. 2017, 523, 524–532. 10.1016/j.memsci.2016.10.029. [DOI] [Google Scholar]
- Raviv U.; Klein J. Fluidity of Bound Hydration Layers. Science 2002, 297, 1540–1543. 10.1126/science.1074481. [DOI] [PubMed] [Google Scholar]
- Derjaguin B. Friction and adhesion. IV. The Theory of Adhesion of Small Particles. Kolloid-Z. 1934, 69, 155–164. 10.1007/BF01433225. [DOI] [Google Scholar]
- Raviv U.; Laurat P.; Klein J. Time Dependence of Forces between Mica Surfaces in Water and Its Relation to The Release of Surface Ions. J. Chem. Phys. 2002, 116, 5167–5172. 10.1063/1.1447911. [DOI] [Google Scholar]
- Yu J.; Banquy X.; Greene G. W.; Lowrey D. D.; Israelachvili J. N. The Boundary Lubrication of Chemically Grafted and Cross-Linked Hyaluronic Acid in Phosphate Buffered Saline and Lipid Solutions Measured by the Surface Forces Apparatus. Langmuir 2012, 28, 2244–2250. 10.1021/la203851w. [DOI] [PubMed] [Google Scholar]
- Shafir A.; Andelman D.; Netz R. R. Adsorption and Depletion of Polyelectrolytes from Charged Surfaces. J. Chem. Phys. 2003, 119, 2355–2362. 10.1063/1.1580798. [DOI] [Google Scholar]
- Hillier A. C.; Kim S.; Bard A. J. Measurement of Double-Layer Forces at The Electrode/Electrolyte Interface Using The Atomic Force Microscope: Potential and Anion Dependent Interactions. J. Phys. Chem. A 1996, 100, 18808–18817. 10.1021/jp961629k. [DOI] [Google Scholar]
- Ghosh P.; Guidolin D. Potential Mechanism of Action of Intra-Articular Hyaluronan Therapy in Osteoarthritis: Are The Effects Molecular Weight Dependent?. Semin. Arthritis Rheum. 2002, 32, 10–37. 10.1053/sarh.2002.33720. [DOI] [PubMed] [Google Scholar]
- Eyre D. Articular cartilage and changes in Arthritis: Collagen of articular cartilage. Arthritis Res. Ther. 2001, 4, 30 10.1186/ar380. [DOI] [Google Scholar]
- Fleer G.; Stuart M. C.; Scheutjens J. M.; Cosgrove T.; Vincent B.. Polymers at Interfaces; Springer Science & Business Media, 1993. [Google Scholar]
Associated Data
This section collects any data citations, data availability statements, or supplementary materials included in this article.