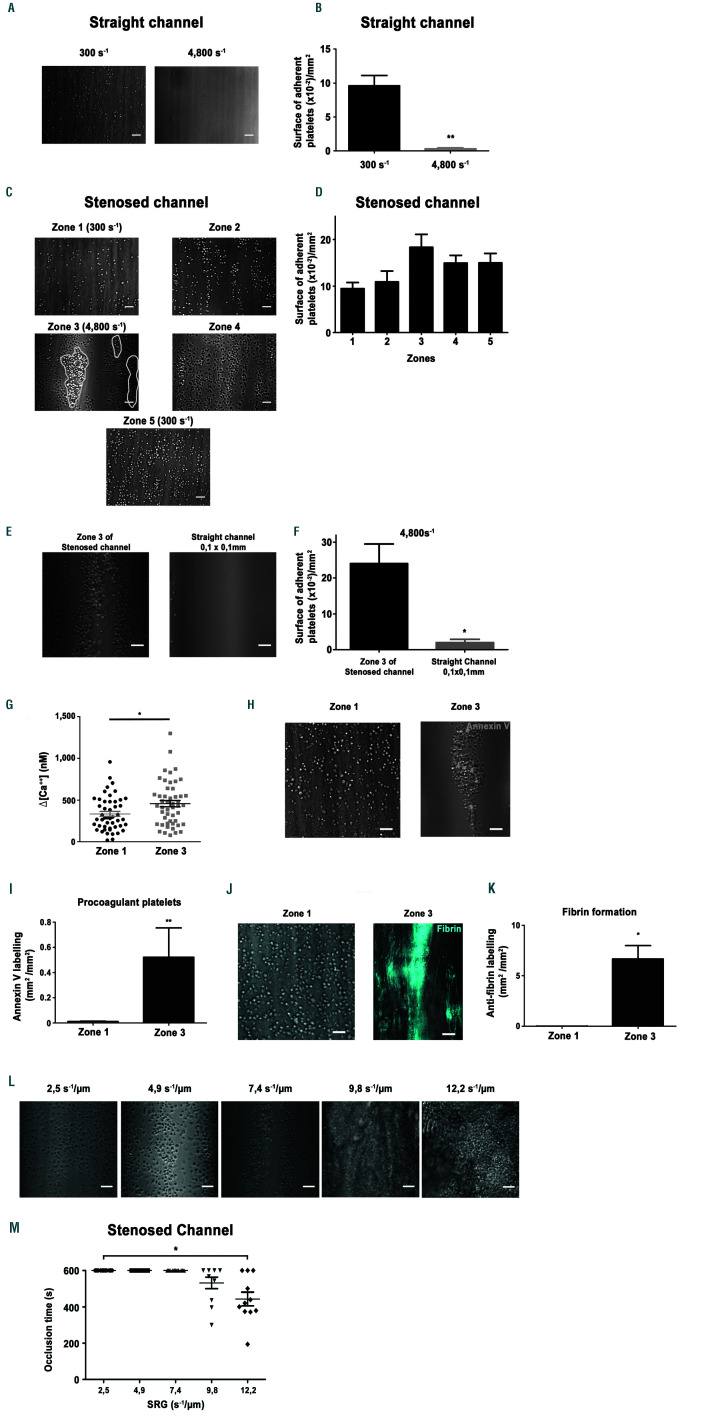
Figure 2.
Shear rate gradients promote platelet aggregation, procoagulant activity and fibrin formation on a fibrinogen surface. Hirudinated human whole blood was perfused through channels of the microfluidic chamber coated with a solution of fibrinogen (300 µg/mL). (A) Representative differential interference contrast (DIC) microscopy images of platelets adhering to immobilized fibrinogen at 300 s-1 or 4,800 s-1 after 5 min. Scale bar: 10 µm. (B) The bar graphs represent the surface of adherent platelets obtained after 5 min of perfusion. The surfaces represent the mean ± standard error of the mean (SEM) in six random fields of five separate experiments performed with different blood donors. **P<0.005. (C) Representative DIC microscopy images of platelets adhering to immobilized fibrinogen in various zones of the 90% stenosed channel, after 5 min. Scale bar: 10 µm. Theoretical wall shear rate (WSR) in rectangular regions were indicated. (D) The bar graphs represents the surface of adherent platelets in various regions obtained after 5 min of perfusion. The surfaces represent the mean ± standard error of the mean (SEM) in one random field of six separate experiments performed with different blood donors. (E) Representative DIC microscopy images of platelets adhering to immobilized fibrinogen in zone 3 of the stenosed channel or in the central region of a straight rectangular channel (0.1 mm/0.1 mm), at 4,800 s-1 after 5 min. Scale bar: 10 µm. (F) The bar graphs represent the surface of adherent platelets obtained after 5 min of perfusion. The surfaces represent the mean ±SEM in six random fields of three separate experiments performed with different blood donors. *P<0.05. (G) Washed human platelets loaded with morphological and Ca2+ dyes were reconstituted with 50% (vol/vol) autologous packed red blood cells at a final concentration of 2.5x10⁸ platelets/mL and perfused through the stenosed channel at 300 s-1 (in zone 1). Changes in fluorescence in platelets adhering in zone 1 and at the entrance of zone 3 were monitored for 5 min by confocal microscopy, and cytosolic Ca2+ concentrations were calculated. The dot plot of the maximal increase relative to the basal state in individual adherent platelets is shown (n=80 from four independent experiments). (H) Hirudinated blood was perfused over fibrinogen in the presence of Alexa 488-conjugatdd annexin-V (1/50) at 300 s-1 for 10 min. Procoagulant platelets were detected by their annexin-V positivity (greend platelets) using a epifluorescence microscopy. Representative DIC/epifluorescence images are shown. (I) The bar graph represents the surface of annexin-V labelling per mm² in zone 1 and zone 3 of six independent experiments, **P<0.01. (J) Recalcified citrated human whole blood was perfused over fibrinogen (300 µg/mL), in the presence of the specific Alexa 647-coupled anti-human fibrin antibody 59d8 (5 µg/mL). Representative DIC/fluorescence images represent fibrin formation in blue after 10 min of blood perfusion. (K) The bar graph represents the surface of fibrin formation per mm², in four independent experiments. Scale bar: 10 µm. *P<0.05. (L) Representative DIC microscopy images of platelets accumulated on immobilized fibrinogen in zone 3 at shear rate gradients (SRG) of 2.5 s-1/µm (corresponding to a wall shear rate (WSR) of 1,600 s-1), 4.9 s-1/µm (corresponding to a WSR of 3,200 s-1), 7.4 s-1/µm(corresponding to a WSR of 4,800s-1), 9.8 s-1/µm (corresponding to a WSR of 6,400 s-1) and 12.2 s-1/µm (corresponding to a WSR of 8,000 s-1) after 10 min or less. Scale bar: 10 µm. (M) The scatter plot represent the time to occlusion in the stenosed channel and limited to the 10 first min of perfusion (the value was set at 10 min if no occlusion occurred). Each dot represents the value of distinct flows performed with different blood donors, *P<0.05.

