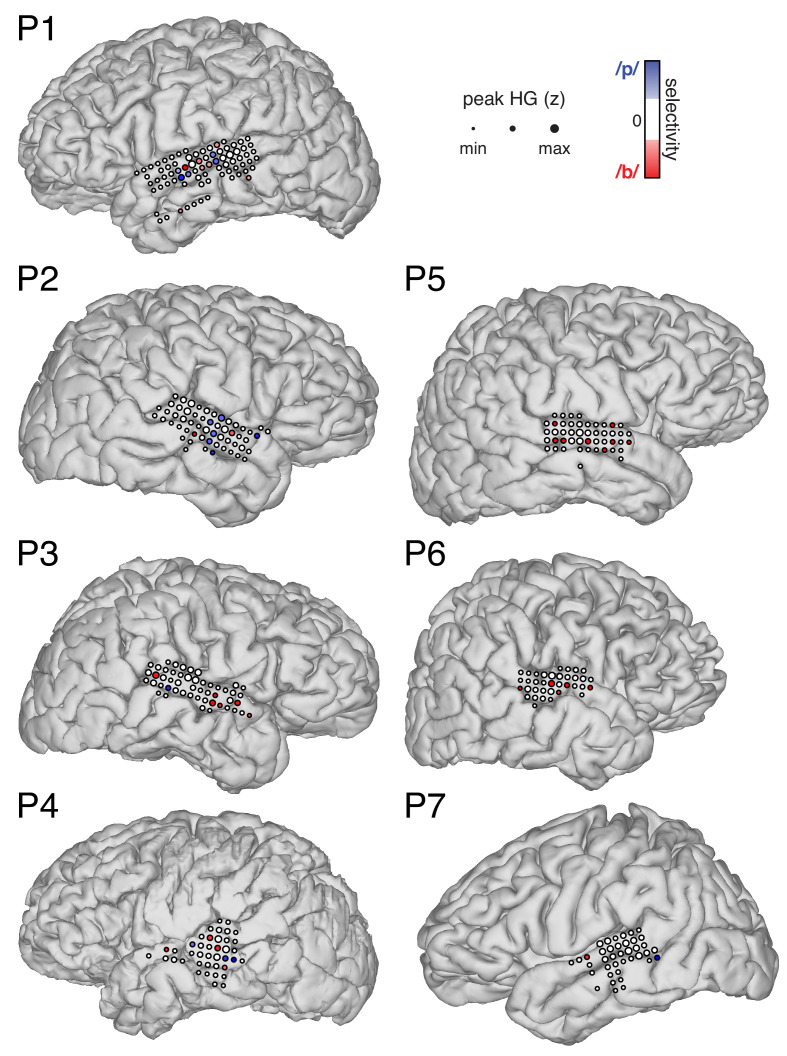
Figure 1. Speech sound categories that are distinguished by a temporal cue are spatially encoded in the peak amplitude of neural activity in distinct neural populations.
(A) Stimuli varied only in voice-onset time (VOT), the duration between the onset of the burst (top) and the onset of voicing (bottom) (a.u. = arbitrary units). (B) Acoustic waveforms of the first 100 ms of the six synthesized stimuli. (C) Behavior for one example participant (mean ± bootstrap SE). Best-fit psychometric curve (mixed effects logistic regression) yields voicing category boundary between 20–30 ms (50% crossover point). (D) Neural responses in the same representative participant show selectivity for either voiceless or voiced VOTs at different electrodes. Electrode size indicates peak high-gamma (HG; z-scored) amplitude at all speech-responsive temporal lobe sites. Electrode color reflects strength and direction of selectivity (Spearman’s ρ between peak HG amplitude and VOT) at VOT-sensitive sites (p<0.05). (E) Average HG responses (± SE) to voiced (0–20 ms VOTs; red) and voiceless (30–50 ms VOTs; blue) stimuli in two example electrodes from (D), aligned to stimulus onset (e1: voiceless-selective, V-; e2: voiced-selective, V+). Horizontal black bars indicate timepoints with category discriminability (p<0.005). Grey boxes mark average peak window (± SD) across all VOT-sensitive electrodes (n = 49). (F) Population-based classification of voicing category (/p/ vs. /b/) during peak window (150–250 ms after stimulus onset). Chance is 50%. Boxes show interquartile range across all participants; whiskers extend to best- and worst-performing participants; horizontal bars show median performance. Asterisks indicate significantly better-than-chance classification across participants (p<0.05; n.s. = not significant). Circles represent individual participants.


