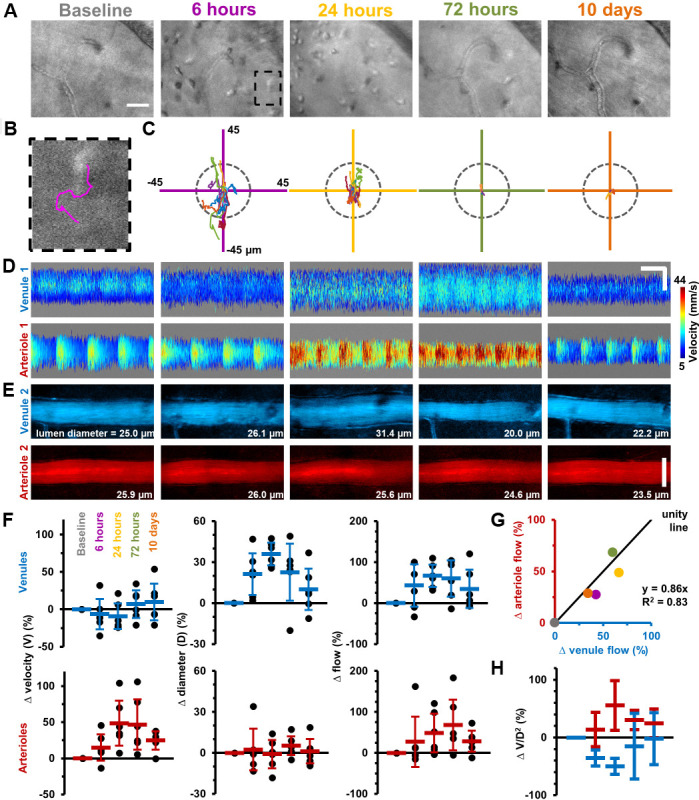
Figure 2. Longitudinal non-invasive measurement of combined immune cell dynamics and vascular flow.
Measurements of neighbouring venules, arterioles and connecting parenchyma in six C57BL/6J mice given EIU. (A) AOSLO phase-contrast images of same region across five timepoints relative to LPS injection, in a representative mouse. Scale bar = 30 µm. (B) Magnified image of one cell (marked overlay) with tracked trace (100 s). (C) Cell displacements for total cohort at indicated timepoints, in six mice. Displacement traces normalized to each cell starting position. Grey dashes indicate radius of typical cell size (13 µm). (D) Space-time images with overlaid single-cell blood velocity, in a representative mouse. Arteriolar velocity increases then resolves. Scale bars = 200 ms horizontal, 30 µm vertical. (E) Vessel diameter visualized in motion-contrast images of venules (blue) and arterioles (red), in a representative mouse. Venule diameter dilates then resolves. Scale bar = 30 µm. (F) Population values of RBC velocity change relative to baseline, lumen diameter and flow rate for venules and arterioles, in six mice. Vein diameter (p=0.008) and artery velocity (p=0.036) exhibit significant changes across time (Friedman test, n = 6 mice). Mean+ SD shown. (G) Correlation of change in flow between arterioles and venules (colors correspond to timepoints in A), in six mice. (H) Change in ratio V/D2, plotted across timepoints from F (V = velocity, D = diameter), in six mice (mean ±1 SD). Flow-rate is proportional to the product V*D2. Since V and D were independently measured, and since change in flow in arterioles and venules was found to be conserved in G, plotting the ratio of the two shows the relative contributions of each independent variable to the change in flow, in arterioles and venules. This in effect shows the functionally opposing behaviours of the two vessel types in response to inflammation.


