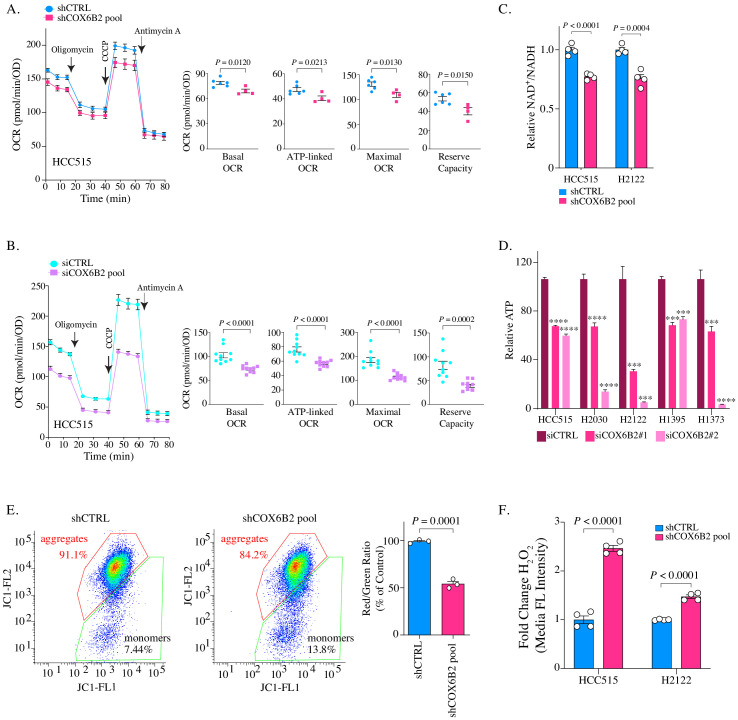
Figure 5. Depletion of COX6B2 impairs mitochondrial function.
(A–B) Left: Oxygen consumption rate (OCR) as a function of time in COX6B2 depleted HCC515 cells using an shRNA pool (A) or an siRNA pool (B) following exposure to electron transport chain complex inhibitors. Bars represent mean ± SEM (n ≥ 4). Right: Bars represent mean ± SEM 20 min following the addition of each drug (on left). p-Values calculated by Student’s t-test. (C) Relative NAD+/NADH measurement in indicated cell lines. Bars represent mean + SEM (n = 4). p-Value calculated by Student’s t-test. (D) Relative ATP content in indicated cell lines transfected with indicated individual siRNAs for 96 hr. Bars represent mean + SEM (n = 6), ****p<0.0001; ***p<0.005 calculated by Student’s t-test. (E) Left panels: Flow cytometry measurement following JC-1 labelling of indicated HCC515 cells. Right graph: Bars represent mean of the aggregate to monomer ratio (red/green) in indicated cell lines + SEM (n = 3). p-Value calculated by Student’s t-test. (F) Indicated cell lines were labelled with CM-H2DCFDA to measure H2O2 as described in Material and methods. Bars represent mean fold change in median fluorescent intensities ± SEM (n = 4). p-Value calculated by Student’s t-test.


