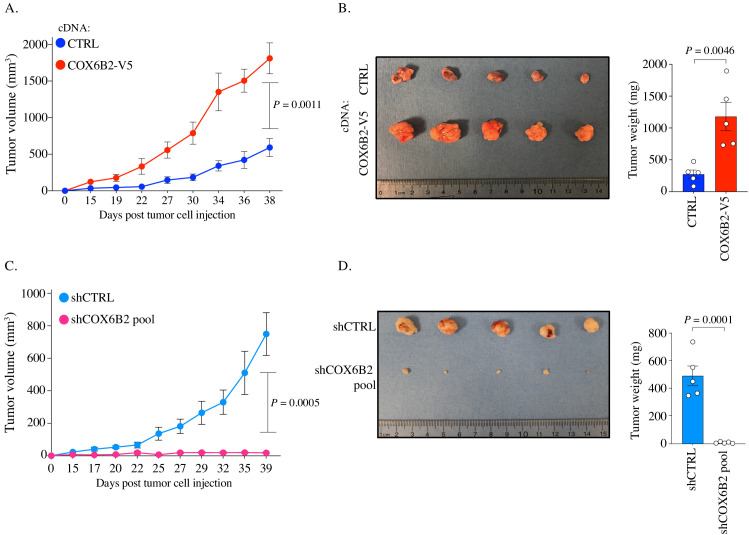
Figure 7. COX6B2 supports tumor growth in vivo.
(A and C) Xenograft experiments in indicated cell lines. Tumor volumes were measured using calipers on indicated days. Each data point represents mean ± SEM (n = 5). p-Value calculated by Student’s t-test. (B and D) Left: Images of individual tumors (ruler indicates cm). Right: Mass of excised tumors from indicated cell lines. Bars represent mean ± SEM (n = 5). p-Value calculated by Student’s t-test.

