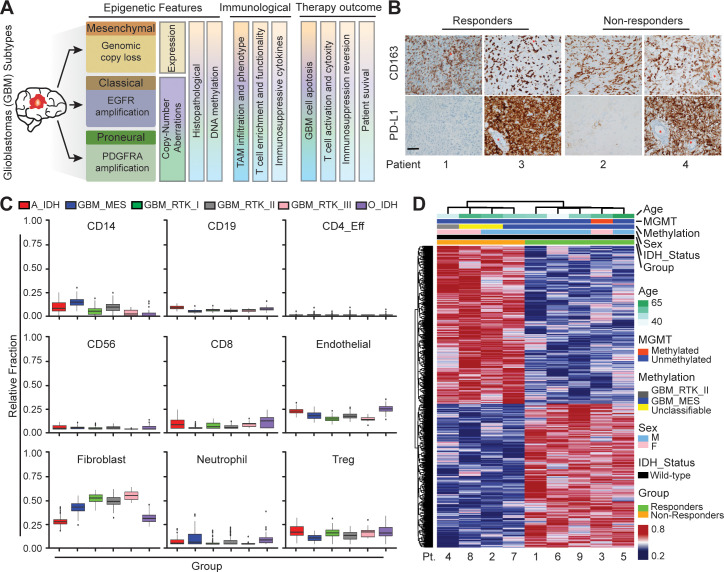
Figure 1. Distinct systemic immunosuppression in clinical GBM patients.
(A) A schematic illustrating the stratification of genetic, molecular and cellular characteristics in distinct GBM subtypes. (B) Immunohistochemical analysis of PD-L1 expression on GBM tumors and CD163+ expression on TAM infiltrate. Varied PD-L1 and CD163 expressions with high or no expression in both responding and non-responding GBM patients with administration of a PD-1 inhibitor (nivolumab). Red stars denote brain microvessel. Scale bar is 100 µm. (C) MethylCIBERSORT deconvolution of whole genome DNA methylation data from 435 glioma patients (Capper et al., 2018) sorted into six main molecular diffuse glioma subtypes (IDH mutated astrocytoma and oligodendroglioma A_IDH and O_IDH; GBM subtypes Mesenchymal: MES, Proneural: RTK_I, and Classical: RTK_II and RTK_III) shows variability in immune cell subpopulations across GBM subtypes. p-Values for Kruskal-Wallis test are as follows for CD14 (p<2.2−16), CD19 (p<2.2−16), CD4_Eff (p=5.9−4), CD56 (p=1.2−3), CD8 (p<6.9−14), Endothelial (p<2.2−16), Fibroblast (p<2.2−16), Neutrophil (p=2.1−11), and Regulatory T-cells (Treg) (p=2−15). CD14 and CD8 were used to identify the monocytic/macrophage and effector T-cell fractions. (D) Clinicopathological information and whole genome DNA methylation showing top 10,000 differentially methylated probes of GBM patients treated with PD-1 inhibitor (nivolumab). Clustering is represented for Responders and non-Responders, irrespective of molecular subtype or other clinicopathological variables (N = 9).
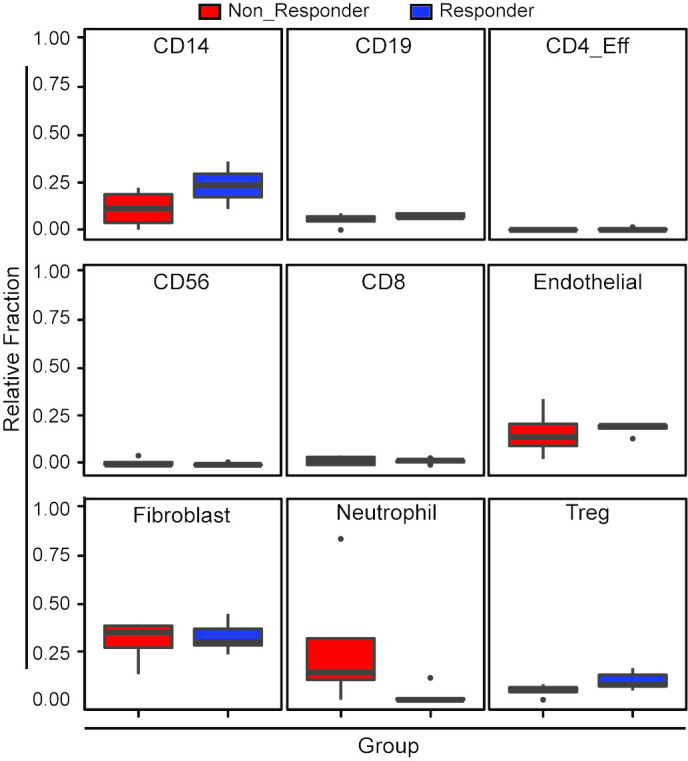
Figure 1—figure supplement 1. Variability in immune cell subpopulations in both responding and non-responding GBM patients with administration of a PD-1 inhibitor (nivolumab).


