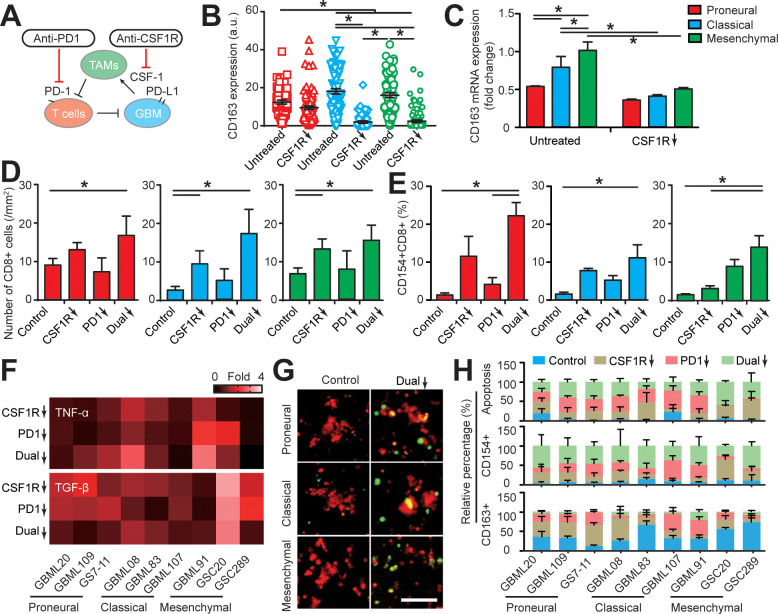
Figure 5. Targeting TAM with anti-CSF-1R blockade improves anti-PD-1 immunotherapy response in GBM-on-a-Chip.
(A) A schematic outlining a dual inhibition therapeutic strategy for targeting both PD-1/PD-L1 and TAM CSF/CSF-1R signaling to inhibit the systemic immunosuppression among GBM, TAM and CD8+ T-cell. (B) Quantified M2-like marker CD163 expression on TAM in response to CSF-1R inhibitor BLZ945 in different GBM subtypes (GBML20, GBML08, and GBML91), showing the limited expression of CD163 in all GBM subtypes. (C) qPCR experiment confirming the inhibition of CD163 expression in TAM with the administration of CSF-1R inhibitor BLZ945. (D) Quantified results showing more infiltrated allogeneic CD8+ T-cells in all GBM subtypes (GBML20, GBML08, and GBML91) with PD-1 and CSF-1R dual inhibition therapy as compared to Nivolumab and BLZ945 monotherapy. (E) Quantified results showing an increased influx of activated CD154+CD8+ T-cells in PD-1 and CSF-1R dual inhibition therapy as compared to Nivolumab monotherapy. (F) Quantified cytokine levels showing significantly increased expression of pro-inflammatory cytokine (TNF-α) and decreased expression of immunosuppressive cytokine (TGF-β1) in most GBM subtypes with dual inhibition therapy. Fold changes were calculated relative to control. Note the patient-specific responses with different pharmacological treatment. (G) Representative apoptosis images showing more apoptotic (green nuclei) GBM cells with co-blockade of PD-1 and CSF-1R relative to control in all GBM subtypes (GBML20, GBML08, and GBML91). Live GBM cells were stained with CellTracker Red (red color). (H) A therapeutic response summary of the heterogeneous and systemic immunosuppression in nine lines of GBM patients’ derived cells using GBM-on-a-Chip for relative percentages of GBM cell apotosis, CD154+CD8+ (%) and CD163+CD68+ (%) cell populations. 100% stacked bar chart was used to show the relative difference among distinct drug treatments. CSF-1R inhibitor BLZ945 (0.1 μg/ml) and PD-1 blockade nivolumab (1 μg/ml) were used in all the monotherapy or dual inhibition treatments. All control groups were treated with fresh cell culture media supplemented with DMSO (0.01%) and human IgG4 isotype control antibody (1 µg/mL, BioLegend). Error bars represent ± s.e.m. from three independent experiments. n > 80 in (B), (D), (E), and (H). P-values were calculated using the Student’s paired sample t-test or one-way ANOVA. *, p<0.05.
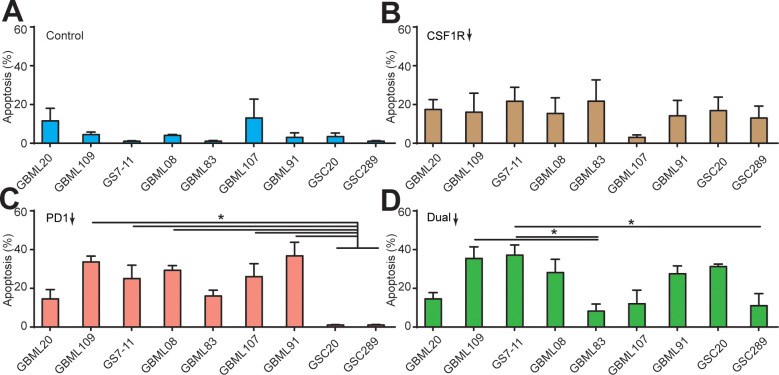
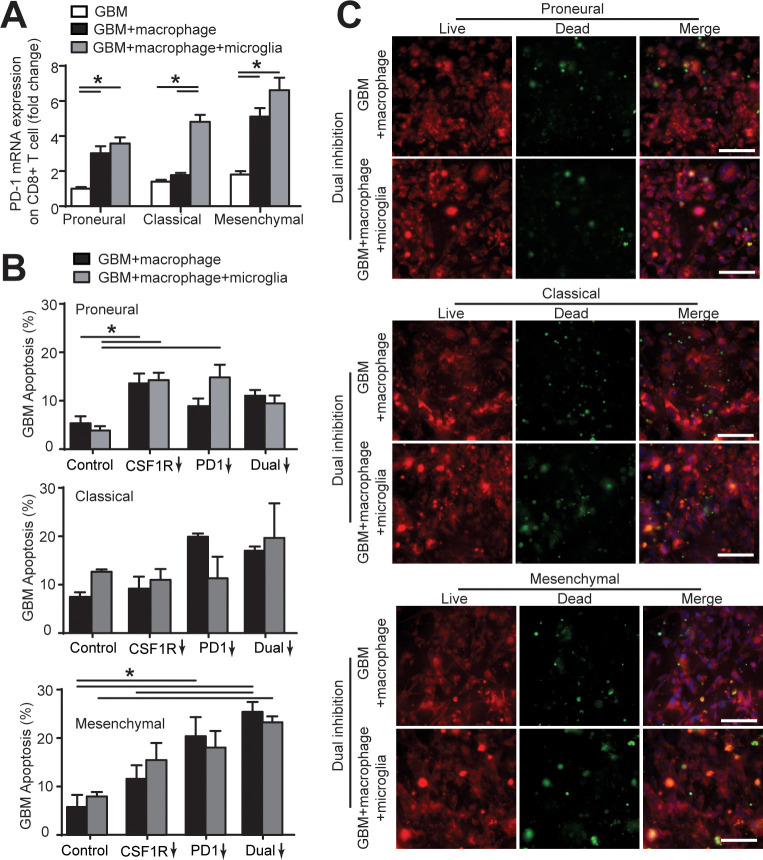
Figure 5—figure supplement 1. qPCR analysis showing different immunosuppression in TAM and GBM cell.
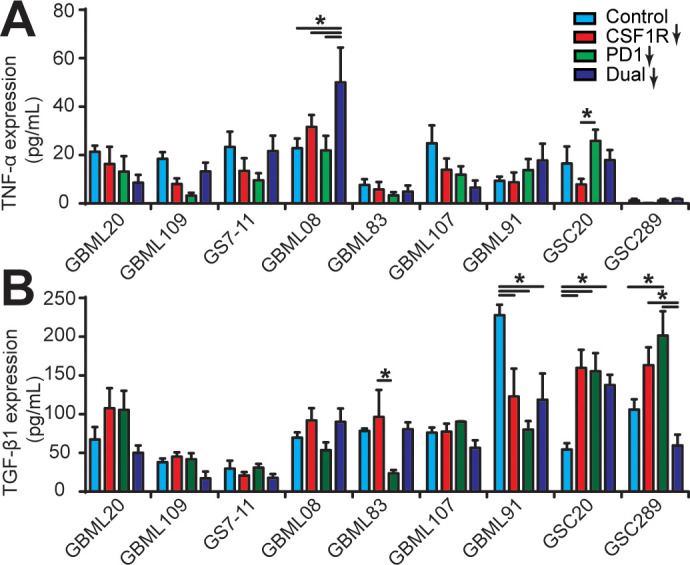
Figure 5—figure supplement 2. Cytokine conditions in different patient-derived GBM cell constructed microenvironments.


