First Paragraph
Type 1 diabetes (T1D), an autoimmune disease which destroys the pancreatic islets resulting in insulin deficiency, often begins early in life when islet autoantibody appearance signals high risk1. However, clinical diabetes can follow in weeks or only after decades, and is very difficult to predict. Ketoacidosis at onset remains common2,3 and is most severe in the very young4,5 where it can be life-threatening and difficult to treat6–9. Autoantibody surveillance programs effectively prevent most ketoacidosis10–12 but require frequent evaluations whose expense limits public health adoption13. Prevention therapies applied before onset when greater islet mass remains, have rarely been feasible14 because individuals at greatest risk of impending T1D are difficult to identify. To remedy this, we sought accurate, cost-effective estimation of future T1D risk by developing a Combined Risk Score (CRS) incorporating both fixed and variable factors (genetic, clinical and immunological) in 7,798 high-risk children followed closely from birth for 9.3 years. Compared to autoantibodies alone, the combined model dramatically improves T1D prediction at ages ≥2 over horizons up to 8 years (ROC-AUC ≥0.9), doubles the estimated efficiency of population-based newborn screening to prevent ketoacidosis, and enables individualized risk estimates for better prevention trial selection.
T1D is associated with significant heritable risk, notably from common HLA variants but also from many diverse genetic loci15. Environmental factors increase the risk16. Recent attempts to predict who will develop T1D and at what age, have used islet autoantibodies (AB)17,18, metabolic status19,20, genetic factors21–25 and family history (FH)26. Longitudinal AB measurement has been established as the strongest single predictor of future T1D in first degree relatives18 or in general populations either unselected27 or prescreened for genetic risk1,18,28. Combined assessment of both fixed and time-varying risk factors improves both prediction of T1D progression in first degree relatives20,21,23–25 and the accuracy of diabetes diagnoses in adult incident cases22. However, no T1D screening or prediction efforts to date have taken full advantage of the complementary information that age, genetic risk, FH and environmental factors offer, when combined with AB status, to estimate future T1D risk in all children. Such combined modeling could significantly improve prediction of T1D and other childhood diseases throughout early life by allowing risk assessments to reflect each individual’s specific age and situation.
The Environmental Determinants of Diabetes in the Young (TEDDY) study screened 425,000 children from the USA, Sweden, Germany and Finland and prospectively studied 8,676 from birth through age 15 years29. Participants received frequent AB and exposure testing, in addition to physiological and clinical measurements. We used TEDDY data to develop a model predicting T1D during the first 10 years of life. We considered features known to indicate increased T1D risk, including a recently published T1D genetic risk score(GRS2)30, longitudinal AB measurements, and a variety of other medical, demographic and environmental factors31. This rich dataset enabled us to develop a Combined Risk Score (CRS), targeting children with high genetic risk, to estimate T1D risk at various landmark ages and over specific time horizons.
Results
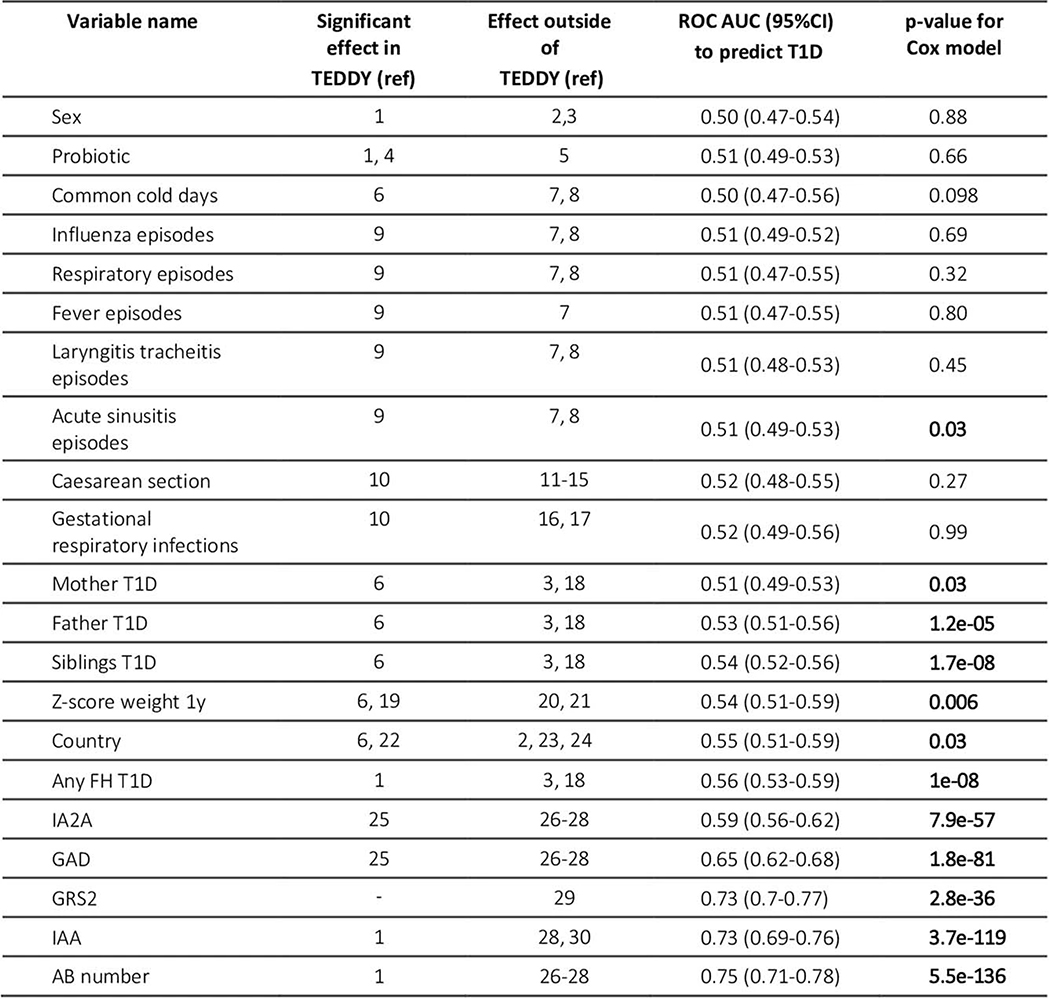
Multiple variables are predictive of childhood T1D in univariate analyses of TEDDY data (Extended Data 1)32,33. These include FH in first-degree relatives, presence of AB, the T1D GRS230, the weight z-score at age 1, sinusitis episodes and country of residence. By age 2, AB are already highly predictive, with a time-dependent ROC AUC of 0.75 (95% CI 0.71–0.78). The GRS2 alone had an AUC of 0.73 (0.70–0.77) despite use in a highly HLA-selected cohort where 94% of the TEDDY cohort had a GRS2 value in the top 20th percentile of a control population. We chose GRS2 because it performed best in TEDDY and other datasets30 compared to similar genetic risk scores (Extended Data 2 and Methods). Other T1D-associated variables such as FH, weight z-score, sinusitis episodes and country of residence were far less predictive (ROC AUCs of 0.51–0.56).
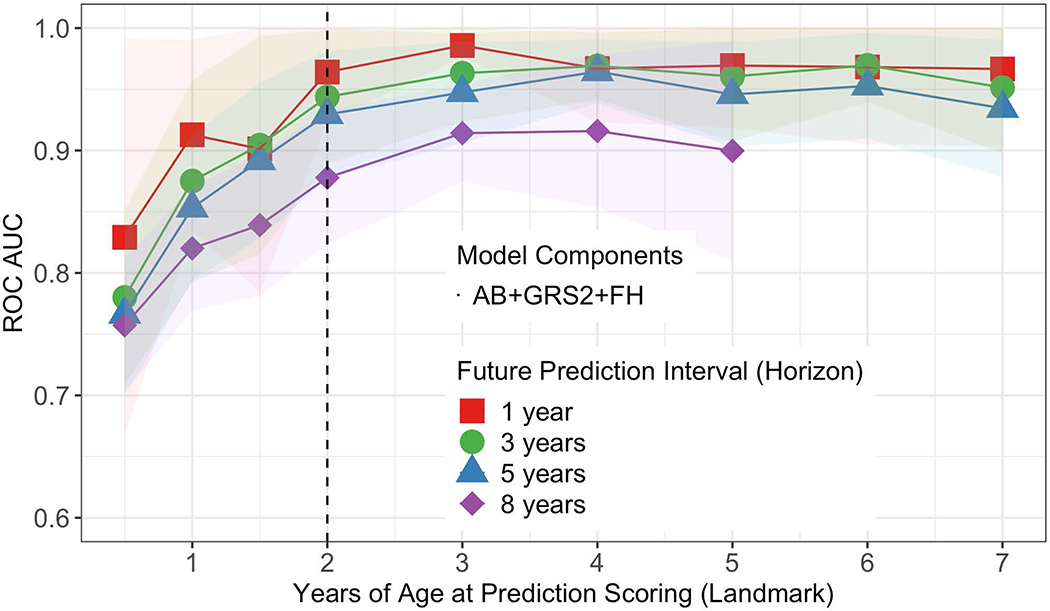
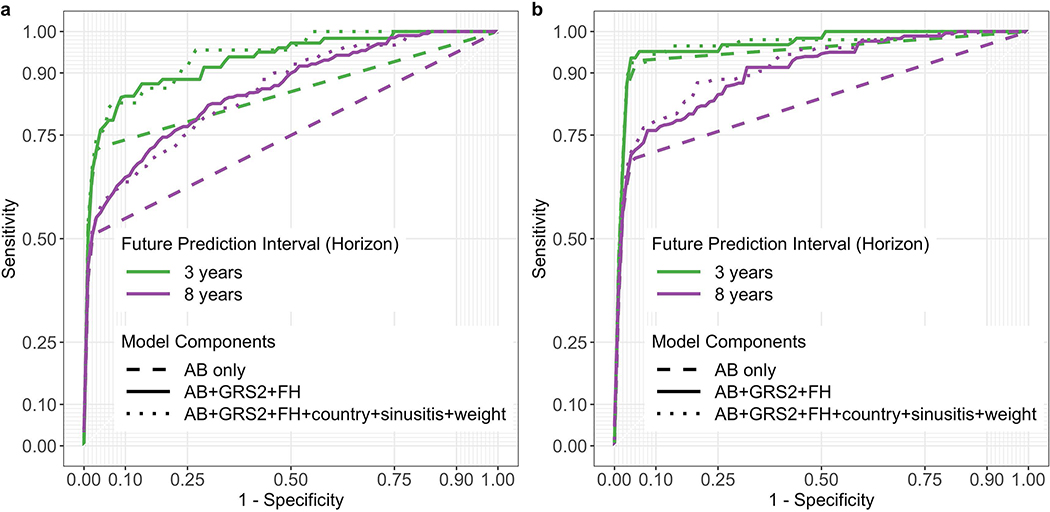
We determined which combination of associated variables from Extended Data 1 best predicted future T1D at each landmark age using stepwise selection. Overall, a 3-variable CRS incorporating AB, GRS2 and FH, performed best in cross-validated time-dependent ROC-AUC (Figure 1) and using the Akaike information criterion (AIC). ROC-AUC were all ≥0.92 for landmarks ≥2 years and horizons up to 5 years. When compared to a model using all 6 associated variables, the 3-variable model performed equally well (Figure 2).
Figure 1:
Average time dependent ROC AUCs for the 3-variable model by age at prediction scoring. Four different prediction horizons are denoted by different colors. The vertical dotted line corresponds to the landmark age of 2 years featured in Figure 2 Panel a. The shaded region indicate the 95% confidence interval of the mean.
Figure 2:
ROC curves derived from models incorporating different numbers of variables. Use of all 6-variables is denoted by the dotted line, 3-variables by the solid line, and autoantibodies only by the dashed line. Curves in panel a use a landmark age of 2 years, with prediction horizons of 3 or 8 years as indicated. Curves in panel b use a landmark age of 4 years, also with prediction horizons of 3 or 8 years as indicated.
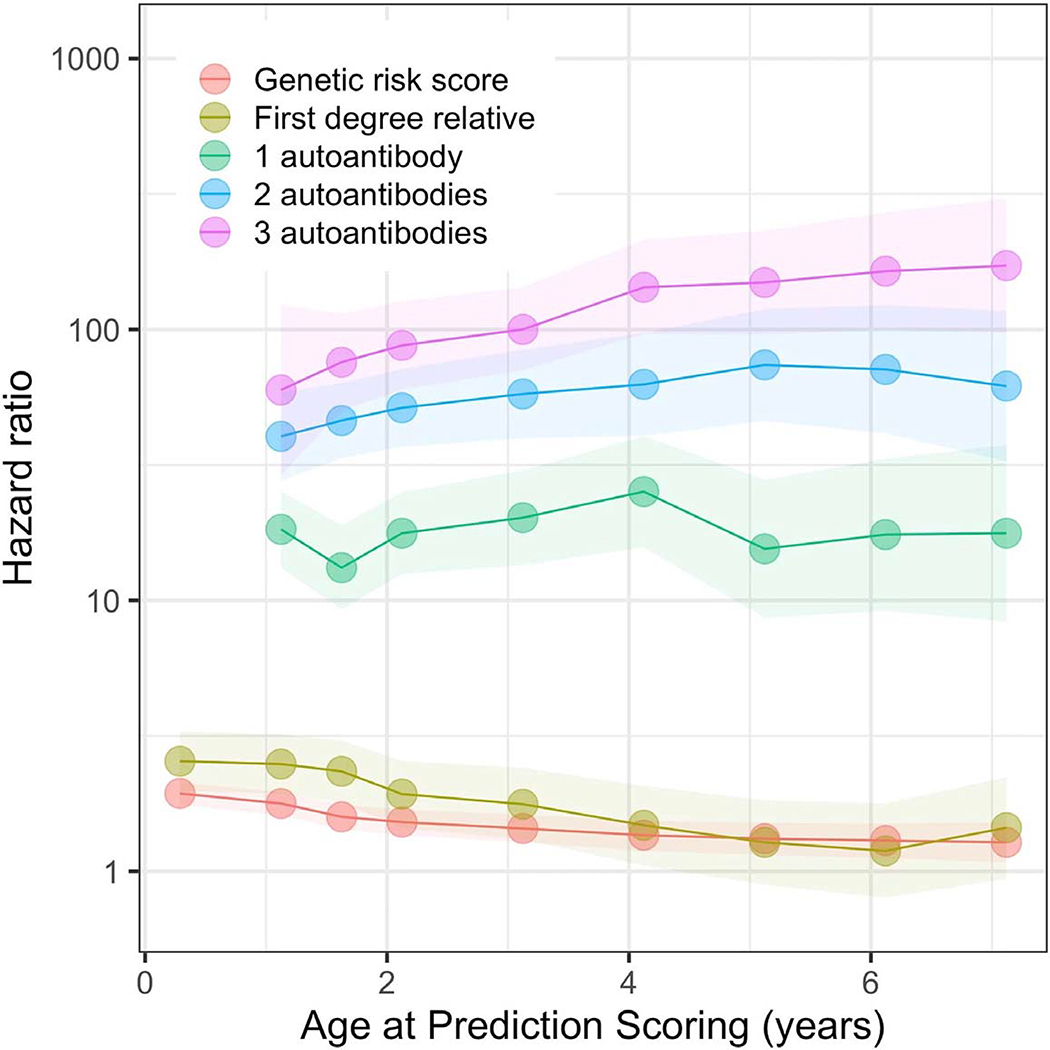
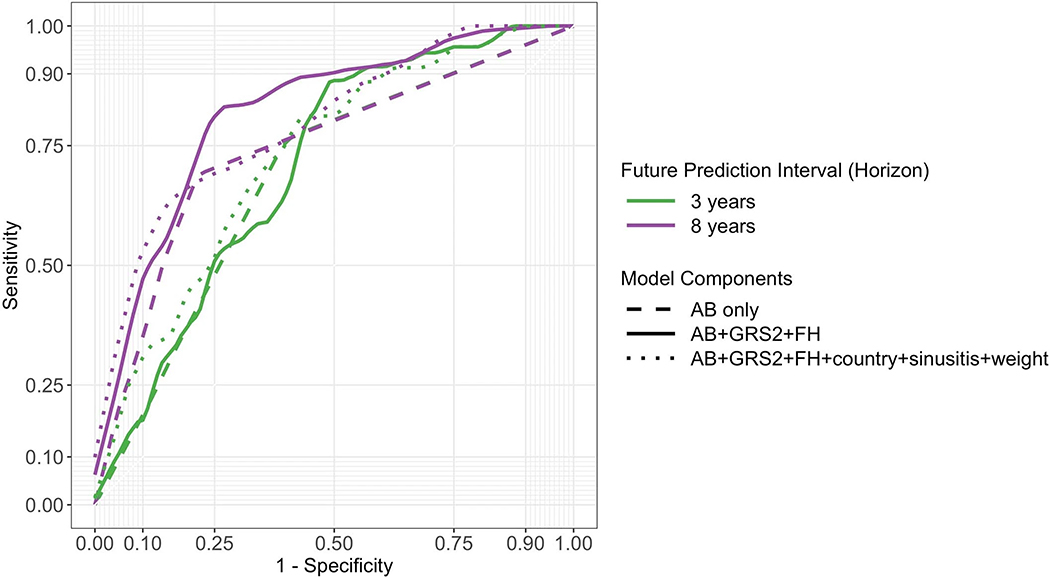
We tested whether additional variables might be eliminated from the 3-variable CRS model. Models with GRS2 and FH outperformed GRS2 alone (Extended Data 3). We asked if a 3-variable CRS was better than AB alone, the latter being the most established approach for T1D prediction. The 3-variable score outperformed AB status alone in univariate Cox regression using AIC, again with higher ROC AUCs upon cross validation (Extended Data 4). This effect was greatest at landmark age 2 for all time horizons (Figure 2a) but also was clear at landmark age 4 for longer horizons (Figure 2b). Nevertheless, when present, AB do confer greater hazard ratios for T1D than GRS2 or FH components (Extended Data 5). The CRS appears to help most for children not yet with AB or with only one AB (right side of ROC curve in Figure 2 and Extended Data 6, respectively). In TEDDY at age 2 years, 38% of children subsequently developing T1D during follow-up to a median age of 9.3 years, will have <2 AB.
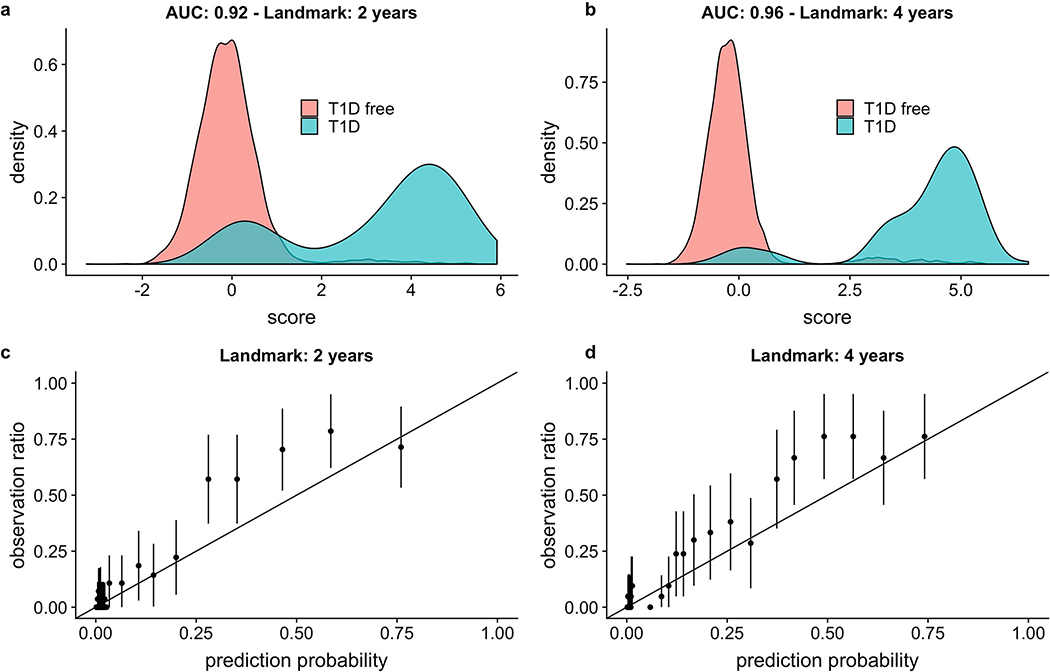
The 3-variable CRS discrimination in this cohort corresponded to well-separated T1D and non- T1D populations in the plotted distributions of the 3-variable CRS. The bimodal CRS distribution among future T1D cases reflects the model’s AB term, since many already have ≥1 AB by landmark age 2 (Figure 3a) and even more by age 4 (Figure 3b). Calibration plots for the 3-variable model with the same 2- and 4-year landmarks (Figures 3c and 3d, respectively) indicate that an increasing CRS generally corresponds to an increasing actual risk of future T1D, with a mild tendency to underestimate disease risk of children at midrange probabilities.
Figure 3:
Performance of the 3-variable model at a 5-year horizon. Panels a and b: Score distributions using a 2-year or 4-year landmark age, respectively. AUC ROC values are noted on the figure. The T1D CRS was generated by the linear predictor of the parametric part of the hazard function of the Cox model. Panels c and d: Calibration plots using a 2- year or 4-year landmark age, respectively. The predictions are grouped into bins corresponding to centiles, and then each bin prevalence (the ratio of plots in this bin with observed T1D endpoints to the total number of plots in this bin) is calculated. Each point represents the mean of each bin, and each error bar indicates the 95% confidence interval of that mean (computed by assuming using normal approximation interval). For 2-year or 4-year landmark ages, a total of n= 6,805 and n= 5,973 children with an AB test in the prior 6 months were analyzed, respectively.
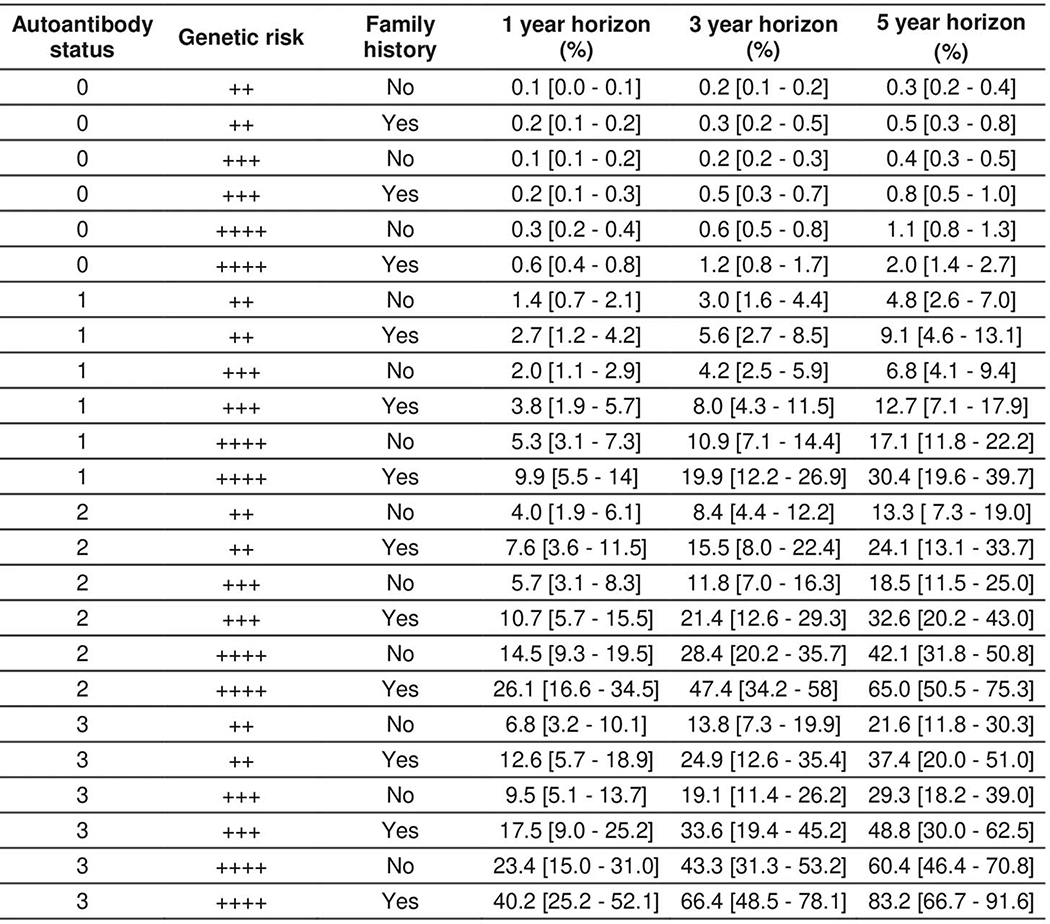
We generated T1D progression risk estimates for individual children based on the 3-variable T1D CRS model, using a 2-year landmark age (Extended Data 7). At moderately high GRS2 (the 90th percentile of a background population using UK Biobank) and without FH, the risk of T1D in the next 5 years increases by ~14% with one AB and by ~42% with two AB. Conversely, for a given number of AB, FH and GRS2 increase risk five-fold when comparing moderately high GRS2 with no FH, to very high GRS2 with a positive FH (Extended Data 7 and Supplementary Table 1).
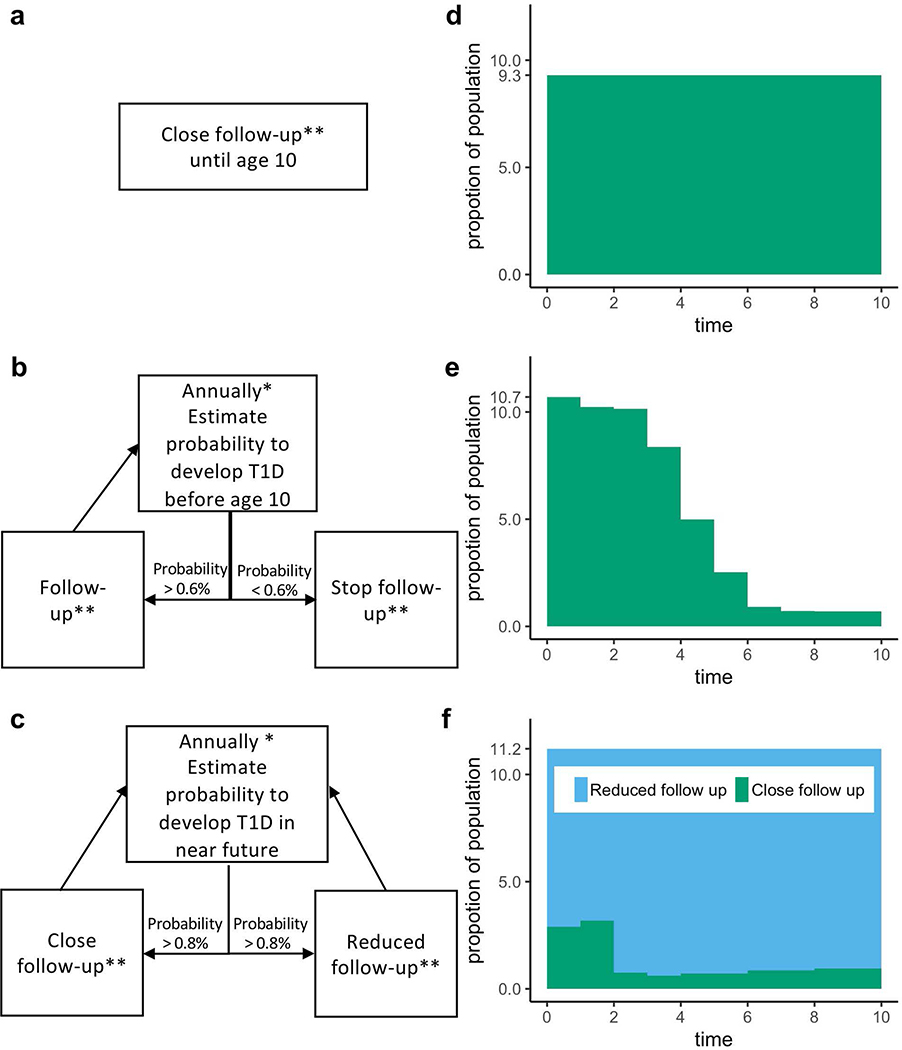
Using TEDDY data, we modeled three population-based screening strategies in incident cases diagnosed by age 10 from among all originally screened newborns (Figure 4). Each was adjusted to achieve a comparable (75%) rate of identification of very high risk ≥4 weeks before onset.
Figure 4:
Three strategies for population-based newborn screening and surveillance follow-up. The models are termed “Classic”, “Simple Adaptive”, and “Advanced Adaptive”. A flow chart for each model is shown in panels a, b and c, respectively. The two adaptive models use the 3-variable T1D CRS to dynamically define the follow-up schedule for each individual in the cohort. Panels d, e and f show the proportion of children remaining under follow-up in each respective scenario using cohort simulations on TEDDY data (n=7,798).
*Risk is recalculated annually during the first 4 years life, then every 2 years thereafter.
**Close follow-up is quarterly to age 3, then biannually to age 6, then annually to age 8.
Reduced follow-up is annually to age 4 and then every two years.
The first “Classic” strategy initially selected infants with high GRS2 genetic risk, and followed them closely (defined as quarterly until age 3, then every 6 months until age 6, and then every year thereafter until age 8). The second “Simple Adaptive” strategy selected infants with high genetic risk, followed them closely, but then recalculated the T1D CRS at annual landmarks. At each landmark, any child with T1D probability by age 10 years of P<0.008 was eliminated from further follow-up. The third “Advanced Adaptive” strategy also selected newborn infants at high genetic risk, but then annually recalculated the T1D CRS to reallocate children between a close follow-up group and a reduced follow-up group. Reallocation was based on a calculated T1D probability in the next 2 years of ≥0.006 or <0.006, respectively.
The endpoint of these prediction strategies, via the CRS, is the estimated percentage risk of T1D onset over the stated time horizons. This guides the approach to the family regarding the risk of impending T1D onset in their child, the follow-up schedule for the child in the two adaptive strategies, and consideration of prevention therapies. Although related, it is distinct from the more commonly used T1D prediction endpoint of islet autoantibodies.
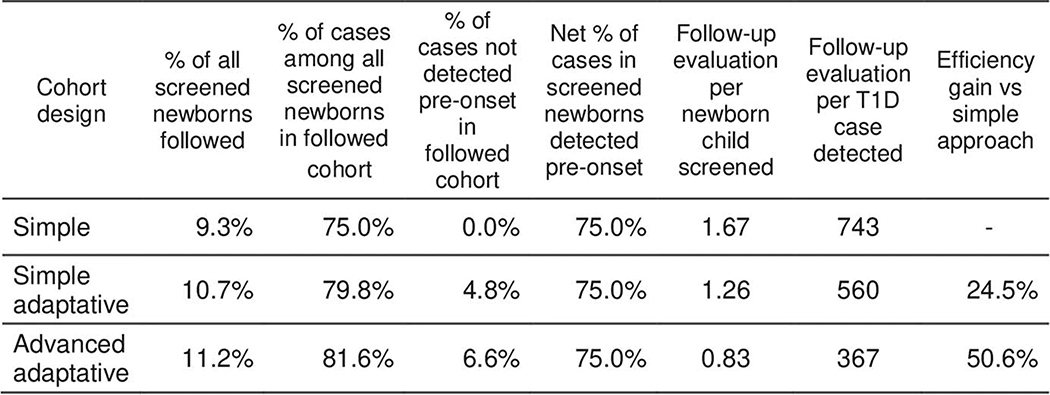
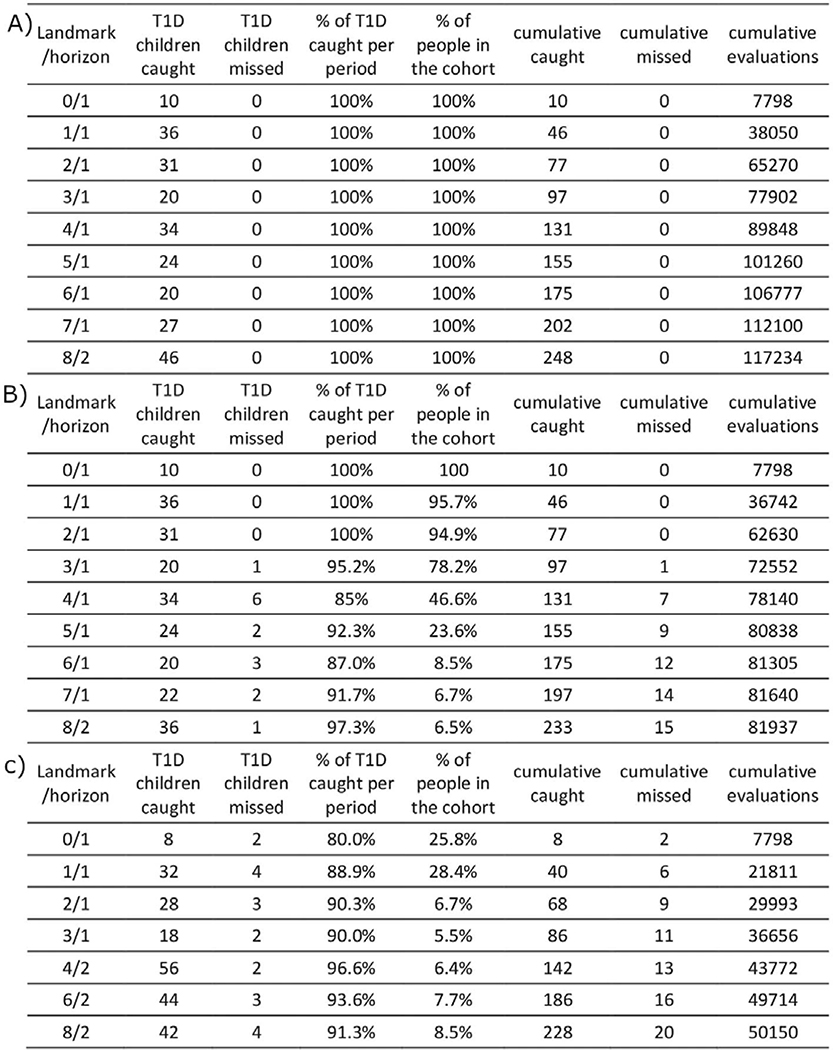
Consistent with requirements of the 3-variable CRS, each follow-up evaluation updates status of three AB (GADA, IA2A and IAA) and T1D family history. We compared the total number of follow-up evaluations required under each strategy to achieve our goal of 75% advance identification of new onset cases. Adaptive strategies utilizing the 3-variable T1D CRS required 25% and 51% fewer surveillance evaluations, respectively, compared to the standard strategy (Extended Data 8 and 9).
Effectively, the CRS identifies children requiring frequent evaluation in order to predict impending T1D onset. This includes even children with no AB who nonetheless may be at high risk of early onset. For example, if children are not closely followed from birth to age 1, then 10 children would not be warned before T1D onset, but this falls to 2/10 or 0/10 using the advanced or simple adaptive strategies, respectively. Similarly, if only AB positives are followed quarterly from age 1 to 2, with others followed yearly, then 11/36 children developing T1D during this year would not receive advanced warning to prevent ketoacidosis. This number falls to 4/36 using the advanced adaptive strategy and 0/36 for the simple adaptive strategy, important improvements at these vulnerable ages.
Discussion
Our results using family history, genotyped risk and autoantibodies, highlight that the most accurate disease prediction, particularly of complex disease, will come from integration of multiple risk factors. This has been demonstrated in other settings (e.g. Q risk34) but our approach is novel for a complex childhood disease. It is notable that exposures such as sinusitis, weight and residence country33, while significant when considered alone, did not appear to add predictive value in a combined model. Using only 3 variables in our final model lessens the possibility of overfitting, while also minimizing information collection at follow-up evaluations.
An increasing area of interest is whether prediction of common, complex pediatric diseases can provide practical health benefit at a population level. The identification of babies with rare, treatable diseases, such as PKU (phenylketonuria), by post-natal heel prick testing is commonplace in modern healthcare systems, and early treatment is life changing35. For T1D, the most life-threatening complication is DKA in the very young, which can lead to serious neurological complications and incurs high treatment costs. Detection of islet-specific AB before onset allows advance warning and close monitoring which lessens the incidence of DKA10–12.
Successful advance warning in infants requires AB surveillance to start early in life and to occur frequently, since progression from AB positivity to hyperglycemia is most rapid in infants1,36.
Without a genotyping component, T1D risk prediction either requires surveillance of too many children, or requires selection by family history which misses most cases. Substituting a polygenic GRS for more commonly used HLA genotypes, and then combining this information with other variables into a CRS for adaptive surveillance, greatly improves efficiency and therefore may allow reconsideration of public health-based newborn screening for T1D and related autoimmune diseases. In this setting, the ability of the CRS to provide accurate individual risk estimates is an important added benefit, although it must be carefully explained that not all children identified as “at high risk” will develop childhood T1D37.
Greater precision in identifying individuals at high risk of impending T1D may greatly improve the cost and feasibility of early life intervention trials, such as those testing expensive vaccines14,38, by reducing the number of participants needed to appropriately power early stage studies24,30. It could also lessen potential exposure to immunosuppressive drugs in children less likely to develop T1D. Finally, it opens the possibility of earlier disease mitigation before dysglycemia appears and when more functioning beta cells remain.
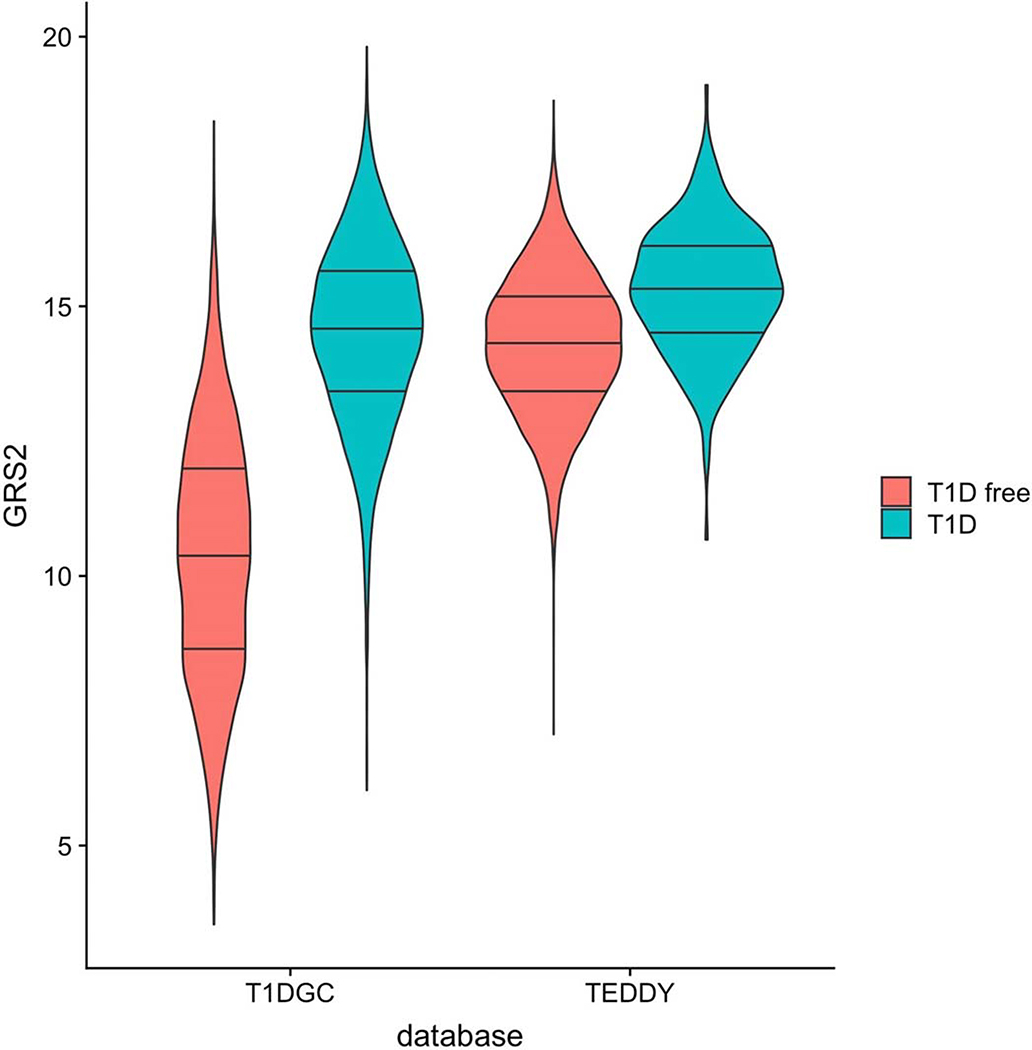
Our study has several limitations. TEDDY, like many birth cohort studies of T1D, preselected newborns at high HLA risk in order to observe sufficient disease endpoints to achieve study goals. After removal of these HLA effects, the remaining difference in genetic risk is much smaller between TEDDY children who developed T1D and those who did not (Extended data 10). Therefore, the CRS yields a lower calculated AUC ROC at landmarks <2 years of age (Figure 1) than would be expected during general population use. In both T1DGC and UK BioBank cohorts30, the GRS2 alone had an AUC ROC >0.92 for T1D. This implies that a 3-variable CRS incorporating GRS2 may have greater ROC AUC’s at young ages in an unselected pediatric population than in TEDDY. However, validating the model on children with a wide range of GRS2 risk awaits the availability of such a dataset. On another note, subtle abnormalities in blood glucose levels by a variety of measures are emerging as an important marker of T1D progression close to diagnosis19. These are not typically measured in prediabetes, and were not measured in children lacking multiple AB in TEDDY, and so cannot be included in our model. Also, the CRS model was less discriminant among children with 2 or more AB. Larger studies with more power are needed to study this specific group at very young ages. Finally, the modeled genes and environmental features common to European and US populations may perform differently in other populations with distinct genetic backgrounds or environments. Analyses to date in other cohorts suggest that GRS2 should perform well in all major U.S. ethnicities39 and that AB are similarly predictive in this regard40. Along these lines, the model validated well when tested in the TEDDY data from each single country using the other three countries to fit the model (Supplementary Table 2). However, to fully address these concerns, external validation in other birth cohorts is an essential next step.
Online Methods
TEDDY is a prospective cohort study designed to identify environmental causes of T1D41
From 2004 to 2010, 424,788 newborns were screened at six US and European centers for high risk HLA genotypes. TEDDY then enrolled 8,676 eligible infants with the intent to follow until age 15 years. The three major eligible HLA-DR-DQ haplotypes are DR3-DQA1*0501-DQB1*0201, DR4- DQA1*0301-DQB1*0302 and DR8-DQA1*0401-DQB1*0402. These are referred to by their DR haplotypes and form the four TEDDY-eligible haplogenotypes DR3/4, DR4/4, DR4/8 and DR3/3. Frequencies of all eligible HLA haplogenotypes for each center are published42. Historical data from the TEDDY centers suggest that ~50% of childhood T1D cases carry one of these four included haplogenotypes.
TEDDY children were followed prospectively from age 3–4 months
with visits every 3 months until age 4 years. Each evaluation tested the three islet antibodies (GADA, IA2A and IAA), changes in family history, as well as other measurements specified by the TEDDY protocol.
After age 4, children with any islet autoantibody (AB) remained on quarterly visits, while antibody-negative children were evaluated every 6 months. Of 8,676 TEDDY enrollees, 7,798 were analyzed herein on the basis of full AB testing, SNP genotyping on the ImmunoChip array, and carrying one of the four major TEDDY eligible HLA haplogenotypes. At the time of analysis, median follow-up was 9.3 years (range 1–168 months, interquartile range [IQR] 54 to 132 months) covering 65,331 person-years of observation. Children are followed prospectively until age 15, or until T1D onset defined using the American Diabetes Association’s criteria for diagnosis41. In this dataset, 305 children developed T1D. Local Institutional Review Board approval, parental informed consent, and child assent where relevant, were obtained for all participants without exception. The study is also monitored by an External Evaluation Committee of the U.S. National Institutes of Health. More details can be found in the Life Sciences Reporting Summary.
The TEDDY Study measures a wide range of background information and environmental exposures on the cohort
Background information includes self-reported race and ethnicity, geographic residence country, and TEDDY Clinical Center. TEDDY registers family history of T1D in the mother, father or sibling. Medical history includes pregnancy factors such as infections and Caesarian-section, and childhood factors such as medications and illnesses. Parental questionnaires captured incidence of the child’s febrile illnesses, respiratory infections (common cold, sinus infection, ear infection, bronchitis, pneumonia) and gastrointestinal infections43. Serum collected at each clinic visit was analyzed for the presence of autoantibodies to glutamic acid decarboxylase (GADA), insulinoma antigen-2 (IA-2A) and insulin (IAA) in two separate core laboratories by using harmonized radiobinding assays incorporating extensive quality control44. Only persistent autoantibodies, positive for the same antigen confirmed by both core laboratories in two consecutive samples, are considered in the current analyses.
Generation of the T1D Genetic Risk Score
TEDDY cohort children were genotyped on the Illumina Infinium ImmunoChip Single Nucleotide Polymorphism (SNP) array45. Prior to imputation, SNP variant quality control filtered on SNP genotype missingness (<1%), Hardy- Weinberg equilibrium (HWE) (p<1×10⁻⁶) and minor allele frequency (<1%). For variants in HLA (chromosome 6: 27Mbp – 35Mbp), due to the HLA-based cohort selection42, we omitted HWE- based filtering in order to retain key variants. Sample quality control checks for sex discordance, individual genotype missingness (<1%) and principal components analysis, resulted in exclusion of 85 subjects. After quality control, 167,350 SNPs and 7,798 individuals were available for analysis. The ImmunoChip data was then imputed to the 1000 Genomes reference panel, yielding 37.1 million SNPs at imputation quality >0.8. Independent of this TEDDY dataset, we have described three T1D genetic risk scores, our original 30-SNP T1D GRS22, the 40-SNP combined TEDDY GRS21 and a recently published more comprehensive 67-SNP T1D GRS230. The latter was newly generated in TEDDY for this analysis. Most of the GRS2 SNPs were genotyped directly, but 21 were imputed with r2≥0.75 and 4 were imputed with r2=0.358–0.544 (Supplementary Table 3). These SNP genotypes were used to generate continuous numerical risk score values for GRS2.
Variable Selection
A broad list of features was evaluated for potential use in a CRS. We evaluated whether incorporating features that change in an individual over time (for example, the development of AB) along with fixed characteristics like GRS, could improve prediction of future T1D risk. Evaluations used time-dependent ROC AUC and p-value (two-sided Wald test) computed at a landmark age of 2 years and a horizon of 8 years on n= 6,805 individuals. All were required to be available in a typical clinical setting, such as initial genetic screening for a panel of SNP markers followed by a standard blood sample and medical history during each follow-up evaluation. To reduce the chance of false discovery and overfitting, we also required each variable to be previously established as associated with T1D in published TEDDY analyses and in the background literature (Extended Data 1). The number of diabetic and nondiabetic children in each of these variable categories is shown in Supplementary Table 3.
Simplification of Risk Factors
We combined information of T1D in a sibling, father, or mother, to a single “any first degree relative with T1D” variable denoted FH. Likewise we combined the GADA, IA2A, and IAA variables to a single variable representing the number of persistent islet autoantibodies (denoted AB). We then compared the model performance using each summary variable versus that using all of the corresponding fully detailed variables. The summary variables, FH and AB, were each equally informative as their individual components (data not shown). T1D GRS230 outperformed prior GRS used in TEDDY21 and elsewhere22 at all landmarks and horizon time prediction, with an average univariate AUC of 0.73 versus 0.63 (Extended Data 2) using n= 7,798 individuals. Therefore, only GRS2 was considered in our modeling, which left us with 6 variables to consider (FH, AB, GRS2, weight z-score, sinusitis episodes and residence country).
Combined Risk Score Model Construction
We used an approach where CRS generation occurred at a fixed time points at and after birth, using all information available up to that time. Participants were assumed negative for islet autoantibodies at birth based on extrapolation from published TEDDY incidence data46. The score was revised at each later time point as information became updated. This approach has been termed “landmarking”47,48 and takes advantage of the TEDDY study design, where risk factors are measured repeatedly on an individual at different time points during childhood. Only patients without T1D at the landmark age of interest are included in analyses. The visit was assigned to occur at the formal visit age if it complied with the protocol-approved visit window. Landmark ages selected were at different visits time: birth, 1, 1.5, 2, 3, 4, 5, 6 and 7 years of age, representing nine different models. Another important feature of survival analyses is the future prediction time interval after the landmark, termed the “horizon” time. The number of children at each landmark age were: 7,798 (birth), 7,563 (1 year), 7,123 (1.5 years), 6,805 (2 years), 6,316 (3 years), 5,973 (4 years), 5,706 (5 years), 5,517 (6 years) and 5,323 (7 years). For example, a landmark at 2 years and horizon time of 5 years, means that we aim to predict if a child will develop T1D by age 7 using a CRS generated on a non-diabetic child at age 2. Horizon times used in this study were 1, 3, 5 and 8 years.
The Combined Risk Scores (CRS) were generated using a Cox regression model. Our goal was to maximize the predictive accuracy while minimizing the number of variables required. We initially selected variables which were independently significant using the Wald test49. At each landmark, we sought to find the best combination of variables to predict T1D, by performing bidirectional stepwise selection with the Bayesian information criterion (BIC)50.
Model Evaluation
Since TEDDY is a prospective cohort study where participants progress to T1D over time and are subject to censoring, time dependency must be incorporated into the predictive assessment of the CRS. We used time-dependent analysis of ROC AUC to evaluate model performance at the various landmark ages and horizon times. We used 3-fold cross validation (repeated 10 times) to assess model precision and to reduce overestimation of model performance. To compare models we used the R timeROC package developed by Blanche et al51. Overall, we selected a set of variables that gave optimal prediction at the various landmarks and horizon times according to the best average AUC derived by cross- validation.
Screening Simulation
We compared a strategy of selecting high risk children from birth and following them all, irrespective of their changing probability of T1D (Classic Strategy), versus two strategies that allowed us to either stop (Simple Adaptive) or to modulate (Advanced Adaptive) later follow-up visits in those individuals with lower probability of T1D. Our goal was to test if we could detect in advance the same number of childhood T1D cases (75%) with fewer follow‐up visits using one of the latter strategies. The three strategies are detailed in Figure 4.
We used UK Biobank to estimate, for initial newborn screening, T1D GRS2 cutoff values which achieved various targets for proportion of future cases included in the “initially followed cohort”. This is described in the first table in the published description of the GRS230. These specific target proportions were matched to the specific sensitivities of the follow-up performance of each overall strategy, to achieve a net 75% pre-onset case detection.
For follow-up, our baseline schedule comprised quarterly evaluations through age 3, then every 6 months until age 6, and then annually thereafter. This strategy was chosen because TEDDY included samples at each of these ages, and for the TEDDY cohort, using this schedule missed very few children. In TEDDY, all high risk children remain in follow up, this schedule misses very few children, with a median of 51 days (IQR 84–18.5 days, range 1–384 days) from last visit to T1D presentation.
The classic strategy used this baseline follow-up schedule. The simple adaptive strategy also used the baseline follow-up schedule in all children remaining in follow-up. The advanced adaptive strategy used the baseline follow-up strategy for those children in the close follow-up subgroup, but annual follow-up for those in the reduced follow-up subgroup. Each follow-up strategy was separately simulated over the TEDDY dataset. We compensated for right censoring in TEDDY data by using an inverse weighting estimator.
The optimum cut-offs for initial genetic inclusion and for retention or reassignment in the surveillance group, were chosen using a grid optimization. We selected the cut-off among the values from 0.001 to 0.01 with steps of 0.001 to determine the optimum value, defined as that minimizing the number of follow-up evaluations while ensuring that 75% of the population cases had an adequate follow-up. Optimization was performed independently for each design strategy. For the simple adaptive strategy it led to a CRS landmark cutoff of T1D probability of ≥0.6% (up to the age of 10) for continued follow-up, which required 10.7% of the screened newborn population to be included in the initially followed cohort. For the advanced adaptive strategy, it led to a CRS landmark cutoff of 2 year T1D probability ≥0.8% for assignment to the frequently followed subgroup, which required 11.2% of screened newborns to be included in the initially followed cohort. Summary statistics of each strategy are shown in Extended Data 8.
Data Availability
Clinical metadata and GRS genotyping data analyzed for this study is available in the NIDDK Central Repository at https://www.niddkrepository.org/studies/teddy in accordance with the NIDDK1s controlled-access authorization process.
Code Availability
The R code used in these analyses is available in the NIDDK Central Repository at https://www.niddkrepository.org/studies/teddy, in accordance with the NIDDK’s controlled-access authorization process.
Extended Data
Extended Data Fig. 1. Variables previously shown or susceptible to be associated with T1D auto-immunity evaluated in univariate analysis.
Time ROC AUC and p-value (two side Wald test) are computed at landmark age 2 years and horizon of 8 years (n = 6,805). Abbreviations: Type 1 diabetes (T1D), Family history (FH), Islet Autoantibodies (AB), insulinoma Antigen-2 Autoantibody (IA2A), Glutamic Acid Decarboxylase Autoantibody (GADA), Insulin AutoAntibody (IAA), Genetic Risk score (GRS2). The referent sex is female. A concise list of references for this table is provided in the Supplementary Information file associated with this paper.
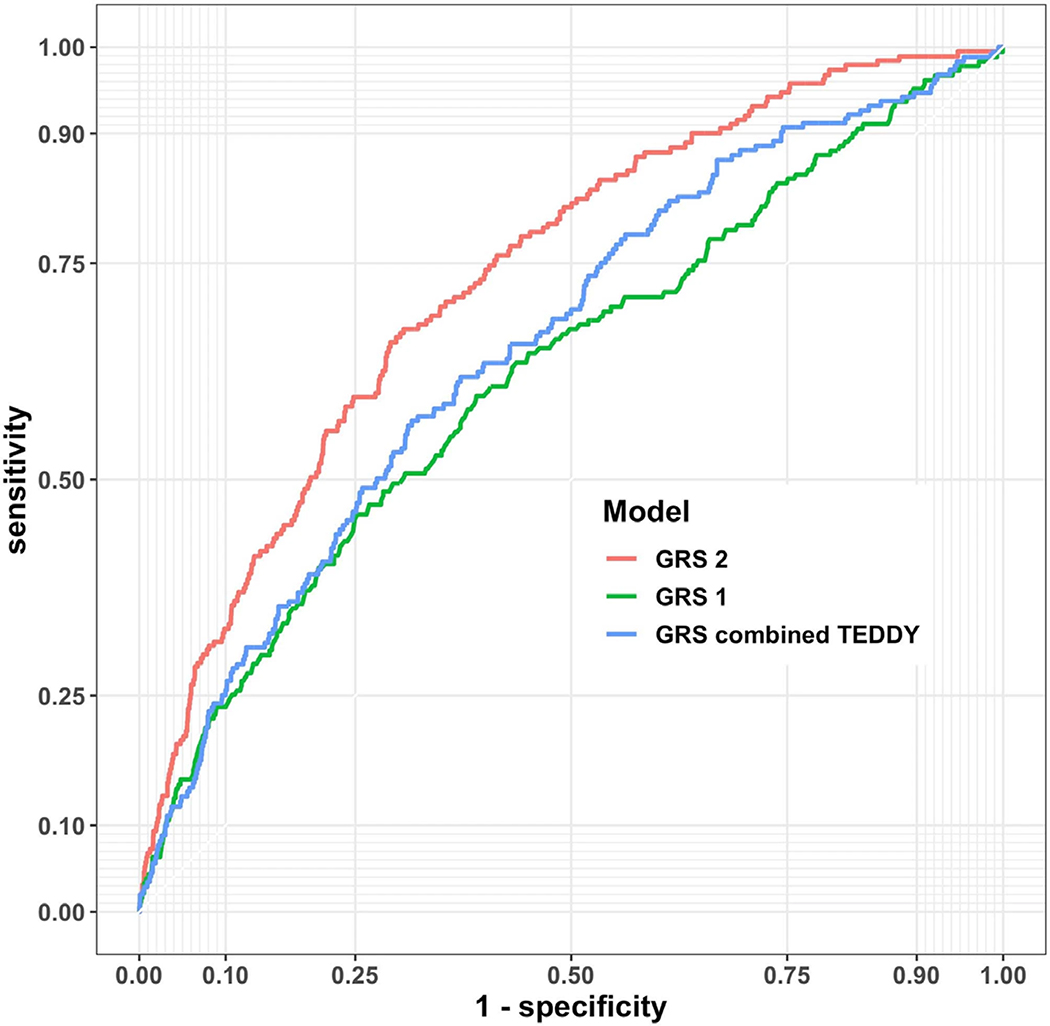
Extended Data Fig. 2. Time dependent ROC curves comparing the performance of various genetic risk scores in the TEDDY cohort.
Shown are curves for GRS1, GRS2 and the combined TEDDY GRS to predict T1D from a landmark age of birth and a horizon interval of 8 years (n= 7,798).
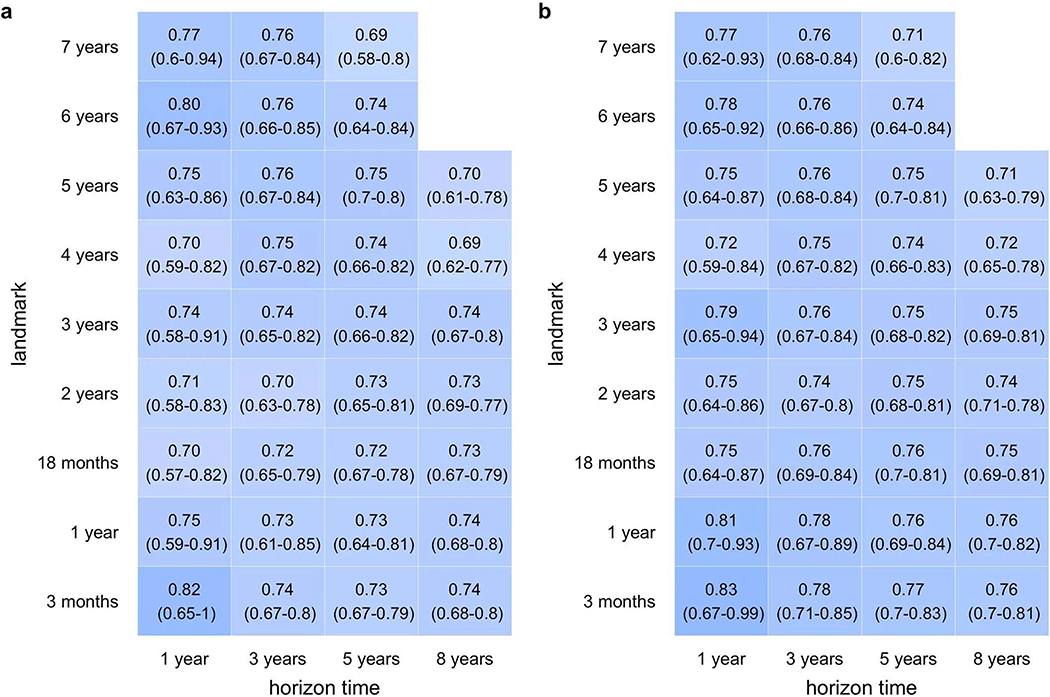
Extended Data Fig. 3. Family history adds predictive power to the T1D GRS2.
T1D GRS2 alone (a) is compared to T1D GRS2 + FH (b) at nine different landmark scoring ages and over four different horizon times. Although 95% confidence intervals always overlapped, among 34 total combinations, T1D GRS2 + FH gave a larger AUC ROC in 24 of these combinations. Results were similar in 9 combinations, and in only one instance was T1D GRS2 better. T1D GRS2 + FH superiority was greatest at landmarks ≤3 years of age. The number of children at each landmark age were 7798 (birth), 7563 (1 year), 7123 (1.5 years), 6805 (2 years), 6316 (3 years), 5973 (4 years), 5706 (5 years), 5517 (6 years) and 5323 (7 years).
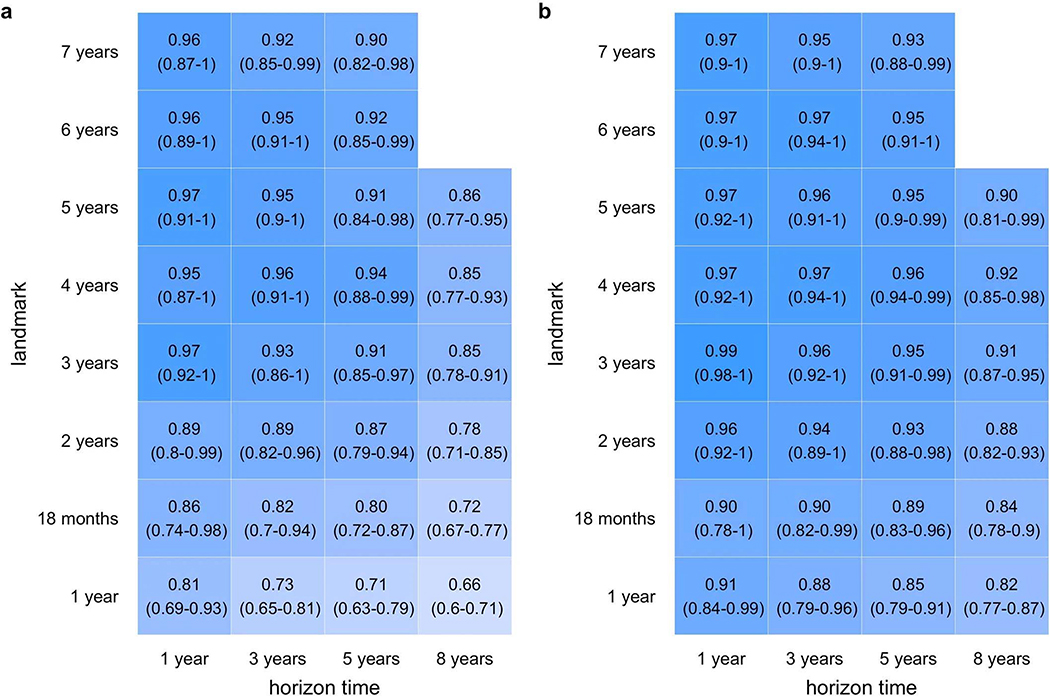
Extended Data Fig. 4. T1D GRS2 and family history add predictive power to AB.
AB alone (a) is compared to the three-variable model of AB, GRS2 and FH. (b) at eight different landmark scoring ages and over four different horizon times. Although 95% confidence intervals overlapped, among 30 total combinations, the three-variable model yielded larger AUC ROC in 28 of these combinations and similar results in the remaining 2 combinations. The differences were often substantial, especially at landmarks ≤4 years of age. The number of children at each landmark age were 7798 (birth), 7563 (1 year), 7123 (1.5 years), 6805 (2 years), 6316 (3 years), 5973 (4 years), 5706 (5 years), 5517 (6 years) and 5323 (7 years).
Extended Data Fig. 5. Hazard ratio for each variable at different ages at prediction scoring landmarks.
Each point represents the hazard ratio at a landmark age (x abscises), the shaded region its respective 95% confidence interval. The number of children at each landmark age were 7798 (birth), 7563 (1 year), 7123 (1.5 years), 6805 (2 years), 6316 (3 years), 5973 (4 years), 5706 (5 years), 5517 (6 years) and 5323 (7 years).
Extended Data Fig. 6. Time dependent ROC of different models now considering only children positive for at least one AB (n = 252).
The landmark age is 2 years. At the 3 year time horizon the CRS (AB+GRS2+FH) performs similarly to AB only, but at the 8 year horizon the CRS is more predictive.
Extended Data Fig. 7. Individual estimated future T1D risk probability percentages (and 95% confidence intervals) for 24 different scenarios combining a GRS risk level and FH background with different AB status calculated at age 2 years.
“++” represents a T1D genetic risk score at 80th percentile of the general (UK) population. “+++” represents a T1D genetic risk score at 90th percentile of the general (UK) population. “++++” represents a T1D genetic risk score at 99th percentile of the general (UK) population.
Extended Data Fig. 8. Comparison of newborn screening strategies aiming to predict ≥75% of the children who will develop T1D before age 10.
In the “Classic” design, the 9.3% of screened newborn population containing 75% of the T1D cases, are all followed for 10 years. In the “Simple Adaptive” design, 10.7% of the screened newborns containing 79.8% of the T1D cases, are followed for variable lengths determined by CRS-based risk, and 4.8% of T1D cases miss AB detection before onset, leaving 75% detected in advance. In the “Advanced Adaptive” design, 11.2% of the screened newborns containing 81.6 % of T1D cases are followed closely or less closely determined by CRS-based risk, 6.6% of cases miss AB detection before onset, again leaving 75% detected. Numbers are computed by using the performance of each strategy on TEDDY data. Tests per child are computed using TEDDY data and simulation to take into account right censoring in TEDDY data.
Extended Data Fig. 9. Visit number calculation for each design.
Table A. Visit number calculations for the “Classic” design. Infants initially selected for high. GRS2 genetic risk were all followed quarterly until age 3, and every 6 months until age 6, then annually thereafter. This simulation was made on the TEDDY dataset. Table B. Visit number calculations for the “Simple Adaptive” design. Infants selected for high genetic risk were initially followed as in the Classic strategy, but the T1D CRS was recalculated at annual landmarks, at which time any child whose T1D probability by age 10 had decreased to <0.8% was eliminated from further follow-up. Of new cases, 94% had high risk detected before onset. This simulation was made on the TEDDY dataset. Table C. Visit number calculations for the “Advanced Adaptive” design. Infants selected for high genetic risk were initially followed as in the Classic strategy, but at birth and annually thereafter, a T1D CRS calculation was used to reallocate children among the quarterly or annual surveillance groups based on T1D probability in 2 years of ≥0.6% or <0.6%, respectively. Of new cases, 92% had high risk detected before onset. Simulation made on the TEDDY dataset.
Extended Data Fig. 10. GRS2 violin plot in the Type 1 Diabetes Genetics Consortium (T1DGC) and TEDDY datasets.
T1DGC is more representative of the general background population. The genetic pre- selection in TEDDY based on the major T1D risk locus HLA-DR-DQ, renders the T1D GRS2 higher in TEDDY, even in T1D free subjects. Further, the separation between T1D and non-T1D subjects in TEDDY is much less. There are 7,798 observations in TEDDY including 305 with T1D. There are 15729 observations in T1DGC including 6483 with T1D. The lines in the violin plots respectively indicate the 25th, 50th and 75th percentiles, while the lowest and the highest point of each violin plot indicates the minimum and the maximum, respectively, for each group of individuals.
Supplementary Material
Acknowledgements
The TEDDY study is included in ClinicalTrials.gov under the identifier: NCT00279318. The TEDDY Study Group is funded by U01 DK63829, U01 DK63861, U01 DK63821, U01 DK63865, U01 DK63863, U01 DK63836, U01 DK63790, UC4 DK63829, UC4 DK63861, UC4 DK63821, UC4 DK63865, UC4 DK63863, UC4 DK63836, UC4 DK95300, UC4 DK100238, UC4 DK106955, UC4 DK112243, UC4 DK117483, and UC4 DK100238 and by Contract no. HHSN267200700014C from the National Institute of Diabetes and Digestive and Kidney Diseases (NIDDK), National Institute of Allergy and Infectious Diseases (NIAID), Eunice Kennedy Shriver National Institute of Child Health and Human Development (NICHD), National Institute of Environmental Health Sciences (NIEHS), Centers for Disease Control and Prevention (CDC), and JDRF. This work is supported in part by the National Institutes of Health/National Center for Advancing Translational Sciences Clinical and Translational Science Awards (UL1 TR000064, University of Florida) and (UL1 TR001082, University of Colorado) and Diabetes Research Center (5P30 DK017047, University of Washington). RAO is supported by a Diabetes UK Harry Keen Fellowship (16/0005529). SS is supported by a Diabetes UK PhD studentship (17/0005757).
MNW is supported by the Wellcome Trust Institutional Support Fund (WT097835MF). RAO, LAF, WAH, and KV are supported by JDRF strategic research agreement (3-SRA-2019-827-S-B).
Footnotes
Competing Interests Statement. RAO holds a UK Medical Research Council Institutional Confidence in Concept grant to develop a 10 SNP biochip T1D genetic test in collaboration with Randox. AGZ is a co-applicant on patent application WO 2019/002364 Al covering use of a genetic risk score to identify and treat individuals with high T1D genetic risk. Neither of these genetic risk tests is identical to the more extensive GRS2 used in the final version of this paper. The other authors declare no conflicts of interest.
References Main Text
- 1.Ziegler AG et al. Seroconversion to Multiple Islet Autoantibodies and Risk of Progression to Diabetes in Children. JAMA 309, 2473 (2013). [DOI] [PMC free article] [PubMed] [Google Scholar]
- 2.Dabelea D et al. Trends in the Prevalence of Ketoacidosis at Diabetes Diagnosis: The SEARCH for Diabetes in Youth Study. Pediatrics 133, e938–e945 (2014). [DOI] [PMC free article] [PubMed] [Google Scholar]
- 3.Alonso GT et al. Diabetic Ketoacidosis at Diagnosis of Type 1 Diabetes in Colorado Children, 2010–2017. Diabetes Care 43, 117–121 (2020). [DOI] [PMC free article] [PubMed] [Google Scholar]
- 4.Jefferies C et al. 15-year incidence of diabetic ketoacidosis at onset of type 1 diabetes in children from a regional setting (Auckland, New Zealand). Sci. Rep 5, 10358 (2015). [DOI] [PMC free article] [PubMed] [Google Scholar]
- 5.Iovane B et al. Diabetic ketoacidosis at the onset of Type 1 diabetes in young children Is it time to launch a tailored campaign for DKA prevention in children <5 years? Acta Biomed 89, 67–71 (2018). [DOI] [PMC free article] [PubMed] [Google Scholar]
- 6.Rewers M et al. Assessment and monitoring of glycemic control in children and adolescents with diabetes. Pediatr. Diabetes 8, 408–418 (2007). [DOI] [PubMed] [Google Scholar]
- 7.Usher-Smith JA, Thompson MJ, Sharp SJ & Walter FM Factors associated with the presence of diabetic ketoacidosis at diagnosis of diabetes in children and young adults: a systematic review. BMJ 343, d4092–d4092 (2011). [DOI] [PMC free article] [PubMed] [Google Scholar]
- 8.Desai D, Mehta D, Mathias P, Menon G & Schubart UK Health Care Utilization and Burden of Diabetic Ketoacidosis in the U.S. Over the Past Decade: A Nationwide Analysis. Diabetes Care 41, 1631–1638 (2018). [DOI] [PubMed] [Google Scholar]
- 9.Glaser N et al. Risk Factors for Cerebral Edema in Children with Diabetic Ketoacidosis. N. Engl. J. Med 344, 264–269 (2001). [DOI] [PubMed] [Google Scholar]
- 10.Barker JM et al. Clinical Characteristics of Children Diagnosed With Type 1 Diabetes Through Intensive Screening and Follow-Up. Diabetes Care 27, 1399–1404 (2004). [DOI] [PubMed] [Google Scholar]
- 11.Winkler C, Schober E, Ziegler AG & Holl RW Markedly reduced rate of diabetic ketoacidosis at onset of type 1 diabetes in relatives screened for islet autoantibodies. Pediatr. Diabetes 13, 301–306 (2012). [DOI] [PubMed] [Google Scholar]
- 12.Elding Larsson H et al. Children followed in the TEDDY study are diagnosed with type 1 diabetes at an early stage of disease. Pediatr. Diabetes 15, 118–126 (2014). [DOI] [PMC free article] [PubMed] [Google Scholar]
- 13.Meehan C, Fout B, Ashcraft J, Schatz DA & Haller MJ Screening for T1D risk to reduce DKA is not economically viable. Pediatr. Diabetes 16, 565–572 (2015). [DOI] [PubMed] [Google Scholar]
- 14.Bonifacio E et al. Effects of High-Dose Oral Insulin on Immune Responses in Children at High Risk for Type 1 Diabetes. JAMA 313, 1541 (2015). [DOI] [PubMed] [Google Scholar]
- 15.Noble JA & Valdes AM Genetics of the HLA Region in the Prediction of Type 1 Diabetes. Curr. Diab. Rep 11, 533–542 (2011). [DOI] [PMC free article] [PubMed] [Google Scholar]
- 16.Rewers M & Ludvigsson J Environmental risk factors for type 1 diabetes. Lancet 387, 2340–2348 (2016). [DOI] [PMC free article] [PubMed] [Google Scholar]
- 17.Beyerlein A, Wehweck F, Ziegler A-G & Pflueger M Respiratory Infections in Early Life and the Development of Islet Autoimmunity in Children at Increased Type 1 Diabetes Risk. JAMA Pediatr 167, 800 (2013). [DOI] [PubMed] [Google Scholar]
- 18.Verge CF et al. Prediction of type I diabetes in first-degree relatives using a combination of insulin, GAD, and ICA512bdc/IA-2 autoantibodies. Diabetes 45, 926–933 (1996). [DOI] [PubMed] [Google Scholar]
- 19.Sosenko JM et al. Glucose and C-Peptide Changes in the Perionset Period of Type 1 Diabetes in the Diabetes Prevention Trial-Type 1. Diabetes Care 31, 2188–2192 (2008). [DOI] [PMC free article] [PubMed] [Google Scholar]
- 20.Redondo MJ et al. A Type 1 Diabetes Genetic Risk Score Predicts Progression of Islet Autoimmunity and Development of Type 1 Diabetes in Individuals at Risk. Diabetes Care 41, 1887–1894 (2018). [DOI] [PMC free article] [PubMed] [Google Scholar]
- 21.Winkler C et al. Feature ranking of type 1 diabetes susceptibility genes improves prediction of type 1 diabetes. Diabetologia 57, 2521–2529 (2014). [DOI] [PubMed] [Google Scholar]
- 22.Oram RA et al. A Type 1 Diabetes Genetic Risk Score Can Aid Discrimination Between Type 1 and Type 2 Diabetes in Young Adults. Diabetes Care 39, 337–344 (2015). [DOI] [PMC free article] [PubMed] [Google Scholar]
- 23.Beyerlein A et al. Progression from islet autoimmunity to clinical type 1 diabetes is influenced by genetic factors: results from the prospective TEDDY study. J. Med. Genet jmedgenet-2018–105532 (2018). doi: 10.1136/jmedgenet-2018-105532 [DOI] [PMC free article] [PubMed] [Google Scholar]
- 24.Bonifacio E et al. Genetic scores to stratify risk of developing multiple islet autoantibodies and type 1 diabetes: A prospective study in children. PLOS Med 15, e1002548 (2018). [DOI] [PMC free article] [PubMed] [Google Scholar]
- 25.Hippich M et al. Genetic Contribution to the Divergence in Type 1 Diabetes Risk Between Children From the General Population and Children From Affected Families. Diabetes 68, 847–857 (2019). [DOI] [PMC free article] [PubMed] [Google Scholar]
- 26.EURODIAB ACE Group 1998. Familial Risk of Type I diabetes in European Children. Diabetologia 41, 1151–1156 (1998). [DOI] [PubMed] [Google Scholar]
- 27.LaGasse JM et al. Successful Prospective Prediction of Type 1 Diabetes in Schoolchildren Through Multiple Defined Autoantibodies: An 8-year follow-up of the Washington State Diabetes Prediction Study. Diabetes Care 25, 505–511 (2002). [DOI] [PubMed] [Google Scholar]
- 28.Ziegler AG et al. Primary prevention of beta-cell autoimmunity and type 1 diabetes - The Global Platform for the Prevention of Autoimmune Diabetes (GPPAD) perspectives. Molecular Metabolism 5, 255–262 (2016). [DOI] [PMC free article] [PubMed] [Google Scholar]
- 29.Hagopian WA et al. TEDDY--The Environmental Determinants of Diabetes in the Young: an observational clinical trial. Ann. N. Y. Acad. Sci 1079, 320–6 (2006). [DOI] [PubMed] [Google Scholar]
- 30.Sharp SA et al. Development and Standardization of an Improved Type 1 Diabetes Genetic Risk Score for Use in Newborn Screening and Incident Diagnosis. Diabetes Care 42, 200–207 (2019). [DOI] [PMC free article] [PubMed] [Google Scholar]
- 31.Rewers M et al. The Environmental Determinants of Diabetes in the Young (TEDDY) Study: 2018 Update. Curr. Diab. Rep 18, 136 (2018). [DOI] [PMC free article] [PubMed] [Google Scholar]
- 32.Krischer JP et al. Genetic and Environmental Interactions Modify the Risk of Diabetes-Related Autoimmunity by 6 Years of Age: The TEDDY Study. Diabetes Care 40, 1194–1202 (2017). [DOI] [PMC free article] [PubMed] [Google Scholar]
- 33.Krischer JP et al. Predicting Islet Cell Autoimmunity and Type 1 Diabetes: An 8-Year TEDDY Study Progress Report. Diabetes Care 42, 1051–1060 (2019). [DOI] [PMC free article] [PubMed] [Google Scholar]
- 34.Hippisley-Cox J, Coupland C & Brindle P Development and validation of QRISK3 risk prediction algorithms to estimate future risk of cardiovascular disease: prospective cohort study. BMJ 357, j2099 (2017). [DOI] [PMC free article] [PubMed] [Google Scholar]
- 35.National Institutes of Health Consensus Development Panel. National Institutes of Health Consensus Development Conference Statement: phenylketonuria: screening and management, October 16–18, 2000. Pediatrics 108, 972–82 (2001). [DOI] [PubMed] [Google Scholar]
- 36.Edge JA, Ford-Adams ME & Dunger DB. Causes of death in children with insulin dependent diabetes 1990–96. Arch. Dis. Child 81, 318–323 (1999). [DOI] [PMC free article] [PubMed] [Google Scholar]
- 37.Rose G Sick Individuals and Sick Populations. Int. J. Epidemiol 14, 32–38 (1985). [DOI] [PubMed] [Google Scholar]
- 38.Hyöty H, Leon F & Knip M Developing a vaccine for type 1 diabetes by targeting coxsackievirus B. Expert Rev. Vaccines 17, 1071–1083 (2018). [DOI] [PubMed] [Google Scholar]
- 39.Redondo MJ, Oram RA & Steck AK Genetic Risk Scores for Type 1 Diabetes Prediction and Diagnosis. Curret Diabetes Reports 17, (2017). [DOI] [PubMed] [Google Scholar]
- 40.Cheng B-W et al. Autoantibodies against islet cell antigens in children with type 1 diabetes mellitus. Oncotarget 9, 16275–16283 (2018). [DOI] [PMC free article] [PubMed] [Google Scholar]
Methods-Only References
- 41.TEDDY Study Group. The Environmental Determinants of Diabetes in the Young (TEDDY) Study. Ann. N. Y. Acad. Sci 1150, 1–13 (2008). [DOI] [PMC free article] [PubMed] [Google Scholar]
- 42.Hagopian WA et al. The Environmental Determinants of Diabetes in the Young (TEDDY): genetic criteria and international diabetes risk screening of 421 000 infants. Pediatr. Diabetes 12, 733–743 (2011). [DOI] [PMC free article] [PubMed] [Google Scholar]
- 43.Lönnrot M et al. A method for reporting and classifying acute infectious diseases in a prospective study of young children: TEDDY. BMC Pediatr 15, 24 (2015). [DOI] [PMC free article] [PubMed] [Google Scholar]
- 44.Bonifacio E et al. Harmonization of Glutamic Acid Decarboxylase and Islet Antigen-2 Autoantibody Assays for National Institute of Diabetes and Digestive and Kidney Diseases Consortia. J. Clin. Endocrinol. Metab 95, 3360–3367 (2010). [DOI] [PMC free article] [PubMed] [Google Scholar]
- 45.Cortes A & Brown MA Promise and pitfalls of the Immunochip. Arthritis Res. Ther 13, 101 (2011). [DOI] [PMC free article] [PubMed] [Google Scholar]
- 46.Krischer JP et al. The 6 year incidence of diabetes-associated autoantibodies in genetically at-risk children: the TEDDY study. Diabetologia 58, 980–987 (2015). [DOI] [PMC free article] [PubMed] [Google Scholar]
- 47.Dafni U Landmark Analysis at the 25-Year Landmark Point. Circ. Cardiovasc. Qual. Outcomes 4, 363–371 (2011). [DOI] [PubMed] [Google Scholar]
- 48.Anderson JR, Cain KC & Gelber RD Analysis of survival by tumor response. J. Clin. Oncol 1, 710–719 (1983). [DOI] [PubMed] [Google Scholar]
- 49.Klein JP & Moeschberger ML Survival Analysis Techniques (Springer-Verlag, 2003). doi: 10.1007/b97377 [DOI] [Google Scholar]
- 50.Venables WN & Ripley B Modern Applied Statistics with S (Springer-Verlag New York, 2002). doi: 10.1007/978-0-387-21706-2 [DOI] [Google Scholar]
- 51.Blanche P, Dartigues J-F & Jacqmin-Gadda H Estimating and comparing time- dependent areas under receiver operating characteristic curves for censored event times with competing risks. Stat. Med 32, 5381–5397 (2013). [DOI] [PubMed] [Google Scholar]
Associated Data
This section collects any data citations, data availability statements, or supplementary materials included in this article.
Supplementary Materials
Data Availability Statement
Clinical metadata and GRS genotyping data analyzed for this study is available in the NIDDK Central Repository at https://www.niddkrepository.org/studies/teddy in accordance with the NIDDK1s controlled-access authorization process.


