Abstract
Background:
Thermoluminescence dosimetry(TLD) has been known as one of the most effective methods for dose estimation in diagnostic radiology. Orthopantomogram (OPG) imaging is used by many dentists, oral and maxillofacial surgeons as an effective tool for choosing an appropriate treatment plan.
Objective:
This study aims to measure the entrance skin dose and the dose values received by different head and neck organs in OPG imaging using TLD dosimeters (TLD-100).
Material and Methods:
In this experimental study, the entrance skin dose and doses of various organs during imaging were measured by TLD dosimeters inside and on the surface of the Rando-Phantom. Doses to various organs, including thyroid, eye, esophagus, parotid and sublingual and submandibular salivary glands were measured. The measurements were repeated twice, and the dose values obtained in the two steps were compared.
Results:
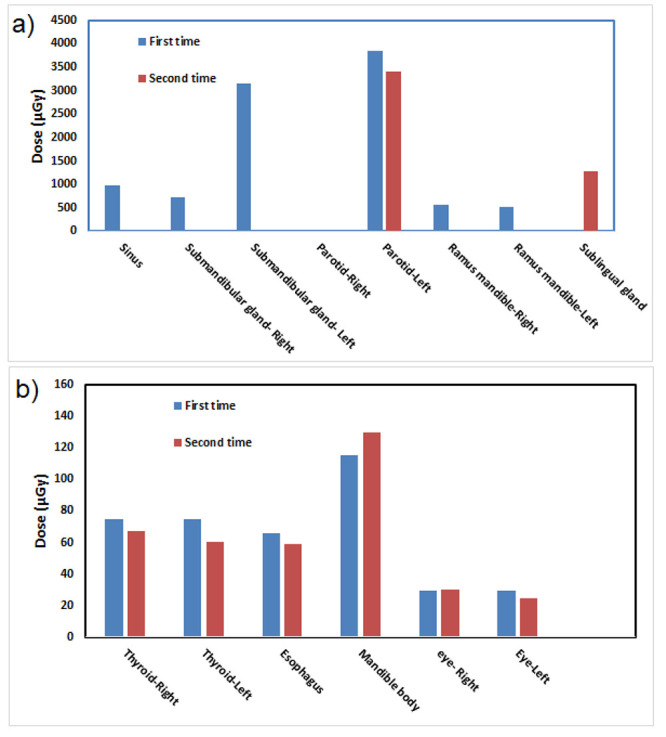
Based on the results obtained in this study, the minimum dose values were found in Esophagus; 65.81, and 59.31 µGy, respectively. The maximum organ dose value was found for left parotid glands, 3842.42, and 3399.58 for the two measurements, respectively.
Conclusion:
The results show that the dose values can vary based on devices, exposure conditions, and TLD positioning.
Keywords: Radiography, Panoramic, Thermoluminescent Dosimetry, Radiology, TLD-100, Rando Phantom, Diagnostic Radiology
Introduction
The precise measurement of entrance skin dose (ESD), in diagnostic radiology imaging is helpful in optimizing patient protection and developing standards and reference levels of diagnostic in countries. Many researchers in different countries have studied this parameter in various radiography imaging modalities [ 1 - 5 ]. In addition, risk assessment is not possible except by measuring the dose delivered to different organs. The International Committee for Radiation Protection (ICRP) suggests measuring the dose of various organs to evaluate the biological effects of radiation on the body [ 6 ]. Orthopantomogram (OPG) or panoramic dental imaging is widely used in forensic sciences [ 7 , 8 ] and diagnostic radiology in diagnosis of various malformations of the head, jaw, and face, especially in orthodontic treatments; therefore, the dose reduction in these systems has been the subject of different investigations [ 7 - 11 ]. The children and adolescents dose reduction issue in diagnostic radiology has always been one of the main concerns in health physics science because of their higher radiation sensitivity [ 12 , 13 ] and higher life expectancy than adults. Thus, measuring the dose delivered to patients in various radiographic tests and optimizing the image quality, and dose to reduce the risk of radiation exposure are very important. Thermoluminescence dosimetry has always been one of the effective dosimetry methods for estimating doses in diagnostic radiology, nuclear medicine and radiotherapy [ 14 - 20 ]. The purpose of this study is to estimate the entrance skin dose and the doses received by various organs in OPG imaging.
Material and Methods
Determination of ECC of TLDs
In this experimental study, cubic chips of T1D-100 (LiF, Mg, Ti) with dimensions of 1 × 3 × 3 mm3 were used for dose measurements. At first, a batch containing one hundred TLD-100 chips was selected for dosimetry. All TLDs were heated at 400 °C for 20 hours then at 80 °C for 1 hour. The TLDs were then exposed to an equal value of dose; and the responses of these TLDs were read out using the Harshaw-4500 TLD reader device to obtain the ECC factor of the TLDs according to Equation (1).
(1)
In which ECCi and 〈TLEi〉 are the element calibration coefficient and readout of TLD chip i, respectively, and is the average readings of TLDs. After obtaining ECCs, 50 chips with ECCs close to 1 were selected to be used for dosimetry, and calibration.
Calibration of TLDs
In order to obtain the TLD calibration curve, 12 TLD chips in 4 plastic packs were used after annealing procedure (1 hour at 400 °C and 20 hours at 80 °C). Three triple packs of these TLDs were exposed to specific doses of 416, 2190, and 5642 µGy. A package was also used to measure background radiation. The calibration process was performed with an X-ray machine with the same X-ray quality of the OPG unit. Subsequently, all exposed chips were read out by the TLD reader, and the corrected readings of each chip (according to Equation 2) were used to plot the calibration curve.
(2)
Where Ri-C and Ri are the primary readout and corrected readout of the ith chip. Rj-b is the readout of the jth background chip, ECCi and ECCj-b are the ECC values of the TLD chip i and background chip j, respectively and, and finally, n is the number of TLDs assigned to the background measurement.
Since the calibration curve of TLDs is a linear curve, the relationship between the doses of each TLD and its corrected readings is as following:
Di(μGy)=[a×Ri-C] (3)
Where Di(µGy) is the dose received by chip i, and a is the calibration coefficient of TLDs.
Dosimetry with TLD chips
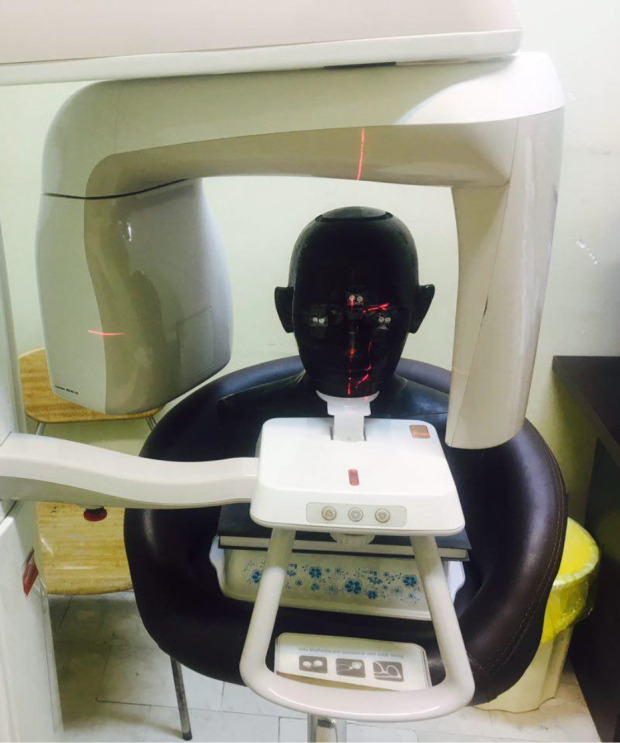
In this step, a number of annealed TLD chips were packed in dark plastic envelopes for measurement of the entrance skin dose of the Phantom. Several TLD chips were also placed within the Rando phantom at the position of the target organs (thyroid, eyes, esophagus, sublingual, and parotid, and submandibular salivary glands). Rando phantom was exposed with OPG device, with the routine exposure conditions used for the patients, i.e. 68kv, 8mA, and 13.5 s. The geometry of Rando phantom is shown in Figure 1. Three TLD chips were also used to measure background radiation. The exposed TLDs were read out by Harshaw 4500, TLD-reader. Considering the linear calibration curve, the dose received by each TLD was obtained according to equation (3). The whole process was repeated once more.
Figure 1.

Imaging geometry
Results
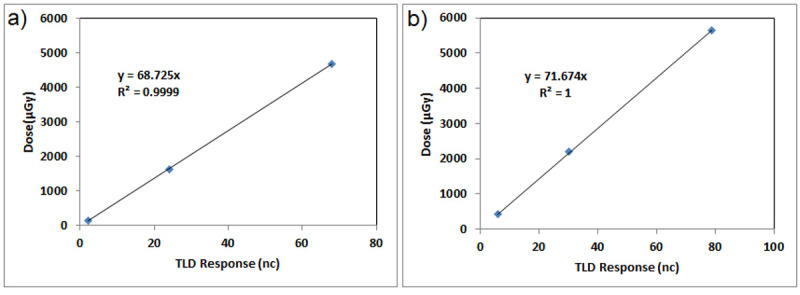
The calibration curves obtained for the TLD-100 in the two steps are shown in Figure 2. The dose of each TLD was obtained by multiplying the chip readout by calibration coefficient of each step, i.e. 68.72 (µGy/nc), 71.67 (µGy/nc) for the first, and the second steps, respectively. Figures 3a and b compare the dose in different organs obtained in the two steps. Table 1, a comparison of the entrance dose measured in each step is shown. The analysis of the TL dosimetry uncertainty is also shown in Table 2. In Table 3, there is a comparison of the measured values of entrance skin dose and organ doses in this study with the reported values in other investigations.
Figure 2.

Thermoluminescence dosimetry(TLD) -100 calibration curve
Figure 3.

Comparison of absorbed dose of different organs in Orthopantomogram (OPG) imaging.
Table 1.
Entrance dose measured in each step
| Organ | Surface dose (µGy) | |
|---|---|---|
| Entrance skin dose(µGy) | ||
| First time | Second time | |
| Right cheek | 79.55 | |
| Left cheek | 47.24 | |
| Temporal surface-Right | 11.15 | |
| Temporal surface-Left | 4.80 | |
| Head | 13.29 | |
| Right back of the neck | 360.58 | |
| Left back of the neck | 334.28 | |
| Neck | 377.59 | |
| Thyroid surface | 52.68 | |
| Eye-Right | 29.25 | 30.00 |
| Eye-Left | 29.79 | 24.98 |
Table 2.
Thermoluminescence dosimetry error analysis of dosimeters
| Uncertainty Component | Type A (%) | Type B (%) | |
|---|---|---|---|
| Iteration of measurements with TLDs | 4 | --- | |
| Dose Calibration | --- | 5 | |
| Correction of energy dependency | --- | --- | |
| Correction for nonlinearity and fading | --- | --- | |
| Combination of errors | σA-total=4 | σB-total=5 | |
| Total error | |||
Table 3.
Comparison of measured doses in different investigations with the results of this study
| This study 68kv, 8mA, 13.5s | Gavala [21] 66kV, 8 mA | Eftekhari moghadam [22] 70Kv, 10mA, 14s | |
|---|---|---|---|
| Country | Iran | Athens | Iran |
| Year | 2017 | 2009 | 2015 |
| parotid | 3397.48 | 320 | 1825 |
| thyroid | 46.75 | 60 | 1415 |
| submandibular | 1572.50 | 416 | 1450 |
| Entrance skin Dose (µGy) | 360.58 Right back of neck; 334.28 Left back of neck | 170 back of neck | |
| 90 skin (occipital area) | |||
| 79.55 for right cheek | 20 for skin (zygomatic area) | ||
| 47.24 for left cheek | |||
Discussion
According to the results shown in Figure 3, and Table 1, the results obtained in both measurements are comparable to each other. The small difference in the results may be due to the uncertainties in TLD, and positioning of the phantom. The total uncertainty in the TLD measurements is about 6%. The uncertainty type-A of the TLD response due to the iteration of the measurements was 4%, while type B uncertainty due to the calibration was 5%. The errors due to the energy dependency of the TLDs were ignorable, as the energy spectrum used for the calibration was similar to energy spectrum used for the measurement. As the calibration TLDs, and those used for the measurement were read out at the same day, the uncertainty for fading of the TLD signals can be ignored.
Conclusion
It can be concluded the dose values can vary based on devices and exposure conditions. The difference observed between the doses values obtained in this study, and those reported by the previous investigators may be due to several reasons such as phantom positioning, the imaging technique, filtration of the x ray beam, and position of the dosimeters inside or on the phantom.
For instance, the large differences observed between the doses of thyroid, and parotid glands may mainly be because of the patient positioning (the parts of the head and neck which is irradiated as the main field size). Another reason for such differences may be because of the different position of the TLDs inside the organ.
Therefore, it can be concluded that we should put more TLD chips inside each organ, when we want to estimate the effective dose accurately.
Footnotes
Conflict of Interest: None
References
- 1.Faghihi R, Mehdizadeh S, Sina S, Alizadeh F N, Zeinali B, Kamyab G R, et al. Radiation dose to neonates undergoing X-ray imaging in special care baby units in Iran. Radiat Prot Dosim etry. 2012;150(1):55–9. doi: 10.1093/rpd/ncr373. [DOI] [PubMed] [Google Scholar]
- 2.Sina S, Zeinali B, Karimipoorfard M, Lotfalizadeh F, Sadeghi M, Zamani E, Faghihi R. Investigation of the entrance surface dose and dose to different organs in lumbar spine imaging. J Biomed Phys Eng. 2014;4(4):119–26. [ PMC Free Article ] [PMC free article] [PubMed] [Google Scholar]
- 3.Mettler Jr F A, Huda W, Yoshizumi T T, Mahesh M. Effective doses in radiology and diagnostic nuclear medicine: a catalog. Radiology. 2008;248(1):254–63. doi: 10.1148/radiol.2481071451. [DOI] [PubMed] [Google Scholar]
- 4.Omrane L B, Verhaegen F, Chahed N, Mtimet S. An investigation of entrance surface dose calculations for diagnostic radiology using Monte Carlo simulations and radiotherapy dosimetry formalisms. Physics in Medicine & Biology. 2003;48(12):1809–24. doi: 10.1088/0031-9155/48/12/310. [DOI] [PubMed] [Google Scholar]
- 5.Duggan L, Warren-Forward H, Smith T, Kron T. Investigation of dose reduction neonatal radiography using specially designed phantoms and LiF:Mg,Cu,P TLDs. Br J Radiol. 2003;76(904):232–7. doi: 10.1259/bjr/79291075. [DOI] [PubMed] [Google Scholar]
- 6. International Commission on Radiological Protection. Recommendations of the International Commission on Radiological Protection. ICRP;1991 . [Google Scholar]
- 7.Baumann P, Widek T, Merkens H, Boldt J, Petrovic A, Urschler M, Kirnbauer B, Jakse N, Scheurer E. Dental age estimation of living persons: Comparison of MRI with OPG. Forensic science international. 2015;253:76–80. doi: 10.1016/j.forsciint.2015.06.001. [DOI] [PubMed] [Google Scholar]
- 8.Karaarslan B, Karaarslan E S, Ozsevik A S, Ertas E. Age estimation for dental patients using orthopantomographs. Eur J Dent. 2010;4(04):389–94. [ PMC Free Article ] [PMC free article] [PubMed] [Google Scholar]
- 9.Danforth R A, Clark D E. Effective dose from radiation absorbed during a panoramic examination with a new generation machine. Oral Surg Oral Med Oral Pathol Oral Radiol Endod. 2000;89(2):236–43. doi: 10.1067/moe.2000.103526. [DOI] [PubMed] [Google Scholar]
- 10.Ludlow J B, Davies-Ludlow L E, Brooks S L. Dosimetry of two extraoral direct digital imaging devices: NewTom cone beam CT and Orthophos Plus DS panoramic unit. Dentomaxillofacial Radiology. 2003;32(4):229–34. doi: 10.1259/dmfr/26310390. [DOI] [PubMed] [Google Scholar]
- 11.Gijbels F, Sanderink G, Wyatt J, Van Dam J, Nowak B, Jacobs R. Radiation doses of indirect and direct digital cephalometric radiography. Br Dent J. 2004;197(3):149–52. doi: 10.1038/sj.bdj.4811532. [DOI] [PubMed] [Google Scholar]
- 12.Gavala S, Donta C, Tsiklakis K, Boziari A, Kamenopoulou V, Stamatakis H C. Radiation dose reduction in direct digital panoramic radiography. Eur J Radiol. 2009;71(1):42–8. doi: 10.1016/j.ejrad.2008.03.018. [DOI] [PubMed] [Google Scholar]
- 13.Tsiklakis K, Donta-Bakoyanni C, Tassopoulou M, Kamenopoulou V. Absorbed radiation dose during lateral cephalometric radiography: comparison of screen-film systems and field-size combinations. J Clin Pediatr Dent. 2000;24(2):117–21. [PubMed] [Google Scholar]
- 14.Sina S, Faghihi R, Meigooni A S, Mehdizadeh S, Mosleh Shirazi M A, Zehtabian M. Impact of the vaginal applicator and dummy pellets on the dosimetry parameters of Cs-137 brachytherapy source. J Appl Clin Med Phys. 2011;12(3):3480. doi: 10.1120/jacmp.v12i3.3480. [ PMC Free Article ] [DOI] [PMC free article] [PubMed] [Google Scholar]
- 15.Mosleh Shirazi M A, Faghihi R, Siavashpour Z, Nedaie H A, Mehdizadeh S, Sina S. Independent evaluation of an in-house brachytherapy treatment planning system using simulation, measurement and calculation methods. J Appl Clin Med Phys. 2012;13:103–112. doi: 10.1120/jacmp.v13i2.3687. [ PMC Free Article ] [DOI] [PMC free article] [PubMed] [Google Scholar]
- 16.Mohammadyari P, Zehtabian M, Sina S, Tavasoli A R, Faghihi R. Dosimetry of gamma chamber blood irradiator using PAGAT gel dosimeter and Monte Carlo simulations. J Appl Clin Med Phys. 2014;15(1):316–30. doi: 10.1120/jacmp.v15i1.3952. [ PMC Free Article ] [DOI] [PMC free article] [PubMed] [Google Scholar]
- 17.Sadeghi M, Sina S, Faghihi R. Investigation of LiF, Mg and Ti (TLD-100) Reproducibility. J Biomed Phys Eng. 2015;5(4):217 –222. [ PMC Free Article ] [PMC free article] [PubMed] [Google Scholar]
- 18.Ghaedizirgar M, Faghihi R, Paydar R, Sina S. Effective Dose in Two Different Dental Cbct Systems: Newtom Vgi and Planmeca 3d Mid. Radiation Protection Dosimetry. 2017;179(3):287–293. doi: 10.1093/rpd/ncx008. [DOI] [PubMed] [Google Scholar]
- 19.Zehtabian M, Dehghan N, Danaei Ghazanfarkhani M, Haghighatafshar M, Sina S. Measurement of the Dose to the Family Members Taking Care of Thyroid Cancer Patients Undergoing I-131 Therapy in Nuclear Medicine Using TLD-100. Radiat Prot Dosimetry. 2017;174(4):541–544. doi: 10.1093/rpd/ncw242. [DOI] [PubMed] [Google Scholar]
- 20.Moudi E, Hadian H, Monfared A, Haghanifar S, Deilam G, Bahemmat N. Assessment of radiation exposure of eyes, parotid and thyroid gland during panoramic radiography. World Journal of Medicine and Medical Science Research. 2013;1(3):44–50. [Google Scholar]
- 21.Gavala S, Donta C, Tsiklakis K, Boziari A, Kamenopoulou V, Stamatakis H C. Radiation dose reduction in direct digital panoramic radiography. Eur J Radiol. 2009;71(1):42–8. doi: 10.1016/j.ejrad.2008.03.018. [DOI] [PubMed] [Google Scholar]
- 22.Moghadam A E, Mardani M, Hasanzadeh H, Rafati M. Assessment of absorbed dose in critical organs in OPG: a phantom study. Journal of Paramedical Sciences (JPS) 2015;6(1):44–9. doi: 10.22037/jps.v6i1.8183. [DOI] [Google Scholar]


