

Abstract

Phomoxanthone A and B (PXA and PXB) are xanthone dimers and isolated from the endophytic fungus Phomopsis sp. By254. The results demonstrated that PXB and PXA are noncompetitive inhibitors of SHP2 and PTP1B and competitive inhibitors of SHP1. Molecular docking studies showed that PXB and PXA interact with conserved domains of protein tyrosine phosphatases such as the β5-β6 loop, WPD loop, P loop, and Q loop. PXA and PXB could significantly inhibit the cell proliferation in MCF7 cells. Our results indicated that these two compounds do not efficiently inhibit PTP1B and SHP2 activity. RNA sequencing showed that PXA and PXB may inhibit SHP1 activity in MCF7 cells leading to the upregulation of inflammatory factors. In addition to PTP inhibition, PXA and PXB are multitarget compounds to inhibit the proliferation of tumor cells. In conclusion, both compounds show inhibition of cancer cells and a certain degree of inflammatory stimulation, which make them promising for tumor immunotherapy.
Introduction
Accumulating evidence indicates that aberrant expression protein tyrosine phosphatases (PTPs) can lead to serious human diseases, such as cancer, diabetes, autoimmune diseases, etc.1,2 PTPs such as SHP1, SHP2, and PTP1B have emerged as compelling targets for drug discovery.3 PTP1B negatively regulates insulin and leptin signaling, which is involved in diabetes and obesity.4 SHP1 is a widely expressed inhibitory PTP and was reported as the next checkpoint target for cancer immunotherapy.5 Shp2 is overexpressed or hyperactivated in many human cancers and serves as a therapeutic target against human cancer.6
Xanthones are a class of heterocyclic natural products, which are promising sources of anticancer leads.7 Phomoxanthone A and B (PXA and PXB) are xanthone dimers and were first isolated from the endophytic fungus Phomopsis sp. BCC 1323. They exhibit cytotoxic, antimalarial, and antitubercular activities.8 PXA induces the apoptosis of cancer cells by activating the caspase 3 signaling pathway9 and shows differential genotoxicity and cytotoxicity against HL60 tumor cells and peripheral blood lymphocytes.10 PXA can also activate murine immune cells such as T lymphocytes, NK cells, and macrophages. The ability to induce cancer cell apoptosis and activate immune cells can be more effective in the treatment of tumor, especially chemotherapy-resistant cancer cells.11,12 Further studies showed that PXA is a mitochondrial toxin that could depolarize the mitochondria.13
PXA is a homodimer of two acetylated tetrahydroxanthones symmetrically linked at C-4,4′, whereas PXB is structurally almost identical but asymmetrically linked at C-2,4′.13 For the first time, we demonstrated that PXA and PXB show inhibition to SHP1, SHP2, and PTP1B. Further experiments proved that both compounds also exhibit antitumor activity. RNA sequencing results demonstrated that both compounds significantly upregulated the expression of inflammatory factor genes and inflammation-related pathways. PXB and PXA may show SHP1 inhibition to promote the expression of inflammation-related genes in MCF7 cells.
Results and Discussion
To identify novel PTP inhibitors, we screened a diverse collection of the second metabolites of entomogenous fungi using an in vitro PTP assay. Finally, we found that PXA and PXB, isolated from the endophytic fungus Phomopsis sp. By254, have PTP inhibition activity (Table 1). Sodium orthovanadate is a commonly used general inhibitor for PTPs. We used sodium orthovanadate as the positive control (Table S1). The inhibitory effect of PXA and PXB was much better than that of sodium orthovanadate. PXA and PXB showed similar inhibition results. These two compounds showed a strong inhibition ability against SHP1, SHP2, and PTP1B but a less inhibition ability against STEP and LYP. To determine the inhibition type of PXA and PXB, we performed Lineweaver–Burk plot analysis by which competitive or noncompetitive inhibitors can be distinguished. Competitive inhibitors bind the active site of the enzyme and have no effect on the Vmax but increase the Km. The Lineweaver–Burk plot of competitive inhibitors shows a series of lines converging on the Y axis at the same point. Noncompetitive inhibitors bind to the allosteric site of the enzyme other than the active site and have no effect on the Km but decrease the Vmax. The Lineweaver–Burk plot of noncompetitive inhibitors shows a series of lines crossing the X axis at the same point. Lineweaver–Burk plot analysis demonstrated that PXB and PXA are noncompetitive inhibitors of SHP2 and PTP1B and competitive inhibitors of SHP1 (Figure 1).
Table 1. IC50 Values (μM) of PXA and PXB against PTPa.
| compound | PXA | PXB |
|---|---|---|
| PTP1B | 13.05 ± 1.13 | 14.32 ± 2.20 |
| SHP2 | 20.47 ± 4.45 | 11.86 ± 3.02 |
| SHP1 | 36.46 ± 2.02 | 32.14 ± 3.74 |
| STEP | >150 | >150 |
| LYP | >150 | >150 |
Data are presented as the mean ± SD of three experiments performed in triplicate.
Figure 1.

Lineweaver–Burk plot for PTP inhibition by PXA and PXB. PTP inhibition was analyzed in the presence of different PXA or PXB concentrations. Lineweaver–Burk plots were generated by linear regression of the reciprocal data. (A) Structure of PXA and PXB. (B) Lineweaver–Burk plot for PTP1B inhibition. (C) Lineweaver–Burk plot for SHP2 inhibition. (D) Lineweaver–Burk plot for SHP1 inhibition. PXA on the left and PXB on the right.
To provide insight into the molecular basis for PTP binding and specificity of PXA and PXB, we performed molecular docking studies. Typical PTPs have conserved structures such as the WPD loop, Q loop, P loop, p-Tyr loop, and β5-β6 loop. The highly conserved active site (VHCSXGXGR[T/S]G) defines the PTP family and is also called the P loop. The active site nucleophile methionine in the P loop recognizes and accepts the phosphoryl moiety transiently during catalysis. The pTyr recognition loop confers recognition and specificity to substrate. The dynamic change of WPD adopts either an open, enzymatically inactive, or a closed, active conformation under different conditions. The Q loop forms crucial hydrogen bonds with the P loop to position and activate a water molecule for hydrolysis of the phosphoenzyme intermediate.14,15 The specific amino acids of interaction between PTP and PXA or PXB are shown in Table 2. Hydrophobic interactions were identified by Lig-plus software (Figure S3). The binding models of the two compounds to SHP1 and SHP2 are similar but different from those to PTP1B. Due to the almost identical structure of PXA and PXB, docking patterns between PXA and PXB show little difference (Figure 2).
Table 2. Detailed Hydrogen Bonds and Hydrophobic Interactions between PTP and PXA or PXB.
| PXA |
PXB |
||||
|---|---|---|---|---|---|
| compound | loop | H bond | hydrophobicity | H bond | hydrophobicity |
| SHP1 | pTyr | Y278 | Y278 | ||
| β5-β6 | K362 | K358, K362 | K358, K362 | ||
| WPD | D421, H422 | D421, H422, | |||
| PTP | S455, R461 | S455, R461 | S455, R461 | S455, R461 | |
| Q loop | Q506 | T503, Q502 | Q502 | Q502, Q506 | |
| SHP2 | pTyr | Y279, I282 | |||
| β5-β6 | K366 | R362, K366 | R362, K366 | R362, K366 | |
| WPD | G427 | D425 | G427 | D425 | |
| PTP | S460, G464 | A461,S460,I463,R465 | A461, R465 | A461,S460,I463,R465 | |
| Q loop | Q506, T507, Q510 | Q506, T507, Q510 | |||
| PTP1B | pTyr | R24, Y46 | R24, Y46, D48, V49 | R24, D48 | R24, Y46, D48, V49 |
| β5-β6 | K120 | ||||
| WPD | D181, P182 | P182 | |||
| PTP | I219 | I219 | |||
| Q loop | Q262 | Q262 | Q262 | R254, M258, Q262, | |
Hydrogen bonds were calculated by SYBYL-X. Hydrophobicity was identified by Lig-plus.
Figure 2.

Molecular docking between PTPs and PXA or PXB. Molecular docking between PTP1B (PDB: 4I8N), SHP1 (PDB: 1FPR), SHP2 (PDB: 4RDD), and PXA or PXB. Hydrogen bonds are highlighted with red dashed lines. Amino acids of protein are colored green.
PXA and PXB form hydrogen bonds with the Q loop (Q262) in PTP1B (Figure 2). R24 is in the proximity of the PTP active site involved in the recognition of PTP1B substrates. It is a non-conserved amino acid in PTP families.4 Both PXA and PXB interact with R24. Both compounds form hydrogen bonds with Y46 and D48, which are key amino acids in the PTP1B pTyr loop. PXA and PXB show hydrophobic interactions with the active site (P loop) of PTP1B. In the presence of PXA or PXB, the substrate p-nitrophenyl phosphate (pNPP) forms hydrogen bonds with the Q loop (Q262 and Q266), P loop (S216 and R221), and WPD loop (P182) (Figure 3), indicating that pNPP can still be accommodated by the active site of PTP1B. Molecular modeling suggested that these two compounds cannot prevent the substrate from entering the PTP1B active site, implying that PXA and PXB are noncompetitive PTP1B inhibitors.
Figure 3.

Molecular docking between PTPs and pNPP in the presence of PXA or PXB. PTPs: PTP1B (PDB: 4I8N), SHP1 (PDB: 1FPR), SHP2 (PDB: 4RDD). Hydrogen bonds are highlighted with red dashed lines. Amino acids of protein are colored green. The superposition was calculated with active site residues with PXA or PXB.
Shp2 has high sequence and domain homology to Shp1. The binding models of the two compounds with SHP1 and SHP2 were basically the same (Figure 2). These two compounds interact with the β5-β6 loop, WPD loop, P loop, and Q loop in both SHP1 and SHP2 (Table 2). Enzyme studies show that PXA and PXB are noncompetitive inhibitors of SHP2 but are competitive inhibitors of SHP1. Molecular modeling suggests that substrate pNPP can still enter the active site of SHP2 but cannot be accommodated in SHP1 in the presence of PXA or PXB (Figure 3). Our structural observation is consistent with these two compounds being noncompetitive inhibitors of SHP2 and competitive inhibitors of Shp1. The main difference of docking results between SHP1 and SHP2 lies in their interaction with conserved glutamine (Q) residues in the Q loop. PXA and PXB can form hydrogen bonds with the SHP1 Q loop but cannot form hydrogen bonds with the SHP2 Q loop (Table 2). The Q loop has two conserved glutamine (Q) residues.14 Glutamine in the Q loop has the ability to catalyze and recognize Tyr and interacts with the P loop.16,17 Based on docking results of SHP1, SHP2, and PTP1B, the substrate pNPP mainly forms hydrogen bonds with the Qloop and P loop in the presence of PXA or PXB. The interactions between the Q loop and PXA or PXB in SHP1 may block the entry of pNPP into the active site, which causes PXA or PXB to act as a competitive inhibitor of SHP1. Although these two compounds also form hydrogen bonds with the Q loop of PTP1B (Table 2), they cannot form hydrogen bonds with the P loop. This may be one reason why the substrate pNPP can enter the PTP1B active site in the presence of PXA or PXB. The above hypothesis needs more experiments to prove.
Previous studies demonstrated that the β5-β6 loop determines the substrate specificity of SHP1 and SHP2.18 The β5-β6 loop contains highly conserved glutamate and less conserved lysine residues (K366 in Shp2, K362 in Shp1).19 Our docking results showed that both PXB and PXA interact with less conserved lysine (K) residues (Table 2). This may be the reason why both compounds exhibit less selectivity for SHP2 over its close homolog SHP1. Owing to the high degree conservation in the PTP active pocket, many developed compounds showed lower selectivity for specific PTPs. Our results showed that the xanthone dimer is an important backbone to exhibit their PTP inhibitory activity. Keto hydroxyl groups and acetyl groups of PXA and PXB are important groups, which form hydrogen bonds with PTPs (Figure 1). By modifying these groups, selective PTP inhibitors may be obtained from the xanthone dimer.
PTP1B and SHP2 are upregulated in several different cancers. As mentioned above, these two compounds were reported to show cytotoxicity to tumor cells. We want to know whether the tumor-suppressive effect is caused by PTP inhibition. In our study, PXA and PXB suppressed the MCF7 cell proliferation with IC50 values of 16.36 ± 1.96 and 16.16 ± 2.59 μM at 24 h, respectively. We used 5-fluorouracil as the positive control, and its IC50 was 25.12 ± 8.80 μM in MCF7 cells at 24 h. The colony formation assay also confirmed the inhibitor activity. PXA and PXB significantly reduced the colony formation (Figure 4). Previous studies have demonstrated that SHP2 and PTP1B both promote growth factor-stimulated ERK1/2 activation.20,21 Loss of SHP2 and PTP1B inhibited ERK1/2 activation.22 Western blot results showed that PXA and PXB activated the ERK activation characterized with increased ERK phosphorylation (Figure 5A). These results indicated that both compounds did not efficiently inhibit PTP1B and SHP2 activity in MCF7 cells.
Figure 4.

PXB and PXA inhibit the colony formation of MCF7 cells. Up: representative images of the colony-forming assay at different concentrations (0, 0.15, 0.45, and 0.75 μM) of PXB or PXA. DMSO as vehicle control. Down: analysis of colony formation rates of MCF7 cells. Data are mean ± SD of three independent experiments. ***p < 0.001 vs control group.
Figure 5.
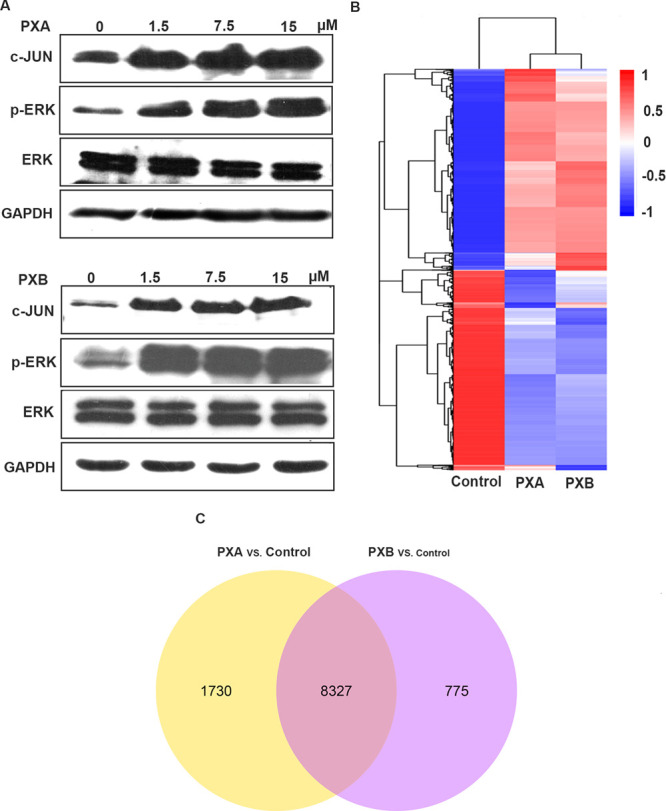
Western blotting analysis and RNA sequencing analysis of PXB- and PXA-treated MCF7 cells. (A) Western blotting analysis of PXB- and PXA-treated MCF7 cells. MCF7 cells were treated with 0, 1.5, 7.5, and 15 μM PXB or PXA for 24 h. c-JUN, p-ERK, and ERK proteins were detected by antibodies. GAPDH was used as an internal control. (B) Two-dimensional hierarchical clustering was performed based on differentially expressed genes. (C) Venn diagram showed the overlap between the treatments of PXA vs control and PXB vs control.
Previous reports showed that deficiency of SHP1 upregulated ERK activation in mast cells.23 Enzyme studies demonstrated that PXB and PXA show the inhibition toward SHP1. PXB and PXA may exhibit the inhibition ability to SHP1 in MCF7 cells leading to the ERK activation. SHP1 is widely accepted as a negative regulator of inflammation, antigen-dependent activation, and proliferation of T cells.24,25 Recent research found that it is a good target for cancer immunotherapy.5,26
To detect whether these two compounds could induce the expression of inflammatory genes by inhibiting the SHP1, we performed the RNA sequencing analysis. RNA sequencing results showed that PXB and PXA significantly increased gene expression of inflammatory genes, such as cytokines (IL1A, IL1B, IL6, IL18, IL32, and IL33), chemokines (CXCL2, CXCL3, CXCL8, and CXCL10), IFN-induced genes (IFI27, IRF7, IRF1, and IFI16), and inflammatory transcription factor genes (JUN, NFKB2, and RELB) (Table 3). Western blot results showed that both PXA and PXB upregulated the JUN protein expression, which confirmed the results detected by RNA sequencing (Figure 5A). Based on RNA sequencing results, we performed the KEGG enrichment analysis. KEGG pathway analysis showed that many pathways related to the inflammatory response, such as MAPK, RIG-like receptor (RLR), NOD-like receptor (NLR), TNF, and NF-κB signaling pathways, were significantly upregulated (Table 4). SHP1 was found to suppress JAK1/STAT3 and p38 signals in mesenchymal stromal cells.27 SHP1 inhibition enhanced MAPK activation and increased the production of IL-12, IL-1β, and IL-6 in response to LPS stimulation.28 Decreased SHP1 phosphorylation increased activation of NF-κB signaling.28,29 SHP1 could reduce RLR- and NLR-mediated inflammatory cytokine induction by suppressing NF-κB and MAPK activation.30 Based on previous work and our results, PXB and PXA may exhibit SHP1 inhibition activity in MCF7 cells, which results in upregulating MAPK, RIG-like receptor (RLR), NOD-like receptor (NLR), and NF-κB signaling pathways, leading to the increased expression of inflammatory genes. PXA was reported to activate immune cells such as murine T lymphocytes, NK cells, and macrophages, but the mechanism is unknown.11 Inhibition of SHP1 to increase the expression of inflammatory factors may be the reason for PXA-induced activation of immune cells. A previous report showed that SHP1 acts as a negative regulator of proliferation in breast cancers.31 However, our results demonstrated that these two compounds significantly inhibited the proliferation of MCF7 cells. The suppression of cell proliferation may not be due to SHP1 inhibition in MCF7 cells. RNA sequencing showed that both compounds could significantly upregulate the expression of the apoptosis and growth inhibition genes (IL24, XAF1, GADD45A, and DDIT3). PXA was also reported to be a mitochondrial toxin.12 These results implied that PXA and PXB may be multitarget compounds to inhibit the growth of tumor cells. Further investigations are required to evaluate the antitumor mechanisms of PXA and PXB.
Table 3. PXA or PXB Upregulated the Expression of Inflammation Factors, Chemokines, Transcription Factors, and Apoptosis-Related Genesa.
| PXA
vs control |
PXB
vs control |
|||
|---|---|---|---|---|
| gene name | log 2 fold change | p value | log 2 fold change | p value |
| IL1A | 4.78 | 0 | 4.87 | 2.7318 |
| IL1B | 3.30 | 3.06 × 10–47 | 3.23 | 6.62 × 10–44 |
| IL6 | 4.00 | 2.14 × 10–65 | 3.98 | 9.42 × 10–123 |
| IL18 | 1.78 | 1.34 × 10–82 | 1.73 | 1.03 × 10⁻³³ |
| IL32 | 1.57 | 3.81 × 10–107 | 1.56 | 1.55 × 10–80 |
| IL33 | 4.45 | 3.55 × 10⁻³⁴ | 4.82 | 1.12 × 10–46 |
| CXCL2 | 3.24 | 4.19 × 10–60 | 3.19 | 2.67 × 10–140 |
| CXCL3 | 1.65 | 1.82 × 10⁻²³ | 1.58 | 9.79 × 10⁻²¹ |
| CXCL8 | 5.45 | 4.52 × 10–107 | 5.22 | 1.27 × 10–61 |
| CXCL10 | 6.84 | 1.87 × 10⁻¹³ | 5.96 | 6.52 × 10⁻¹⁹ |
| IFI27 | 4.22 | 0 | 4.02 | 2.29 × 10–101 |
| IRF7 | 2.76 | 2.45 × 10–66 | 2.53 | 4.81 × 10–80 |
| IRF1 | 1.50 | 1.39 × 10–51 | 1.34 | 2.58 × 10–44 |
| IFI16 | 1.18 | 4.06 × 10–206 | 1.15 | 3.09 × 10–37 |
| JUN | 3.32 | 0 | 3.16 | 9.17 × 10–113 |
| NFKB2 | 1.62 | 0 | 1.69 | 4.64 × 10–118 |
| RELB | 2.43 | 2.35 × 10–195 | 2.51 | 2.67 × 10–168 |
| XAF1 | 4.83 | 6.84 × 10–06 | 4.41 | 2.02 × 10–06 |
| IL24 | 6.37 | 1.20 × 10⁻²⁸ | 7.08 | 9.06 × 10–112 |
| GADD45A | 1.41 | 2.82 × 10–93 | 1.39 | 1.09 × 10–91 |
| DDIT3 | 2.87 | 5.58 × 10–93 | 2.92 | 8.65 × 10–190 |
Each treatment has three repeats.
Table 4. KEGG Analysis of PXA or PXB vs Control.
| pathway | PXA vs control (p value) | PXB vs control (p value) |
|---|---|---|
| MAPK signaling pathway | 1.71 × 10–04 | 3.78 × 10–04 |
| NF-kappa B signaling pathway | 9.90 × 10–04 | 6.98 × 10–05 |
| chronic myeloid leukemia | 1.17 × 10–03 | 2.58 × 10–03 |
| NOD-like receptor signaling pathway | 1.88 × 10–04 | 1.20 × 10–04 |
| TNF signaling pathway | 8.56 × 10–03 | 8.45 × 10–04 |
| RIG-I-like receptor signaling pathway | 1.56 × 10–02 | 8.69 × 10–03 |
Each treatment has three repeats.
Two-dimensional hierarchical clustering showed that the gene expression of the cells treated with the two compounds changed dramatically compared with control treatment (Figure 5B). However, gene expression changes between the two compounds are similar to some extent. Venn diagrams of the differential expression showed that 8327 genes had the same change in both treatments, and some differentially expressed genes were unique to PXA or PXB treatment (Figure 5C). These results suggested that the antitumor mechanism of both compounds partially overlapped, and PXA and PXB may be multitarget drugs with unique antitumor mechanisms.
In conclusion, PXB and PXA are noncompetitive inhibitors of SHP2 and PTP1B, and competitive inhibitors of SHP1. PXA and PXB cannot efficiently inhibit PTP1B and SHP2 activity in MCF7 cells but inhibit SHP1 activity, leading to upregulation of inflammation factors and inflammation-related pathways. Both compounds show inhibition of cancer cells and upregulate the inflammatory factors, which make them promising for tumor immunotherapy.
Experimental Procedures
Materials
Phomoxanthone A and B (purity > 95%, Figures S1 and S2) were isolated from the endophytic fungus Phomopsis sp. By254.32 DMEM, 1640 medium, and fetal bovine serum were purchased from Gibco, USA. 3-(4,5-Dimethylthiazol-2-yl)-2,5-diphenyltetrazolium bromide (MTT) was purchased from Solarbio, Beijing, China. c-JUN, GAPDH, ERK1/2, and p-ERK antibodies were purchased from CST, MA, USA. Human cancer cells were purchased from the type culture collection of the Chinese Academy of Sciences (Shanghai, China) and cultured in DMEM medium or RPM160 medium supplemented with 10% FBS at 37 °C, under 95% air and 5% CO2.
PTP Cloning, Expression, and Purification
All expression vectors were reported in our previous report.33 In brief, a PCR-based strategy was used to amplify the sequence coding for the catalytic domain of PTP1B, SHP2, SHP1, STEP, and LYP. All full-length genes were from Han Lab, Xiamen University, China. The PCR products were ligated to the linearized pEASY-E1 vector by TA cloning techniques. The expression vectors were transformed into Escherichia coli BL21(DE3) (Novagen). The gene sequence was confirmed by DNA sequencing. A single colony of transformed E. coli cells was selected and placed in 5 mL of liquid LB medium tube containing 100 μg/mL ampicillin. The culture was shaken overnight at 250 rpm, 37 °C. Overnight cultured bacterial solution (2 mL) was added to 200 mL of LB medium for 4–6 h to an absorbance of 0.6 at 600 nm, and then 0.4 mM IPTG (Sigma, USA) was added to the culture overnight at 20 °C. Transformed E. coli cells were harvested and suspended in lysis buffer, (500 mM NaCl, 20 mM Tris–HCl, 0.2% Triton-100, and 1 mM DTT, 1% PMSF, pH 8.0). The purification of His-tagged recombinant proteins under native conditions was according to the QIAexpressionist method (Qiagen, Hilden, Germany). Purified recombinant proteins were dissolved in the buffer (300 mM NaCl, 250 mM imidazole, 50 mM NaH2PO4,1 mM dithiothreitol plus 5% glycerol) and stored at −80 °C.
PTP Activity Assay
The phosphatase activity of recombinant PTP proteins was detected using the p-nitrophenyl phosphate (pNPP) assay. The reaction buffer (10 mM NaAc-HAc, 1 mM ethylenediaminetetraacetic acid, 1 mM dithiothreitol, pH 5.5) and 0.1 vol % PXA or PXB or dimethylsulfoxide were added in a 96-well plate with a final volume of 100 μL at 37 °C, and then different amounts of PTP proteins were added to each well. All reactions were shaken for 5 s in a microplate reader (Thermo Scientific, USA). The absorbance value at 405 nm was measured once every 20 s immediately for 30 min.
Colony Formation Assay
The exponential phase of MCF7 cells were seeded in 5 cm cell culture plates at low density. The next day after the cell adhered to the plates, different amounts of PXA and PXB were added. DMSO was used as the vehicle control. The plates were cultured for 6 days, then washed with PBS and fixed with anhydrous methanol, and then stained with crystal violet. Each plate was photographed and analyzed.
Molecular Docking
Molecular docking was performed using software SYBYL-X 2.1.1 (Tripos, St. Louis, MO, United States) using the X-ray crystal structure of human Shp2 (PDB ID: 4RDD), Shp1 (PDB ID: 1FPR), and PTP1B (PDB ID: 4I8N). To prepare the docking proteins, addition of H atoms and removal of co-crystallized water molecules were performed. The prepared structure was further analyzed with the Docking suite. The surflex-dock scoring was used to evaluate the docking interaction. The scoring function of surflex-dock was based on many factors, such as hydrophobicity, polarity, repulsion, entropy, and solvation. PXA and PXB were docked into the binding pocket of PTP Shp2 (PDB ID: 4RDD), Shp1 (PDB ID: 1FPR), and PTP1B (PDB ID: 4I8N). All hydrogen bonds were identified by docking results. All hydrophobic functions were identified by LIGPLOT software.34
MTT Assay
Cells were seeded in 96-well plates and treated with various amounts of PXA or PXB. DMSO was used as the vehicle control. After 24 h of drug treatment, 20 μL of MTT solution (5 mg/mL) was added and incubated in a carbon dioxide incubator for 4 h, and then 100 μL of SDS-HCL was added into each hole overnight. Absorbance at 570 nm was detected using a microplate reader (Thermo Scientific, USA), and the IC50 was calculated according to the microplate reader’s instructions.
RNA Sequencing Assay
The RNA-Seq experiments were performed by Novogene (Beijing, China). There were three groups (PXA, PXB and control group) in total, and each group contained three repeats. Sequencing libraries were constructed using the NEBNext Ultra RNA library prep kit for Illumina (NEB, USA) according to the manufacturer’s recommendations. The clustering of the index-coded samples was performed on a cBot cluster generation system using TruSeq PE Cluster kit v3-cBot-HS (Illumia) according to the manufacturer’s instructions. After cluster generation, the samples were sequenced on an Illumina Hiseq platform. The Deseq-R software package (1.18.0) was used to analyze the difference expression between the two groups. Cuffdiff was used to identify the transcripts with different expression, using the following cutoff criteria: (1) log 2 fold change >1 or <1; (2) Q value error detection rate < 0.05; (3) the number of exon kilobase segments per million segments (FPKM) value >1. KOBAS software was used to test the statistical enrichment of differential expression genes in KEGG enrichment.
Statistics
Data presented are mean values ± SD based on triplicate assays. The multiple group comparisons were assessed using a one-way ANOVA analysis of variance followed by Tukey’s post hoc test. p < 0.05 indicated a statistically significant difference.
Acknowledgments
The authors thank Prof. Jia-huai Han for providing protein tyrosine phosphatase genes.
Supporting Information Available
The Supporting Information is available free of charge at https://pubs.acs.org/doi/10.1021/acsomega.0c03315.
13C-NMR and 1H-NMR spectrum of phomoxanthone A and phomoxanthone B and Ligplot image of interaction between PXB or PXA and PTPs (PDF)
Author Contributions
D.Q.L. and C.C. designed the experiments and supervised the work; R.L.Y., H.B.X., and Q.D. designed and performed experiments; Q.D., X.H.G., and Z.Y.Z. performed purification and analysis of enzyme; R.L.Y. and C.C. analyzed the data and performed molecular docking; C.C., D.Q.L., and R.L.Y wrote and revised the paper; J.C.Q prepared the compounds. All authors reviewed the manuscript and approved the final manuscript.
This work was funded by National Natural Science Foundation of China [31672070], the National Key Research and Development Program of China [grant numbers 2017YFD0201400 and 2017YFD0201401], and the Changjiang Scholars and Innovative Research Team in University [grant number IRT_15R16]. Talent training plan of Hebei University [grant number 521000981185].
The authors declare no competing financial interest.
Supplementary Material
References
- Hale A. J.; ter Steege E.; den Hertog J. Recent Advances in Understanding the Role of Protein-Tyrosine Phosphatases in Development and Disease. Dev. Biol. 2017, 428, 283–292. 10.1016/j.ydbio.2017.03.023. [DOI] [PubMed] [Google Scholar]
- Ventura J. J.; Nebreda Á. R. Protein Kinases and Phosphatases as Therapeutic Targets in Cancer. Clin. Transl. Oncol. 2006, 8, 153–160. 10.1007/s12094-006-0005-0. [DOI] [PubMed] [Google Scholar]
- Zhang Z. Y. Drugging the Undruggable: Therapeutic Potential of Targeting Protein Tyrosine Phosphatases. Acc. Chem. Res. 2017, 50, 122–129. 10.1021/acs.accounts.6b00537. [DOI] [PMC free article] [PubMed] [Google Scholar]
- Sharma B.; Xie L.; Yang F.; Wang W.; Zhou Q.; Xiang M.; Zhou S.; Lv W.; Jia Y.; Pokhrel L.; Shen J.; Xiao Q.; Gao L.; Deng W. Recent Advance on PTP1B Inhibitors and Their Biomedical Applications. Eur. J. Med. Chem. 2020, 199, 112376. 10.1016/j.ejmech.2020.112376. [DOI] [PubMed] [Google Scholar]
- Watson H. A.; Wehenkel S.; Matthews J.; Ager A. SHP-1: The next Checkpoint Target for Cancer Immunotherapy?. Biochem. Soc. Trans. 2016, 44, 356–362. 10.1042/BST20150251. [DOI] [PMC free article] [PubMed] [Google Scholar]
- Shen D.; Chen W.; Zhu J.; Wu G.; Shen R.; Xi M.; Sun H. Therapeutic Potential of Targeting SHP2 in Human Developmental Disorders and Cancers. Eur. J. Med. Chem. 2020, 190, 112117. 10.1016/j.ejmech.2020.112117. [DOI] [PubMed] [Google Scholar]
- Klein-Júnior L. C.; Campos A.; Niero R.; Corréa R.; Vander Heyden Y.; Filho V. C. Xanthones and Cancer: From Natural Sources to Mechanisms of Action. Chem. Biodiversity 2020, 17, e1900499 10.1002/cbdv.201900499. [DOI] [PubMed] [Google Scholar]
- Isaka M.; Jaturapat A.; Rukseree K.; Danwisetkanjana K.; Tanticharoen M.; Thebtaranonth Y. Phomoxanthones A and B, Novel Xanthone Dimers from the Endophytic Fungus Phomopsis Species. J. Nat. Prod. 2001, 64, 1015–1018. 10.1021/np010006h. [DOI] [PubMed] [Google Scholar]
- Frank M.; Niemann H.; Böhler P.; Stork B.; Wesselborg S.; Lin W.; Proksch P. Phomoxanthone A - From Mangrove Forests to Anticancer Therapy. Curr. Med. Chem. 2015, 22, 3523–3532. 10.2174/0929867322666150716115300. [DOI] [PubMed] [Google Scholar]
- Pavão G. B.; Venâncio V. P.; de Oliveira A. L. L.; Hernandes L. C.; Almeida M. R.; Antunes L. M. G.; Debonsi H. M. Differential Genotoxicity and Cytotoxicity of Phomoxanthone A Isolated from the Fungus Phomopsis Longicolla in HL60 Cells and Peripheral Blood Lymphocytes. Toxicol. Vitr. 2016, 37, 211–217. 10.1016/j.tiv.2016.08.010. [DOI] [PubMed] [Google Scholar]
- Rönsberg D.; Debbab A.; Mándi A.; Vasylyeva V.; Böhler P.; Stork B.; Engelke L.; Hamacher A.; Sawadogo R.; Diederich M.; Wray V.; Lin W.; Kassack M. U.; Janiak C.; Scheu S.; Wesselborg S.; Kurtán T.; Aly A. H.; Proksch P. Pro-Apoptotic and Immunostimulatory Tetrahydroxanthone Dimers from the Endophytic Fungus Phomopsis Longicolla. J. Org. Chem. 2013, 78, 12409–12425. 10.1021/jo402066b. [DOI] [PubMed] [Google Scholar]
- Wang C.; Engelke L.; Bickel D.; Hamacher A.; Frank M.; Proksch P.; Gohlke H.; Kassack M. U. The Tetrahydroxanthone-Dimer Phomoxanthone A Is a Strong Inducer of Apoptosis in Cisplatin-Resistant Solid Cancer Cells. Bioorganic Med. Chem. 2019, 27, 115044. 10.1016/j.bmc.2019.115044. [DOI] [PubMed] [Google Scholar]
- Böhler P.; Stuhldreier F.; Anand R.; Kondadi A. K.; Schlütermann D.; Berleth N.; Deitersen J.; Wallot-Hieke N.; Wu W.; Frank M.; Niemann H.; Wesbuer E.; Barbian A.; Luyten T.; Parys J. B.; Weidtkamp-Peters S.; Borchardt A.; Reichert A. S.; Peña-Blanco A.; García-Sáez A. J.; Itskanov S.; Van Der Bliek A. M.; Proksch P.; Wesselborg S.; Stork B. The Mycotoxin Phomoxanthone A Disturbs the Form and Function of the Inner Mitochondrial Membrane. Cell Death Dis. 2018, 9, 286. 10.1038/s41419-018-0312-8. [DOI] [PMC free article] [PubMed] [Google Scholar]
- Andersen J. N.; Mortensen O. H.; Peters G. H.; Drake P. G.; Iversen L. F.; Olsen O. H.; Jansen P. G.; Andersen H. S.; Tonks N. K.; Møller N. P. H. Structural and Evolutionary Relationships among Protein Tyrosine Phosphatase Domains. Mol. Cell. Biol. 2001, 21, 7117–7136. 10.1128/MCB.21.21.7117-7136.2001. [DOI] [PMC free article] [PubMed] [Google Scholar]
- Reddy R. H.; Kim H.; Cha S.; Lee B.; Kim Y. J. Structure-Based Virtual Screening of Protein Tyrosine Phosphatase Inhibitors: Significance, Challenges, and Solutions. J. Microbiol. Biotechnol. 2017, 27, 878–895. 10.4014/jmb.1701.01079. [DOI] [PubMed] [Google Scholar]
- Brandão T. A. S.; Hengge A. C.; Johnson S. J. Insights into the Reaction of Protein-Tyrosine Phosphatase 1B: Crystal Structures for Transition State Analogs of Both Catalytic Steps. J. Biol. Chem. 2010, 285, 15874–15883. 10.1074/jbc.M109.066951. [DOI] [PMC free article] [PubMed] [Google Scholar]
- Chen X.; Gan Q.; Feng C.; Liu X.; Zhang Q. Investigation of Selective Binding of Inhibitors to PTP1B and TCPTP by Accelerated Molecular Dynamics Simulations. J. Biomol. Struct. Dyn. 2019, 37, 3697–3706. 10.1080/07391102.2018.1526117. [DOI] [PubMed] [Google Scholar]
- Zhang X.; He Y.; Liu S.; Yu Z.; Jiang Z.-X.; Yang Z.; Dong Y.; Nabinger S. C.; Wu L.; Gunawan A. M.; Wang L.; Chan R. J.; Zhang Z.-Y. A Salicylic Acid-Based Small Molecule Inhibitor for the Oncogenic Src Homology-2 Domain Containing Protein Tyrosine Phosphatase-2 (SHP2). J. Med. Chem 2010, 53, 2482–2493. 10.1021/jm901645u. [DOI] [PMC free article] [PubMed] [Google Scholar]
- Critton D. A.; Tautz L.; Page R. Visualizing Active-Site Dynamics in Single Crystals of HePTP: Opening of the WPD Loop Involves Coordinated Movement of the e Loop. J. Mol. Biol. 2011, 405, 619–629. 10.1016/j.jmb.2010.11.020. [DOI] [PMC free article] [PubMed] [Google Scholar]
- Blanquart C.; Karouri S. E.; Issad T. Implication of Protein Tyrosine Phosphatase 1B in MCF-7 Cell Proliferation and Resistance to 4-OH Tamoxifen. Biochem. Biophys. Res. Commun. 2009, 387, 748–753. 10.1016/j.bbrc.2009.07.105. [DOI] [PubMed] [Google Scholar]
- Dubé N.; Cheng A.; Tremblay M. L. The Role of Protein Tyrosine Phosphatase 1B in Ras Signaling. Proc. Natl. Acad. Sci. U. S. A. 2004, 101, 1834–1839. 10.1073/pnas.0304242101. [DOI] [PMC free article] [PubMed] [Google Scholar]
- Liu H.; Wu Y.; Zhu S.; Liang W.; Wang Z.; Wang Y.; Lv T.; Yao Y.; Yuan D.; Song Y. PTP1B Promotes Cell Proliferation and Metastasis through Activating Src and ERK1/2 in Non-Small Cell Lung Cancer. Cancer Lett. 2015, 359, 218–225. 10.1016/j.canlet.2015.01.020. [DOI] [PubMed] [Google Scholar]
- Nakata K.; Suzuki Y.; Inoue T.; Ra C.; Yakura H.; Mizuno K. Deficiency of SHP1 Leads to Sustained and Increased ERK Activation in Mast Cells, Thereby Inhibiting IL-3-Dependent Proliferation and Cell Death. Mol. Immunol. 2011, 48, 472–480. 10.1016/j.molimm.2010.10.001. [DOI] [PubMed] [Google Scholar]
- Wen L. Z.; Ding K.; Wang Z. R.; Ding C. H.; Lei S. J.; Liu J. P.; Yin C.; Hu P. F.; Ding J.; Chen W. S.; Zhang X.; Xie W. F. SHP-1 Acts as a Tumor Suppressor in Hepatocarcinogenesis and HCC Progression. Cancer Res. 2018, 78, 4680–4691. 10.1158/0008-5472.CAN-17-3896. [DOI] [PubMed] [Google Scholar]
- An H.; Hou J.; Zhou J.; Zhao W.; Xu H.; Zheng Y.; Yu Y.; Liu S.; Cao X. Phosphatase SHP-1 Promotes TLR- and RIG-I-Activated Production of Type I Interferon by Inhibiting the Kinase IRAK1. Nat. Immunol. 2008, 9, 542–550. 10.1038/ni.1604. [DOI] [PubMed] [Google Scholar]
- Sitaram P.; Uyemura B.; Malarkannan S.; Riese M. J. Beyond the Cell Surface: Targeting Intracellular Negative Regulators to Enhance t Cell Anti-Tumor Activity. Int. J. Mol. Sci. 2019, 20, 5821. 10.3390/ijms20235821. [DOI] [PMC free article] [PubMed] [Google Scholar]
- Jiang M.; Ye J.; Wang X.; Li N.; Wang Y.; Shi Y. Phosphatase SHP1 Impedes Mesenchymal Stromal Cell Immunosuppressive Capacity Modulated by JAK1/STAT3 and P38 Signals. Cell Biosci. 2020, 10, 65. 10.1186/s13578-020-00428-w. [DOI] [PMC free article] [PubMed] [Google Scholar]
- Abram C. L.; Lowell C. A. Shp1 Function in Myeloid Cells. J. Leukocyte Biol. 2017, 102, 657–675. 10.1189/jlb.2MR0317-105R. [DOI] [PMC free article] [PubMed] [Google Scholar]
- Jiang Z.; Qin J. J.; Zhang Y.; Cheng W. L.; Ji Y. X.; Gong F. H.; Zhu X. Y.; Zhang Y.; She Z. G.; Huang Z.; Li H. LILRB4 Deficiency Aggravates the Development of Atherosclerosis and Plaque Instability by Increasing the Macrophage Inflammatory Response via NF-ΚB Signaling. Clin. Sci. 2017, 131, 2275–2288. 10.1042/CS20170198. [DOI] [PubMed] [Google Scholar]
- Kawai T.; Akira S. The Roles of TLRs, RLRs and NLRs in Pathogen Recognition. Int. Immunol. 2009, 21, 317–337. 10.1093/intimm/dxp017. [DOI] [PMC free article] [PubMed] [Google Scholar]
- Amin S.; Kumar A.; Nilchi L.; Wright K.; Kozlowski M. Breast Cancer Cells Proliferation Is Regulated by Tyrosine Phosphatase SHP1 through C-Jun N-Terminal Kinase and Cooperative Induction of RFX-1 and AP-4 Transcription Factors. Mol. Cancer Res. 2011, 9, 1112–1125. 10.1158/1541-7786.MCR-11-0097. [DOI] [PubMed] [Google Scholar]
- Gao D.; Guo Z.; Wang J.; Hu G.; Su Y.; Chen L.; Lv Q.; Yu H.; Qin J.; Xu W. Dicerandrol B: A Natural Xanthone Dimer Induces Apoptosis in Cervical Cancer Hela Cells through the Endoplasmic Reticulum Stress and Mitochondrial Damage. Onco. Targets. Ther. 2019, Volume 12, 1185–1193. 10.2147/OTT.S191204. [DOI] [PMC free article] [PubMed] [Google Scholar]
- Chen C.; Liang F.; Chen B.; Sun Z.; Xue T.; Yang R.; Luo D. Identification of Demethylincisterol A3 as a Selective Inhibitor of Protein Tyrosine Phosphatase Shp2. Eur. J. Pharmacol. 2017, 795, 124–133. 10.1016/j.ejphar.2016.12.012. [DOI] [PubMed] [Google Scholar]
- Wallace A. C.; Laskowski R. A.; Thornton J. M. Ligplot: A Program to Generate Schematic Diagrams of Protein-Ligand Interactions. Protein Eng., Des. Sel. 1995, 8, 127–134. 10.1093/protein/8.2.127. [DOI] [PubMed] [Google Scholar]
Associated Data
This section collects any data citations, data availability statements, or supplementary materials included in this article.