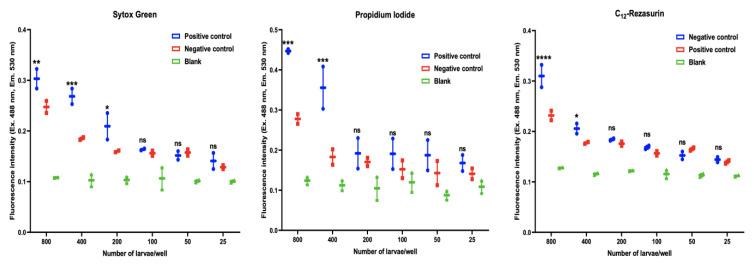
Figure 4.
Fluorescence intensity of serially diluted dead-live L3s based on Sytox green, propidium iodide and C12-resazurin staining. Positive control (treated with 50% methanol), negative control (live L3s) and blank (L3s-free). Results are expressed as the mean of intensity ± SEM (* p < 0.05; ** p < 0.01; *** p < 0.001; **** p < 0.0001 compared to control groups; ns = non-significant).

