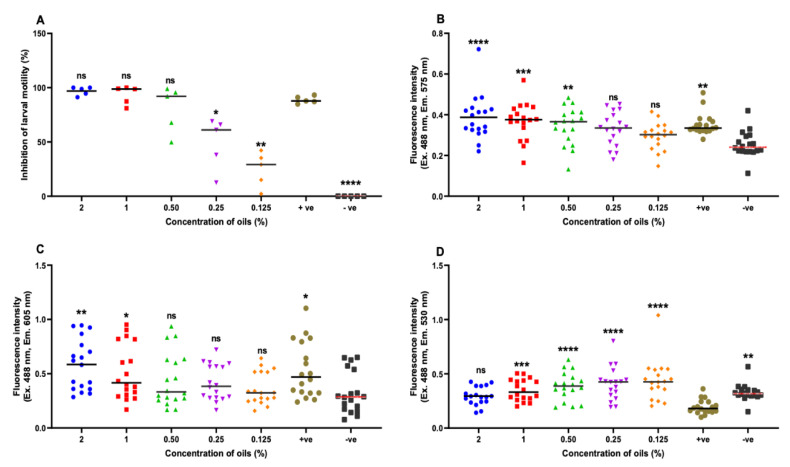
Figure 5.
Comparative performance of fluorescent stains versus larval motility assay. (A) Percentage of inhibition of motility of L3s of mixed GINs. L3s were treated with coriander oil-linalool combination at the five indicated concentrations. Positive control (L3s treated with 20 mg/mL levamisole) and negative control (L3s in PBS-Tween 2%). (B–D) Fluorescence intensity of L3s of mixed GINs stained with (B) Sytox green, (C) PI, and (D) C12-resazurin, respectively. Positive control (L3s treated with 50% methanol), negative control (live L3s) and blank (without L3s). Results are expressed as the mean ± SEM (* p < 0.05; ** p < 0.01; *** p <0.001; **** p < 0.0001 compared to control groups). ns = non-significant); +ve = positive control; –ve = negative control.

