

Abstract
Neuronal activation induces rapid transcription of immediate early genes (IEGs) and longer-term chromatin remodeling around secondary response genes (SRGs). Here, we use high-resolution chromosome-conformation-capture carbon-copy sequencing (5C-seq) to elucidate the extent to which long-range chromatin loops are altered during short- and long-term changes in neural activity. We find that more than 10% of loops surrounding select IEGs, SRGs, and synaptic genes are induced de novo during cortical neuron activation. IEGs Fos and Arc connect to activity-dependent enhancers via singular short-range loops that form within 20 min after stimulation, prior to peak messenger RNA levels. By contrast, the SRG Bdnf engages in both pre-existing and activity-inducible loops that form within 1–6 h. We also show that common single-nucleotide variants that are associated with autism and schizophrenia are colocalized with distinct classes of activity-dependent, looped enhancers. Our data link architectural complexity to transcriptional kinetics and reveal the rapid timescale by which higher-order chromatin architecture reconfigures during neuronal stimulation.
Neurons have the remarkable ability to receive, transmit, and store information via a dynamic synaptic network. Experience-dependent neuronal activity regulates synaptic features such as dendritic outgrowth, maturation, elimination, and synaptic plasticity1. Neural activity governs synaptic structure and function via the upregulation of hundreds of activity response genes2. IEGs such as Fos (also known as c-fos)3–5 and Arc (also known as Arg3.1) (refs. 6,7) are expressed within minutes after neuronal stimulation in a protein synthesis-independent manner, whereas SRGs are induced on the order of hours and require de novo protein synthesis8,9. Enhancers—for example, synaptic activity responsive elements—have been identified using epigenetic signatures characteristic of noncoding regulatory activity and verified using reporter transgenes10–14. However, the precise genomic elements that are functionally linked to temporal expression patterns of each specific IEG and SRG remain elusive, in part because synaptic activity responsive elements are distributed across the genome in introns and noncoding regions and their specific target genes are generally unknown.
Chromosome conformation capture (3C) techniques have been used recently to demonstrate that the mammalian genome folds into a hierarchy of structurally and functionally distinct architectural features, including chromosome territories15, A and B compartments16,17, topologically associating domains (TADs)18–20, nested subTADs17,21, and long-range looping interactions17. The highest resolution maps so far have enabled detection of tens of thousands of loops genome-wide across multiple mammalian cell types17,22. However, little is known about three-dimensional (3D) genome dynamics during paradigms of synaptic plasticity, partly owing to the paucity of high-resolution architecture maps at key time points during neural circuit activation. Knockout of CCCTC-binding factor (CTCF), the primary architectural protein responsible for connecting loops, results in intellectual disability23,24 and severe synaptic and long-term potentiation defects in vivo25. Moreover, a recent study demonstrated that in vivo cohesin knockout in granule neurons disrupts the tactile startle response, which suggests that specific loops that are connected by cohesin may be required for learning26. Given the clear importance of chromatin architecture in brain function, there is a great need for studies that investigate how activity-dependent enhancers are temporally connected via long-range loops to regulate gene expression during a wide range of neuronal activity paradigms.
Here, we investigate the extent to which loops are altered during short- and long-term changes in neural activity, and to analyze the dynamic interplay between the 3D genome and the linear epigenome during the activity-dependent transcriptional response. We create high-resolution genome folding maps across more than 12 megabases (Mb) around Arc, Bdnf, Fos, Nrxn1, Syt1, and Nlgn3 using 5C-seq27,28 and a double alternating primer design29. The 5C-seq approach enables us to create high-complexity, fine-scale architecture maps to explore genome folding dynamics without bias toward a particular chromatin feature across seven acute or chronic time points of neural activity inhibition and activation. We demonstrate that activity-inducible enhancers engage in either pre-existing or de novo loops connected to genes that exhibit 1.3- and 24-fold activity-dependent increases in expression, respectively. We observe that IEGs Fos and Arc connect to activity-dependent enhancers via singular short-range loops that form within 20 min after stimulation, whereas the SRG Bdnf engages in both pre-existing and activity-inducible loops that form within 1–6 h. Genome-wide analyses confirm a model in which IEGs form fewer, shorter loops before maximum mRNA levels are reached, than the slower, more complex looping architectures formed by SRGs. We also identify a subclass of pre-existing loops that are anchored by enhancers decommissioned upon chronic, 24 h of neural activation. Unexpectedly, we find that common single-nucleotide variants (SNVs) linked to schizophrenia colocalize preferentially at genomic anchors of pre-existing loops connecting activity-decommissioned enhancers to activity-downregulated genes. By contrast, autism-associated SNVs preferentially colocalize with loop anchors that connect activity-inducible enhancers to upregulated genes. Together, our data link 3D genome architectural complexity to transcriptional kinetics and uncover distinct architectural motifs associated with neuropsychiatric disorders.
Results
3D genome maps of dynamic loops during cortical neuron inhibition and activation.
We first created high-resolution maps of higher-order chromatin architecture after 24 h of pharmacologically induced low or high activity in primary neurons. We used an established in vitro model system in which murine cortical neurons were cultured for 15 d in vitro and then treated for 24 h with either 10 μM bicuculline (Bic)30, which increases neuronal firing by blocking GABA (γ-amino butyric acid)-mediated inhibition, or 1 μM tetrodotoxin (TTX)31, a sodium channel blocker that inhibits neuronal firing (Fig. 1a and Extended Data Fig. 1a–c). Chronic pharmacological induction of activity results in multiple forms of synaptic plasticity, including homeostatic changes in AMPA-type glutamate neurotransmitter receptor levels at synapses32. Our model system enabled us to interrogate the transcriptional, epigenomic, and architectural features of the mammalian genome in non-dividing, terminally differentiated cortical neurons across inactive (TTX-mediated activity inhibition), moderately active (Untreated), and highly active (Bic-mediated increased activity) states.
Fig. 1 |. Identification of dynamic and invariant looping interactions across neuronal activity states.

a, Primary cultured cortical neuron preparation used to interrogate 3D genome changes during low, basal or high neuronal activity states. b, RNA-seq data in Bic and TTX conditions with selected genes highlighted by colored dots. c, Interaction frequency heatmaps of 1–3-Mb regions surrounding Bdnf and Syt1 genes (labeled in green) across ES cells, NPCs, and cortical neurons (data analyzed from ref. 33). d, Interaction frequency heatmaps of the regions presented in c across TTX-treated, untreated, and Bic-treated DIV16 cortical neurons. e, Scatterplot of the interaction scores of thresholded pixels in TTX and Bic conditions. f, Activity-inhibited (TTX-only), activity-induced (Bic-only), and activity-invariant (constitutive) loops after thresholding (Supplementary Methods). g, Background-corrected contact frequencies across the TTX, Untreated and Bic conditions for each looping class overlaid on kernel density estimate violin plots. n= 340 activity-induced interaction pixels, 7,992 constitutive interaction pixels and 81 activity-decommissioned interaction pixels as represented in e. h, Interaction score heatmaps and thresholded loops demonstrating activity-induced (Bic-only) loops created by Fos (top) and the Syt1 TSS (bottom).
We used 5C-seq and a double alternating primer design29 to create high-resolution maps of genome folding in 12.2 Mb surrounding the IEGs Arc and Fos, the SRG Bdnf, the synaptic scaffold genes Nrxn1 and Nlgn3, and the synaptic vesicle gene Syt1 for a total of 157 unique transcripts (Fig. 1, Extended Data Fig. 1d,e, and Supplementary Table 1). Our genome-wide RNA-seq data confirmed that Arc, Fos, and Bdnf were upregulated approximately 10- to 100-fold in Bic versus TTX conditions, whereas Nrxn1, Nlgn3, and Syt1 were unchanged (Fig. 1b and Supplementary Tables 2–4). As expected, under the Untreated (basal activity) condition we observed an intermediate level of Arc, Fos, and Bdnf expression between Bic (high activity) and TTX (inactive) conditions (Extended Data Fig. 1b,c). To confirm data quality, we compared the highest resolution Hi-C maps published so far in mouse embryonic stem (ES) cells, neural progenitor cells (NPCs), and in vitro differentiated cortical neurons33 (Fig. 1c, Extended Data Fig. 1d, and Supplementary Table 5) to our 5C maps (Fig. 1d, Extended Data Fig. 1e, and Extended Data Fig. 2). 5C maps from our mature primary cortical neurons were highly correlated with and exhibited similar loops as published Hi-C maps from ES cell-derived cortical neurons (Extended Data Fig. 2c–e). We confirmed high reproducibility of loops across four 5C replicates taken across two independent batches of neuronal cultures (Supplementary Table 6, Extended Data Fig. 3a,b, and Extended Data Fig. 4). Thus, we have created high-complexity, ultra-high-resolution maps of genome folding across three neuronal activity states.
We next set out to quantify the extent to which loops are altered across different activity states. We normalized the intrinsic biases in 5C data, binned maps to 4-kb matrix resolution, and applied our previously published modeling approaches to identify loops with statistically significant interaction frequency above the local distance-dependence and TAD or subTAD background27,28,34 (Extended Data Fig. 5a and Supplementary Methods). We formulated a statistical method, 3DeFDR (ref. 35), to stratify loops into invariant and activity-state-specific classes by using differences in interaction frequency across inactive and highly active neurons as thresholds (Fig. 1e, Supplementary Table 6, and Supplementary Methods), resulting in the sensitive detection of 215 activity-invariant, 29 activity-induced, and 9 activity-decommissioned loops within the 12.2 Mb of the genome queried (Fig. 1f and Extended Data Fig. 5b). We observed that activity-invariant loops exhibited high interaction frequencies across Untreated, TTX, and Bic conditions (Fig. 1g). Importantly, activity-induced and activity-decommissioned loops showed two- to threefold upregulations or downregulations of interaction frequency, respectively, but were still lower in overall looping strength than the activity-invariant contacts (Fig. 1g). We confirmed that an enhancer–promoter loop that has been reported previously as activity-dependent at Fos via 3C-PCR (ref. 36) was classified here as an activity-induced loop (Fig. 1h, top) and that additional activity-induced loops occurred across our 5C regions (Fig. 1h, bottom). These data highlight that both activity-invariant and activity-dynamic loops encompass IEGs, SRGs, and synaptic genes.
Activity-dependent levels of gene expression are predicted by looping and enhancer acetylation.
We quantified the relationship between activity-dependent changes in loop strength, enhancer acetylation, and gene expression. As the histone mark H3 lysine 27 acetylation (H3K27ac) correlates with enhancer and promoter activity, we conducted chromatin immunoprecipitation followed by sequencing (ChIP–seq) of H3K27ac to identify changes in putative noncoding enhancer elements genome-wide in neural activity states (Supplementary Methods and Supplementary Tables 7–10). We noticed a strong correlation between activity-dependent changes in promoter H3K27ac signal and gene expression (Fig. 2a), whereas the total sum interaction frequency made by each gene showed no correlation with gene expression (Fig. 2b). Instead of total interaction frequency, we next used only bona fide thresholded loops (Fig. 1f). We applied an adapted activity-by-contact (ABC) model37 to identify the single loop or enhancer for each gene that displayed the maximum value of loop strength × enhancer H3K27ac signal (Fig. 2c and Supplementary Methods). Importantly, at this subset of loops we observed a strong increase in interaction strength at the most strongly activity-upregulated genes (Fig. 2d), as well as a consistent increase in H3K27ac signal at enhancers that connected through these loops to activity-upregulated genes (Fig. 2e). These data indicate that the signal strength of epigenetic marks at distal regulatory elements and the interaction frequency of their long-range loops correlate with activity-dependent gene expression.
Fig. 2 |. Activity-induced enhancers connected to distal target genes via looping interactions predict activity-stimulated expression.

a,b, Boxplots of the fold changes in promoter acetylation (a) and total interaction frequency (b) of genes grouped by fold change in expression. n= 69 independent genes. c, Schematic representation of the algorithm used to pair each gene with a single loop or enhancer that offered the highest predictive value. Only genes that formed such a loop (n= 45) were queried in the following models. obs/exp, observed/expected. d,e, Boxplots of the loop strength (d) and looped enhancer acetylation (e) after loops and enhancers are matched to genes using the schema presented in c. Boxes in a–e show the range from lower to upper quartiles, with the median line; whiskers extend to minimum and maximum data points within 1.5 times the interquartile range. f,g, Cartoon representations and scatterplots of the two ‘null’ models of the fold change in Bic-over-TTX (Bic/TTX) gene expression: promoter acetylation alone (model 1, f), promoter acetylation plus the acetylation of the nearest enhancer within 200 kb of the TSS (model 2, g). Fold change in expression is plotted on the y axis, and the fold change in acetylation (of the promoter (f) and nearest enhancer (g) are plotted on the x axes. The fold change in expression in g has been adjusted to remove the values predicted by the promoter activity term in the model. Values have been min–max scaled to allow cross-model comparison. h–j, Cartoon representations and scatterplots of loop-containing models, plotted in the same manner as in g. In f–j, n represents the number of genes analyzed, the best fit line is shown in red, 95% confidence intervals are shown in gray. k, R2 values for each of the three models. l, Barplot of explanatory variable coefficients from models 1–5. enh, enhancer. *P < 0.05, **P < 0.005 (two-tailed Student’s t-test); error bars represent standard error of parameter elements.
Classic examples of activity-dependent enhancers, such as those for Fos and Arc10,11,36, are relatively close (≤40 kb) to the promoters of these genes, but in many cases the nearest enhancers are insufficient to explain transcriptional regulation. We constructed multivariate linear models of activity-dependent gene expression (Supplementary Methods). Promoter H3K27ac alone explained 51.7% of the variance in gene expression after neuronal activation in our 5C regions (Fig. 2f,k–l). By adding the covariate of the H3K27ac signal at the nearest enhancer, we only marginally increased the performance of the model (Fig. 2g,k–l). We then built a third model with covariates of activity-dependent H3K27ac at (i) promoters and (ii) only distal enhancers engaged in maximum ABC-thresholded loops with their target genes (Fig. 2c and Supplementary Methods). Our third, ‘long-range enhancer’ model markedly increased the variance of activity-dependent expression explained (Fig. 2h,k–l). Surprisingly, models that used loop strength (Fig. 2i) or the ABC value (loop strength × enhancer H3K27ac) between the selected enhancer and promoter (Fig. 2j) as covariates correlated similarly well with gene expression changes (Fig. 2i–l). These trends remained consistent when we analyzed the promoter and nearest enhancer models for genes that only form long-range loops (Extended Data Fig. 6a–e).Together, these data indicate that long-range enhancers and loop strength can provide significant improvement in the prediction of activity-dependent expression compared to proximal, nearby enhancers.
Unique architectural motifs connect activity-dependent genes and enhancers.
We next examined the extent to which looping reconfiguration occurred in parallel with activity-dependent enhancer changes or whether enhancers were pre-wired to their targets independent of their activation state (Fig. 3a). We first stratified H3K27ac peaks into activity-invariant (n = 14,424), activity-induced (n = 6014), and activity-decommissioned (n = 5402) putative enhancers (Fig. 3b,c, Supplementary Methods, Extended Data Fig. 6f–h, and Supplementary Tables 11–13). We quantified the degree of overlap between our enhancer classes and the anchors of our looping interactions. We identified three major architectural features for further exploration: (i) activity-induced loops anchored by activity-induced enhancers (n = 11) (class 1); (ii) activity-invariant loops pre-wired in inactive neurons and anchored by activity-induced enhancers (n = 41) (class 2); and (iii) activity-invariant loops pre-wired in inactive neurons and anchored by activity-decommissioned enhancers that lose their H3K27ac signal upon chronic neuronal activation (n = 15) (class 3) (Fig. 3d,e). These data reveal a complex long-range cis-regulatory landscape in which diverse loop classes might have unique roles in regulating activity-dependent gene expression.
Fig. 3 |. Uunique topological motifs underlie the activity-dependent transcriptional response.

a, Cartoon representation of hypothesized models in which activity-induced enhancers operate to control gene expression via poised (top) or dynamic (bottom) loops. b, Scatterplot of enhancer acetylation across Bic and TTX conditions, thresholded by fold change in input-normalized signal and classified into activity-induced, activity-invariant and activity-decommissioned enhancers. c, Acetylation heatmaps of classified dynamic enhancers. d, Cartoon representations of the top three loop-enhancer classes of interest. Classified loop anchor colors match those in b, c and e. e, Stacked barplot displaying the percent of loops in each looping class with a classified enhancer at either of its anchors. A key of enhancer classes is shown in b. The number of loops in each subset is shown at the top of the bar. Loops could only be assigned to one enhancer class; the priority order of enhancer classes is from the bottom of the barplot (activity-induced enhancers, considered first) to the top (TSSs, considered last). f, Boxplots of background-normalized contact frequencies for looping pixels in the five looping classes. Boxes in f–h show the range from lower to upper quartiles, with the median line; whiskers extend to minimum and maximum data points within 1.5 times the interquartile range. P values in f–h were calculated using the two-tailed Wilcoxon signed-rank test. The number of loops in each class is listed above boxes. n.s., not significant. g, Fold change in expresion (log2[Bic/TTX]) of the transcripts whose promoters intersect each looping class. The number of genes in each class is listed above boxes. h, Expression (TPM) of the genes whose promoters fall opposite activity-induced (class 2) and activity-decommissioned (class 3) enhancers in genome-wide cortical neuron loops (original data from ref. 33). The number of genes in each class is listed above boxes. i, Percent of differentially expressed (DE) genes (parsed using the Sleuth50 Wald test, q < 0.05) in each genome-wide looping class that are upregulated in Bic compared to TTX (light gray) or downregulated in Bic compared to TTX (dark gray). n= number of genes in each set. j, Gene ontology enrichment calculated using Webgestalt for transcripts presented in g and h. Class 1 genes are from 5C regions only (g, n = 3); class 2 and 3 genes were parsed using genome-wide analyses (h, n = 2,139 class 2, n= 1,044 class 3). Only the top five terms for class 2 could be shown. See Extended Data Fig. 7e for the remaining terms at a false discovery rate (FDR) of < 0.05. ncRNA, noncoding RNA.
We then investigated the potential structural and functional properties of our three loop classes. We noticed that activity-induced loops anchored by activity-induced enhancers (class 1) underwent a 2.2-fold change in interaction frequency after 24 h of Bic treatment (Fig. 3f). Activity-invariant loops anchored by activity-decommissioned enhancers showed a strong and unchanged interaction frequency (class 3, Fig. 3f). By contrast, interaction strength further strengthens after neuronal stimulation in the case of activity-invariant loops pre-wired to activity-induced enhancers (class 2, Fig. 3f). Importantly, although class 1 loops are a rare occurrence, they corresponded to a 24-fold increase in activity-induced expression (Fig. 3g and Extended Data Fig. 7a). Comparatively more genes engaged in class 2 loops but on average displayed a modest 1.3-fold increase in expression in active neurons (Fig. 3g and Extended Data Fig. 7a). These results suggest that, within our 5C regions, activity-induced loops are rare and connect to genes with large activity-dependent increases in expression, whereas pre-existing loops are more abundant but correlate with only minor gene expression changes.
To extend our findings genome-wide, we assessed the link between activity-invariant loop classes 2 and 3 and gene expression using the high-resolution Hi-C maps published in primary cortical neurons33 and our activity-dependent RNA-seq and ChIP–seq data (Fig. 3h and Extended Data Fig. 7b–d). We applied published methods17 to identify 24,937 loops in cortical neurons (Extended Data Fig. 7c,d and Supplementary Tables 14–16) and stratify them into class 2 (n = 4,764) and class 3 (n = 3,259) groups (Supplementary Methods). Consistent with 5C loops, genes connected to activity-induced enhancers via activity-invariant loops (Class 2) displayed a modest but significant upregulation in expression after neuronal activation when we queried genome-wide loops (Fig. 3h and Extended Data Fig. 7b). By contrast, genes looped to activity-decommissioned enhancers via activity-invariant loops (class 3) genome-wide exhibited a slight reduction in expression after neural activation (Fig. 3h). The majority of differentially expressed genes in class 2 versus class 3 loops were upregulated and downregulated, respectively, due to activity (Fig. 3i). Together, our data reveal that the genes connected to activity-induced enhancers via rare de novo loops show the largest effect size in activity-dependent expression. Genes can also exhibit modest but notable upregulation or downregulation when connected via pre-wired, activity-invariant loops to activity-induced (class 2) or activity-decommissioned (class 3) enhancers, respectively. Pre-existing class 2 and class 3 loops are markedly more abundant in number than class 1 loops.
We investigated the ontology of the long-range target genes anchoring each looping class. Class 1 loops connect Fos, Bdnf, and Tmed10 to activity-inducible enhancers, suggesting that the rapid upregulation of IEGs and SRGs involves the induction of de novo loops and de novo enhancers during neural activation (Fig. 3j). Class 2 pre-existing loops connect genes involved in several general cellular functions such as RNA processing to activity-induced enhancers, whereas class 3 pre-existing loops anchored by activity-decommissioned enhancers connect genes linked to synaptic organization and the regulation of synaptic activity (Fig. 3j and Extended Data Fig. 7f). We were intrigued by the placement of synaptic genes in class 3 loops given that they connect to enhancers that are turned off during chronic (24 h) high activity levels. We therefore further stratified genes connected in class 3 loops by those (i) undergoing a 1.5-fold downregulation, (ii) undergoing a1.5-fold upregulation, and (iii) remaining unchanged after neural activity (Supplementary Methods). We found that the cohort of genes undergoing decreased expression in class 3 loops were predominantly involved in synapse organization and signaling, including Gria1, the main AMPA receptor subunit (Fig. 3j and Extended Data Fig. 7f). These results reveal a potential mechanistic role for class 3 loops and activity-decommissioned enhancers in facilitating homeostatic plasticity during chronic high neural activity.
IEGs form shorter and less complex loops than SRGs.
It is well established that IEGs are activated on the order of seconds to minutes in a translation-independent manner following neuronal activation, whereas SRGs are activated on the order of minutes to hours (ref. 2). Consistent with this idea, we re-analyzed a recently published RNA-seq time course during pharmacological neuronal activation9 and found maximum activation of the IEGs Fos and Arc by 60 min, whereas maximum Bdnf upregulation occurred after 6 h (Fig. 4a). Visual inspection of the 5C heatmaps revealed two unexpected links between the kinetics of activity-dependent transcription and loop complexity (Fig. 4b). First, IEGs in our 5C regions form simple short-range loops with activity-dependent enhancers, and thus fall nearly exclusively in the class 1 category. For example, after 24 h of Bic treatment, Fos was upregulated more than 100-fold (Fig. 4c), but we identified only a single 40-kb-sized class 1 loop with an activity-induced enhancer (Fig. 4d). Similarly, Arc was upregulated more than 12-fold after neural activation (Fig. 4c) and also connected in a singular loop with an activity-induced enhancer (Fig. 4e). We note that the Arc interaction falls below our 30-kb distance threshold and therefore is not formally added to the class 1 loop list (Fig. 3g–j). By contrast, SRG Bdnf was upregulated 30-fold after neuronal activation (Fig. 4c) and connected into a complex network of multiple long-distance class 1 and class 2 loops (Fig. 4f–i), including: (i) at least two class 1 activity-induced loops anchored by activity-induced enhancers, but spanning longer distances (840 kb and 1,700 kb) than those formed with IEGs (Fig. 4g,h); and (ii) at least two class 2 activity-invariant loops anchored by activity-induced enhancers (Fig. 4h,i). The loops formed by Bdnf preferentially targeted its first promoter, from which we observed the highest level of transcription and strongest upregulation after 24 h of Bic-induced neuronal activation (Extended Data Fig. 8). Loops connected by Bdnf were significantly longer than those connected by Fos and Arc (Fig. 4j). These observations provide the basis for our working hypothesis that loop complexity and size underlie distinct epigenetic mechanisms governing IEG versus SRG upregulation in response to neuronal activation.
Fig. 4 |. iEGs form shorter and less complex loops than SRGs.

a, Expression timing of Bdnf, Fos and Arc following the initiation of cortical neuron stimulation (from ref. 9). n = 13 0-min, n = 4 20-min, n = 7 60-min, and n = 6 360-min replicates. The center line connects mean estimates, and error bars represent bootstrapped 95% confidence intervals. b, Cartoon representations of two loop classes identified in Fig. 3. c, Expression (TPM) of the Arc, Bdnf and Fos genes across the DIV5, untreated (Unt), TTX, and Bic conditions. n = 3, with mean lines plotted. d, Loop calls (left), TTX interaction score heatmap (middle) and Bic interaction score heatmap (right) of a ~65-kb region surrounding the Fos gene (green). Plotted beneath maps are cortical neuron CTCF (ref. 33), Bic H3K27ac and TTX H3K27ac tracks. The Bic-specific enhancer underlying the Bic loop is highlighted in green. e, TTX interaction score heatmap (left) and Bic interaction score heatmap (right) of a ~35-kb region surrounding the Arc gene (green). f), TTX interaction score heatmap (top), Bic interaction score heatmap (middle), and loop calls (bottom) of a ~2-Mb region surrounding the Bdnf gene (green). Bic loops are shown in orange and constitutive loops in gray. g–i, Interaction score heatmaps of three looping regions highlighted in f across TTX (left) and Bic (right) conditions. Plotted beneath maps are cortical neuron CTCF (ref. 33), Bic H3K27ac and TTX H3K27ac tracks. Bic-specific enhancers are shown in orange and CTCF peaks highlighted in red. j, The genomic distance spanned by each loop formed by the Fos (n = 3) and Bdnf (n = 17) genes. k,l, Boxplots overlaid by stripplots of loop count (k) and maximum looping distance (l) for IEGs (defined as rPRGs in ref. 9), translation-independent SRGs (tiSRGs, defined as dPRGs in ref. 9), translation-dependent SRGs (tdSRGs), and all genes. P values are from two-sided Mann–Whitney rank tests comparing IEGs to other 3 classes. Boxes in k,l show the range from lower to upper quartiles, with the median line; whiskers extend to minimum and maximum data points within 1.5 times the interquartile range. n represents the number of genes in each class. m, Model representation of the distinct looping patterns of the Bdnf and Fos genes.
We next explored loop complexity genome-wide using published annotations of IEGs and SRGs9 and the 24,937 loops from ES cell-derived mouse cortical neuron Hi-C maps (Extended Data Fig. 7c,d and Supplementary Tables 14–16). Published Hi-C data represent only the untreated activity state, therefore we could not assess activity-induced loops (class 1) genome-wide. Nevertheless, we were able to integrate our data on genome-wide enhancers with cortical neuron Hi-C data to query the complexity of activity-invariant loops surrounding known activity-dependent genes genome-wide. Consistent with our locus-specific 5C results, we found that rapid response IEGs form significantly fewer loops (Fig. 4k), shorter loops (Fig. 4l), and connect to a lower number of activity-induced putative enhancers (Extended Data Fig. 8c) than both translation-independent and -dependent SRGs genome-wide. Together, these data are consistent with our working model in which SRGs engage in a complex network of long-range loops, whereas IEGs form simple, short-range loops to activity-induced enhancers to facilitate rapid activation independent of new protein synthesis (Fig. 4m).
Differential IEG and SRG looping kinetics after an acute neural activation time course.
We next examined the kinetics of loop formation for IEGs and SRGs. We created 5C architecture maps in an acute time course of 0, 5, 20, 60, and 360 min of pharmacologically induced high activity in primary cultured mouse cortical neurons. To normalize baseline activity across different cultures, we pre-silenced our neural preparations by 24 h of TTX treatment before the addition of Bic (Fig. 5 and Supplementary Methods). We found that the class 1 loops surrounding Fos and Arc achieved peak contact frequency as quickly as 20 min after initiating stimulation (Fig. 5a,b). We also created total RNA-seq libraries at each time point and observed that the enhancer–promoter loop strength for IEGs peaks before maximum mRNA levels occur (60 min after stimulation) (Fig. 5c,d). Importantly, at early time points Fos interacted with an additional enhancer (Fig. 5a, ‘Enhancer 2’) compared to its loop induced by 24 h of activity (Fig. 4d, ‘Enhancer 1’), suggesting dynamic engagement with differential activity-induced enhancers over short time scales. We next measured enhancer activity dynamics by quantifying the RNA-seq signal that mapped to each enhancer (enhancer RNAs, eRNAs)12 (Supplementary Methods). We verified that our eRNA analysis approach produced activity-dependent dynamic patterns that resembled a previously published activity-induced eRNA data set12 and our own H3K27ac ChIP–seq data (Extended Data Fig. 9). The enhancers that loop to both Fos and Arc peak in activity 20 min after neuronal activity, and exhibit lower activity at all other time points (Fig. 5c,d). Although the extent to which loops causally drive gene expression is still under investigation, our observation that class 1 activity-induced enhancers and loops connect rapidly to IEGs before mRNA levels peak supports the assertion that the two are functionally linked.
Fig. 5 |. Activity-induced loops form before and persist after peak mRNA levels of iEGs.

a,b, Interaction score heatmaps surrounding Fos (a) and Arc (b) across 6 h of Bic treatment (preceded by 24 h of TTX silencing). Heatmap coordinates are identical to Fig. 4d (Fos) and Fig. 4e (Arc). Enhancers quantified in c,d are represented by green boxes. The magenta arrowhead denotes the Fos loop that is present only at early time points. c,d, Quantifications of Fos (c) and Arc (d) enhancer activity (top, quantified by eRNA signal), loop strength (middle, observed/expected 5C counts), and gene expression (bottom, TPM) across the activation time course. e,f, Interaction score heatmaps of activity-induced loops formed by the first Bdnf promoter. Heatmap coordinates in f, ‘Enhancer 2’, match those in Fig. 4g. Heatmap coordinates in e, ‘Enhancer 1’, represent a zoomed-in subset of Fig. 4h to highlight an activity-induced loop. Enhancers quantified in g,h are represented by green boxes. g,h, Quantifications of Bdnf enhancer 1 (g) and enhancer 2 (h) activity (top) and loop strength (middle), coupled with the expression (bottom) of the Bdnf isoform with the strongest expression (see Extended Data Fig. 9). eRNA signal and gene expression are plotted as the mean of n = 2 RNA-seq replicates, error bars represent the 95% CI.
To test our hypothesis that loop dynamics contribute to the relatively delayed expression of SRGs (Fig. 4k–n), we quantified interaction frequency, enhancer activity, and mRNA levels for the class 1 loops formed by Bdnf (Fig. 4g,h). Consistent with our hypothesis, Bdnf class 1 loops did not interact until 60 (Figs. 4h and 5e,g, ‘Enhancer 1’) or 360 minutes (Figs. 4g and 5f,h, ‘Enhancer 2’) after stimulation. Bdnf enhancers and expression were upregulated in parallel with loops and did not reach maximum signal in our time course until 360 min of stimulated activity (Fig. 5g,h). Thus, Bdnf loop and enhancer dynamics are significantly delayed in comparison to those of Fos and Arc, corroborating our model that slower interaction kinetics may contribute to SRGs delayed expression.
Neuropsychiatric-disease-associated genetic variants colocalize with distinct classes of activity-dependent, looped enhancers.
Lastly, we sought to elucidate whether the long-range 3D regulatory landscape might provide insights into how activity-dependent gene expression could be affected in neuropsychiatric disorders. We investigated the link between our loop classes and common SNVs statistically associated with schizophrenia38 and autism spectrum disorders (ASDs)39 via genome-wide association studies (GWAS). More than 90% of disease-associated SNVs (daSNVs) are localized in noncoding regions with unknown target genes40, and this has hindered mechanistic understanding of how genetic variation might disrupt transcription to cause pathological phenotypes. We identified 24,544 unique loops from published Hi-C data created in human brain tissue derived from the germinal zone and cortical plate41 (Extended Data Fig. 10a,b and Supplementary Tables 17,18). We lifted-over our activity-dependent enhancer classes to the human genome and classified 4,098 class 2 and 3,822 class 3 loops from human brain tissue (Fig. 6a and Supplementary Methods). We then assessed whether common daSNVs were enriched in a specific looping class compared to background SNVs matched by the size of the linkage disequilibrium (LD) block, minor allele frequency, distance to nearest gene, and gene density (Supplementary Methods)42. We found that noncoding SNVs associated with schizophrenia38 (n = 80, P < 5 × 10⁻⁸, see Supplementary Methods) preferentially colocalize with class 3 loops anchored by activity-decommissioned enhancers, whereas ASD-associated SNVs (n = 126, P < 10−4, see Supplementary Methods) colocalize with class 2 loops anchored by activity-inducible enhancers39 (Fig. 6b). We cross-validated this result using an independent statistical test, LD score regression43, to quantify the enrichment of heritability for the two diseases within the looping classes. Our LD score regression analysis confirmed a stronger enrichment of ASD-associated heritability in class 2 loop anchors than that for class 3, whereas heritability for schizophrenia displayed the opposite trend (Fig. 6c).
Fig. 6 |. Neuropsychiatric disease-associated SNVs colocalize with long-range activity-induced and -decommissioned looped enhancers.

a, Schematic of class 2 and class 3 loop classes (computed from human brain tissue Hi-C data reported in ref. 41; see Supplementary Methods) used to test for presence of disease-associated SNVs. b, Odds ratios for the enrichment of schizophrenia-associated38 and ASD-associated39 common SNVs at the enhancer-containing anchor of each looping class compared to LD size- and minor allele frequency-matched background SNVs (n = 100 sets of background SNVs). tagSNPs (single-nucleotide polymorphisms that are used to tag a haplotype in a region of the genome) that overlap coding regions or that could not be matched to background LD blocks were removed before analysis. Median Fisher’s exact P values across 100 background sets are included. Boxes show the range from lower to upper quartiles, with the median line; whiskers extend to minimum and maximum data points within 1.5 times the interquartile range. c, Disease-associated heritability enrichment in each looping class (left) and associated P values (right), calculated using LD score regression43 and summary statistics from ASD and schizophrenia GWAS studies used in b. Error bars represent jack-knife standard errors. d, Activity-dependent transcription at daSNV-anchored human looping classes plotted as percent of genes connected to daSNVs in class 2 and class 3 loops that fell within each expression stratum. Expression of the mouse homologs of human genes was used to stratify genes. e, Schematic of our working model of topological regulation in the neuronal activity response. Row 1, activity-upregulated genes are targeted by activity-induced enhancers in activity-induced (class 1) and activity-invariant (class 2) loops. Row 2, ASD SNVs at the base of class 2 loops may disrupt looped enhancer regulation of target gene expression in active neurons. Row 3, activity-decommissioned enhancers interact with target genes in invariant looping interactions (class 3). Row 4, disruption of looped enhancer function by genome variants associated with schizophrenia at the base of class 3 loops may lead to altered transcriptional control in inactive neurons.
We next annotated the genes whose promoters appeared on the opposite side of loops anchored by a pooled list of schizophrenia- and ASD-associated SNVs (Supplementary Table 19). In cases in which class 2 loops overlap schizophrenia- or ASD-associated SNVs, we observe that they connect activity-inducible enhancers to target genes that are preferentially upregulated after neural activation (Fig. 6d). For example, Foxp1, which has been found previously to regulate brain development and synaptic plasticity44, displays remarkable mouse–human conservation of local genome architecture, and loops to several ASD-associated SNVs (Extended Data Fig. 10c) and activity-induced enhancers (Extended Data Fig. 10d,e). By contrast, when class 3 loops overlap schizophrenia- or ASD-associated SNVs, we observe that their target genes are preferentially downregulated by activity (Fig. 6d). One such gene is Slc4a10 (ref. 45), which loops downstream to a schizophrenia-associated SNV (Extended Data Fig. 10f) that overlaps a region of activity-decommissioned H3K27ac (Extended Data Fig. 10g,h). These data reveal that specific common SNVs associated with neuropsychiatric diseases colocalize with loops that connect distinct activity-dependent enhancer classes to unique target genes.
In conclusion, our data show that pre-wired and de novo loops that are anchored by activity-inducible enhancers connect to target genes that exhibit activity-dependent upregulation (Fig. 6e, top). Conversely, invariant loops that are anchored by activity-decommissioned enhancers connect to genes that are downregulated after neuronal activity (Fig. 6e, third row). Future functional dissection will be required to test the model that (i) common ASD daSNVs will disrupt activity-dependent enhancers or the structure of class 2 loops, leading to pathologically altered activity-induced target genes (Fig. 6e, second row), and (ii) common schizophrenia daSNVs will alter activity-dependent enhancer decommissioning or the structure of class 3 loops, leading to pathological alterations in the normal activity-dependent downregulation of target genes (Fig. 6e, bottom row).
Discussion
It has been known for decades that information storage in the brain requires de novo gene expression, but there is little consensus on whether and how specific epigenetic modifications maintain transcriptional signatures induced by neural activity. Here, we show that neuronal activity results in dynamic changes in the 3D genome that may inform precise temporal control of activity-dependent gene expression over short and long time scales.
Using chronic (24 h) neuronal activation and inhibition conditions, we demonstrate that activity-inducible enhancers engage in either de novo (class 1) or pre-existing (class 2) loops. Class 1 and class 2 loops connect to genes exhibiting a 24- and 1.3-fold activity-dependent increase in expression, respectively. Our 5C and genome-wide Hi-C results support our working model in which poised or pre-existing loops that connect to target genes in advance of activity-induced enhancer activation are abundant but have a modest effect on gene expression. Moreover, our 5C results suggest that loops that are induced by neural stimulation are relatively rare but exhibit a markedly higher effect on activity-dependent upregulation of distal target genes. The quantitative effect of these two looping classes on activity-dependent gene expression levels will be more precisely estimated in the future with genome-wide Hi-C and diverse activity-induction conditions. Future studies that focus on genome-wide detection of short-range class 1 architectural features, like Arc and Fos, will require maps with extremely high resolution using Micro-C46 or high read-depth Hi-C created with restriction enzymes that cut 4-bp restriction sites.
A long-standing question in the transcription field is to what degree enhancer activation and/or looping strength are linked to gene expression. We used our loops and linear epigenetic data in chronic activity inhibition and induction conditions to create simple linear models of activity-dependent expression changes. We find that H3K27ac signal at distal looped enhancers is a notably better predictor of activity-dependent target gene expression than nearest enhancers. The ability of our models to explain the variance of activity-dependent gene expression was achieved by building on a critical advance in the functional genomics field. In the ABC model, the multiplication of enhancer activity and 3D interaction frequency was the best predictor of enhancer–target gene pairs37. We used the ABC approach to choose a specific enhancer linked to each gene in our model, and this enabled us to prioritize and identify the looped enhancers that most significantly contributed to activity-dependent gene expression. Together, these data suggest that enhancer–target gene prediction would be facilitated by the use of chromatin architecture maps, instead of relying on the enhancer that is closest on the linear genome.
An important area of active research in neurobiology is elucidating the molecular mechanisms that regulate the unique temporal kinetics of IEGs and SRGs. Here, we unexpectedly observed that IEGs connect to enhancers via singular short-range loops that occur de novo after activation, whereas SRGs connect to multiple activity-inducible enhancers via a complex network of invariant and de novo loops. Consistent with our observations, another study reported—using H3K4me3 proximity ligation assisted ChIP–seq (PLAC-seq)—that the SRG Nr4a3 engages in multiple long-range contacts over several hundred kb after neuronal stimulation26. These observations inspired our working hypothesis that looping complexity and distance are contributing factors to the kinetics of IEG and SRG expression (Fig. 4m). To critically assess this model, we induced acute pharmacological activation of neuronal activity and gathered looping and transcription data across multiple short time points. We observed striking differences in loop and enhancer induction kinetics for IEGs and SRGs in our 5C regions. For example, enhancers and loops surrounding Fos and Arc peak in signal strength roughly 20 min after the induction of neuronal activity, before peak mRNA levels. By contrast, Bdnf loops and enhancers gain strength in parallel with mRNA levels over a longer time of sustained stimulation (360 min). We note that Fos engages in different short-range loops after 5 min, 20 min, and 24 h of neural activation, shifting interaction strength from a nearby enhancer to one that is more distal, suggesting that rapid activity-induced enhancer switching via alternative looping might be a mechanistic aspect of IEG upregulation (Figs. 4d and 5a). Together, these data form the basis of our working hypothesis that the complexity and size of long-range 3D interactions might functionally govern the kinetics of IEG and SRG expression with tight temporal precision during paradigms of synaptic plasticity.
We believe that greater understanding of how activity-dependent enhancers colocalize with daSNVs and connect over vast distances to distal target genes can provide critical new insights into the molecular mechanisms governing disease pathogenesis. Here, we identify a unique set of loops that are anchored by enhancers that decrease in activity during chronic stimulation. We speculate that enhancer decommissioning may be an epigenetic mechanism that is involved in homeostatic plasticity. Consistent with this hypothesis, we find that specific genes that are involved in homeostatic plasticity, such as Gria1, are connected in class 3 loops to activity-decommissioned enhancers and are downregulated during chronic high activity. We also observe that schizophrenia-associated SNVs are enriched at class 3 loops and are connected to downregulated genes after synaptic activity. By contrast, ASD-associated SNVs preferentially colocalize with class 2 loops that connect activity-inducible enhancers to activity-upregulated target genes. These results are striking as they suggest that some disease-specific neuronal phenotypes may arise from noncoding SNVs that have different effects depending on the class of loops that they anchor (Fig. 6e). Moreover, the colocalization of schizophrenia-associated SNVs with class 3 loops suggests that defects in enhancer decommissioning might contribute to synaptic plasticity defects in neuropsychiatric diseases47. Genome misfolding has been reported in fragile X syndrome48, the leading monogenic cause of ASD, as well as other human diseases49, thus loop dysfunction could be possible owing to common SNVs in sporadic ASD and schizophrenia. Future work to build human activity-dependent loop maps and to dissect their functionality with genome editing will continue to refine our understanding of the functional role of distinct activity-dependent architectural features in neuropsychiatric disorders.
Online content
Any methods, additional references, Nature Research reporting summaries, source data, extended data, supplementary information, acknowledgements, peer review information; details of author contributions and competing interests; and statements of data and code availability are available at https://doi.org/10.1038/s41593–0200634-6.
Methods
Cell culture.
Mouse cortical neurons were cultured using a protocol established previously51. In brief, cortices were dissected from embryonic day 18 (E18) wild-type C57/BL6 mouse embryos. Cortices were then dissociated in DNase (0.01%; Sigma-Aldrich) and papain (0.067%; Worthington Biochemicals), then triturated with a fire-polished glass pipette to obtain a single-cell suspension. Cells were pelleted at 1,000g for 4 min, the supernatant removed, and cells resuspended and counted with a TC-20 cell counter (Bio-Rad). Neurons were plated in 6-cm dishes (Greiner Bio-One) coated with poly-L-lysine (0.2 mg ml−1; Sigma-Aldrich) at a density of 200,000 cells per ml. Neurons were initially plated in Neurobasal medium containing 5% horse serum (NM5), 2% GlutaMAX, 2% B-27, and 1% penicillin/streptomycin (Thermo Fisher Scientific) in a 37 °C incubator with 5% CO2. On day in vitro 4 (DIV4), neurons were fed by half media exchange with astrocyte-conditioned Neurobasal medium containing 1% horse serum (NM1), GlutaMAX, and penicillin/streptomycin, 2% B-27, and 5 μM cytosine β-D-arabinofuranoside (AraC; Sigma-Aldrich). Neurons were fed with astrocyte-conditioned NM1 media every 3 d thereafter. For chronic activity experiments, neurons were treated for 24 h with either 1 μM TTX or 10 μM Bic at DIV15 by addition to the cell culture medium or left untreated. For short-term activity-induction experiments, neurons were subjected to 24 h of TTX treatment at DIV15 followed by 0, 5, 20, 60, or 360 min of Bic treatment on DIV16. All animal experiments were approved by the Institutional Animal Care and Use Committee of the University of Utah.
ChIP–seq library preparation.
At DIV16, neuronal cultures were fixed in 1% formaldehyde for 10 min (at room temperature) with the addition of the following fixation solution (1:10 vol/vol): 50 mM HEPES-KOH (pH 7.5), 100 mM NaCl, 1 mM EDTA, 0.5 mM EGTA, 11% formaldehyde. Fixation was quenched by the addition of 2.5 M glycine (1:20 vol/vol) and scraped into pellets of 8 million cells. Each pellet was washed once with cold PBS, flash frozen, and stored at −80 °C. Immunoprecipitation was performed as described previously, with slight modifications27,28. In brief, immunoprecipitation reactions were prepared 1 d before cell lysis by combining 20 μl of protein A and protein G conjugated agarose beads (Invitrogen 15918–014 and 15920–010, respectively) with 10 μl of anti-H3K27ac antibody (Abcam ab4729, lot GR3187598–1, validated for ChIP by company) in 1 ml of cold PBS and rotated overnight. The next day, cell pellets were resuspended in 1 ml lysis buffer (10 mM Tris buffer pH 8.0, 10 mM NaCl, 0.2% NP-40/Igepal, protease inhibitor, PMSF) and incubated on ice for 10 min. Cells were further lysed with 30 strokes of a dounce homogenizer (pestle A) and then nuclei were pelleted. Nuclei were lysed on ice in 50 mM Tris pH 8.0, 10 mM EDTA, 1% SDS, protease inhibitor, PMSF for 20 min. The SDS concentration was reduced before sonication by the addition of 300 μl immunoprecipitation dilution buffer (20 mM Tris pH 8.0, 2 mM EDTA, 150 mM NaCl, 1% Triston X-100, 0.01% SDS, protease inhibitor, PMSF), after which samples were sonicated for 60 min (30 s on, 30 s off cycle, 100% amplitude) using a Qsonica Q800R2 Sonicator. Insoluble fractions were removed by spin, and non-specific binding chromatin was removed from the supernatant by rotation with preclearing solution (3.7 ml immunoprecipitation dilution buffer, 0.5 ml nuclear lysis buffer, 175 μl of agarose protein A/G beads, and 50 μg rabbit IgG) for 2 h at 4 °C. Beads were pelleted and 4.7 ml of supernatant was removed. 200 μl of supernatant was retained as input control (stored at −20 °C) and the remaining 4.5 ml was transferred to the beads that had been pre-bound with the H3K27ac antibody overnight; the immunoprecipitation reaction was then rotated overnight again at 4 °C. Bound bead complexes were washed once with 1 ml immunoprecipitation wash buffer 1 (20 mM Tris pH 8.0, 2 mM EDTA, 50 mM NaCl, 1% Triton X-100, 0.1% SDS), twice with 1 ml high-salt buffer (20 mM Tris pH 8.0, 2 mM EDTA, 500 mM NaCl, 1% Triton X-100, 0.01% SDS), once with immunoprecipitation wash buffer 2 (10 mM Tris pH 8.0, 1 mM EDTA, 0.25 M LiCl, 1% NP-40/Igepal, 1% Na-deoxycholate), and finally twice with 1×TE. Complexes were eluted by twice resuspending bound beads in 110 μl Elution Buffer (100 mM NaHCO3, 1% SDS), pelleting the beads after each elution and transferring 100 μl supernatant to a new tube. Finally, 12 μl of 5 M NaCl and 20 μg RNase A were added to both 200 μl immunoprecipitation and input samples and incubated at 65 °C for 1 h. This was followed by the addition of 60 μg of proteinase K and overnight incubation at 65 °C. DNA was isolated by phenol–chloroform extraction and ethanol precipitation, and the concentration was quantified using a Qubit fluorometer.
ChIP–seq libraries were prepared for sequencing using the NEBNext ultra II DNA Library Prep Kit (NEB E7645S), following the manufacturer’s protocol with the following user-chosen specifications. 3 ng DNA from all immunoprecipitation and input samples was used as starting material. NEBNext Adaptors were diluted 15 times in 10 mM Tris-HCl, pH 8.0 with 10 mM NaCl before adaptor ligation. Large DNA fragments were removed by size selection, by adding 15 μl of AMPure XP beads at the first bead addition step and 87 μl of beads at the second bead addition step. Size-selected DNA was amplified using nine cycles of PCR enrichment. The size range of the final libraries was confirmed to be between 200 and 1,000 bp using an Agilent Bioanalyzer High Sensitivity DNA test. H3K27ac enrichment was confirmed before sequencing by querying the immunoprecipitation or input quantitative PCR (qPCR) enrichment of primer pairs designed to the Arc, synaptotagmin 1, and Tcf25 promoter regions. Library concentrations were calculated and normalized using the KAPA Illumina Library Quantification Kit (KK4835) so that libraries could be equally pooled before sequencing 75-bp single-end reads on the NextSeq500. Immunoprecipitation libraries were sequenced to a depth of more than 48 million reads and all input libraries were sequenced to a depth of more than 67 million reads.
ChIP–seq analysis.
H3K27ac ChIP–seq reads were aligned to the mm9 genome using Bowtie v0.12.7 (ref. 52). Reads with more than two possible alignments were removed (-m2 flag utilized). Immunoprecipitation libraries across the Bic, Untreated, and TTX conditions were downsampled to 38 million reads, and input libraries were downsampled to 44 million reads. Peaks were identified using MACS2 version 2.1.1.20160309 (ref. 53) with a P value cutoff parameter of 1 × 10⁻⁸ and the broad peak flag also invoked with a broad peak cutoff of 1 × 10⁻⁸.
Parsing putative activity-dependent enhancers.
H3K27ac peaks (P value, broad peak thresholds = 1 × 10⁻⁸) called in the TTX and Bic conditions were concatenated together and peaks within 2 kb of RefSeq transcription start sites (TSSs) were removed. The remaining peaks were merged so that peaks within 10 kb of each other were also merged together, thus generating a list of enhancer sites shared across the Bic and TTX conditions. From this master list of enhancer sites, each was parsed into activity-response classes by (i) calculating the average bigwig signal across the enhancer interval using the pybigwig package in both the Bic and TTX immunoprecipitation libraries, (ii) dividing those signal averages by the average signal in the corresponding input library, and (iii) calculating the Bic or TTX fold change of those input-normalized enhancer signals. An enhancer was defined as Bic-specific (activity-induced) if it exhibited a fold change in Bic/TTX greater than 2 and its Bic input-normalized signal was in the top 80% of all enhancers. TTX-specific (activity-decommissioned) enhancers were defined in the same manner with the conditions reversed. The remaining enhancer sites were classified as constitutive (activity-invariant) if their Bic and TTX input-normalized signals were in the top 80% of enhancer signals in both conditions. H3K27ac signal heatmaps for each enhancer class were plotted using the Deeptools package54.
3C template generation.
Neuronal cultures were fixed in formaldehyde as described for ChIP–seq and stored at −80 °C. For each condition (Bic, Untreated, TTX), in situ 3C was performed on four replicates (divided evenly across two animal and culture batches) of 4–5 million cells, as described previously17,27–29. In brief, cells were thawed on ice and resuspended (gently) in 250 μl of lysis buffer (10 mM Tris-HCl pH 8.0, 10 mM NaCl, 0.2% Igepal CA630) with 50 μl protease inhibitors (Sigma P8340). Cell suspension was incubated on ice for 15 min and pelleted. Pelleted nuclei were washed once in lysis buffer (resuspension and spin), then resuspended and incubated in 50 μl of 0.5% SDS at 62 °C for 10 min. SDS was inactivated by the addition of 145 μl H2O, 25 μl 10% Triton X-100, and incubation at 37 °C for 15 min. Subsequently, chromatin was digested overnight at 37 °C with the addition of 25 μl 10X NEBuffer2 and 100U (5 μl) of HindIII (NEB, R0104S), followed by 20 min incubation at 62 °C to inactivate the HindIII. Chromatin was re-ligated via the addition of 100 μl 10% Triton X-100, 120 μl NEB T4 DNA Ligation buffer (NEB B0202S), 12 μl 10 mg ml−1 BSA, 718 μl H2O, and 2,000 U (5 μl) of T4 DNA Ligase (NEB M0202S) and incubation at 16 °C for 2 h (note that this is a deviation from in situ Hi-C17 to promote sticky-end ligation over blunt-end ligation). Following ligation, nuclei were pelleted, resuspended in 300 μl of 10 mM Tris-HCl (pH 8.0), 0.5 M NaCl, 1% SDS, and 25 μl of 20 mg ml−1 proteinase K (NEB P8107), and incubated at 65 °C for 4 h, at which point an additional 25 μl of proteinase K was added and the mixture incubated overnight. 3C templates were isolated the next day by RNaseA treatment, phenol–chloroform extraction, ethanol precipitation, and Amicon filtration (Millipore MFC5030BKS) (for more details, see ref. 28). Template size distribution and quantity were assessed with 0.8% agarose gel.
5C library preparation.
5C primers, which allow the query of genome folding at ultra-high resolution but on a reduced subset of the genome, were designed according to the double alternating design scheme29,48,55–57 using the My5C primer design software (http://my5c.umassmed.edu/my5Cprimers/5C.php)58 with universal ‘emulsion’ primer tails. Regions were designed to capture TAD structures immediately surrounding the genes of interest (Bdnf, Fos, Arc, neurexin 1, neuroligin 3, synaptotagmin 1) in published mouse cortex Hi-C data19. 5C reactions were carried out as previously described29,48,56. 600 ng (~200,000 genome copies) of 3C template for each replicate was mixed with 1 fmole of each 5C primer and 0.9 μg of salmon sperm DNA in 1×NEB4 buffer, denatured at 95 °C for 5 min, then incubated at 55 °C for 16 h. Primers that had then annealed in adjacent positions were ligated through the addition of 10 U (20 μl) Taq ligase (NEB M0208L) and incubation at 55 °C for 1 h then 75 °C for 10 min. Successfully ligated primer–primer pairs were amplified using primers designed to the universal tails (forward, CCTCTC TATGGGCAGTCGGTGAT; reverse, CTGCCCCGGGTTCCTCATTCTCT) across 30 PCR cycles using Phusion High-Fidelity Polymerase. Presence of a single PCR product at 100 bp was confirmed by agarose gel, then residual DNA of <100 bp was removed through AmpureXP bead cleanup at a ratio of 2:1 beads:DNA (vol/vol). 100 ng of the resulting 5C product was prepared for sequencing on the Illumina NextSeq 500 using the NEBNext ultra DNA Library Prep Kit (NEB E7370) following the manufacturer’s instructions with the following parameter selections: during size selection, 70 μl of AMPure beads was added at the first step and 25 μl at the second step; linkered fragments were amplified using eight PCR cycles. A single band at 220 bp in each final library was confirmed using an Agilent DNA 1000 Bioanalyzer chip, and library concentration was determined using the KAPA Illumina Library Quantification Kit (KK4835). Finally, libraries were evenly pooled and sequenced on the Illumina NextSeq 500 using 37-bp paired-end reads to read depths of between 11 and 30 million reads per replicate.
5C interaction analysis.
The adoption of the double alternating primer scheme and in situ 3C significantly improved 5C data quality (see ref. 29 for more details) such that some steps of our 5C analysis approach could be changed from those used previously28 to more closely resemble those used for analyzing Hi-C17. Paired-end reads were aligned to the 5C primer pseudogenome using Bowtie, so that only reads with one unique alignment passed filtering. Only reads for which one paired end mapped to a forward or left-forward primer and the other end mapped to a reverse or left-reverse primer were tallied as true counts.
5C is subject to specific biases, such as primer GC content resulting in annealing or PCR biases, that methods such as Hi-C are not. This manifests in primer–primer pairs with mapped counts that are orders of magnitude higher than the neighboring primer–primer pairs. Such an extreme enrichment of single primer–primer pairs does not resemble the broader distribution of elevated counts, spanning clusters of neighboring primer–primer pairs, that exists at bona fide looping interactions across 5C and Hi-C data. Therefore, we decided to remove these biased primer–primer pairs before proceeding with interaction analysis. This was done by calculating for each primer–primer pair the median count of itself and the 24 primer–primer pairs nearest to the primer–primer pair in question (that is, a scipy.ndimagfor exampleeneric_filter window of size 5 was passed over the primer–primer pair matrix and the median of each window was recorded). If the count of one primer–primer pair was greater than eightfold higher than its neighborhood median then it was flagged as a high spatial outlier and removed. This process was performed for all primer–primer pairs, except for those in the 5C region surrounding the Arc gene, for which the eightfold threshold was found to be too stringent owing to low region complexity and therefore a 100-fold threshold was used instead.
After the removal of high outliers, primer–primer pair counts were quantile normalized across all 12 replicates (4 per condition) as described previously29,34. For plotting purposes, quantile-normalized counts were merged across replicates by summation, whereas for loop calling analysis all replicates were kept separate. Primer–primer pair counts were then converted to fragment–fragment interaction counts by averaging the primer–primer counts that mapped to each fragment–fragment pair (a maximum of two if both a forward or left-forward and a reverse or left-reverse primer were able to be designed to both fragments and were not trimmed during outlier removal). We then divided our 5C regions into adjacent 4-kb bins and computed the relative interaction frequency of two bins (i,j) by summing the counts of all fragment–fragment interactions for which the coordinates of one of the constituent fragments overlapped (at least partially) a 12-kb window surrounding the center of the 4-kb ith bin and the other constituent fragment overlapped the 12-kb window surrounding the center if the jth bin. Binned count matrices were then matrix balanced using the ICE algorithm34,59, at which point we considered each entry (i,j) to represent the relative interaction frequency of the 4-kb bins i and j. Finally, the background contact domain ‘expected’ signal was calculated using the donut background model, as described previously14, and used to normalize the relative interaction frequency data for the background interaction frequency present at each bin–bin pair. The resulting background-normalized interaction frequency (observed over expected) counts were fit with a logistic distribution from which P values were computed for each bin–bin pair and converted into background-corrected interaction scores (interaction score = −10 × log2[P value]) as described previously. Interaction scores have proven to be informatively comparable across replicates and conditions21, and as such were used for most subsequent visualization analyses and all loop-calling analyses.
Quantitative 5C loop identification.
We applied the 3DeFDR analysis package35 to our data set to identify differential interactions across the TTX and Bic conditions (four replicates of each). In brief, 3DeFDR identifies differential interactions and estimates an empirical false discovery rate (eFDR) for each identified dynamic looping class. Interactions were considered for analysis only if the interaction scores of all eight replicates across both conditions surpassed a ‘significance threshold’. Interactions were classified as ‘TTX-only’ if all four interaction scores of the TTX replicates surpassed the interaction scores of the Bic replicates by more than a specified ‘difference threshold’. ‘Bic-only’ interactions were classified in the same manner. Those interactions that passed the significance threshold but were not classified as Bic-only or TTX-only were classified as ‘Constitutive’. Lastly, significant interactions that passed our thresholds were clustered based on spatial adjacency into ‘loops’. Looping clusters that were smaller than 5 pixels were removed. The 3DeFDR package simulates null replicate sets (that is, eight replicates of the same cell type per condition) using a negative binomial counts generating function parameterized with mean-variance relationships computed from the real data. We compute an eFDR for each differential loop class as the total number of significant interactions called in that class on a simulated null replicate set divided by the total number of significant interactions called as that class with the original real replicate set.
We used the ‘non-adaptive’ functionality option of the 3DeFDR analysis package, which sweeps across a wide range of difference thresholds and calculates an eFDR for each loop class at each iteration. We generated 250 simulated null replicate sets of eight replicates based on mean-variance relationships underlying the real TTX replicates. We used the default 3DeFDR initialization parameters with the exception of ‘bin_properties’, which is a tunable parameter that specifies the distance scales over which fragment level interactions are stratified before fitting the negative binomial counts generating function to those interactions. We modified ‘bin_properties’ to capture the full extent of our regional matrices: (i) for close-range interactions (0–150 kb), we stratified the interactions using fine-grained, 12-kb sliding windows with a 4-kb step; (ii) for mid-range interactions (151–600 kb), we stratified the interactions into 24-kb sliding windows with an 8-kb step; and (iii) for longer-range interactions (601–2,500 kb), we stratified the interactions into coarse-grained, 60-kb sliding windows with a 24-kb step. Through this approach we achieved an eFDR of 6.6% for Bic-only (activity-induced) loops using a difference threshold of 6.75, a significance threshold of −10 × log2(0.08) (that is, a P value of 0.08 resulting from the logistic fit to the observed over expected data), and a cluster size threshold of 5.
RNA-seq library preparation.
At DIV5 and DIV16, 900,000 neurons were lysed in 1 ml Trizol (Thermo Fisher Scientific 15596026). Lysates were snap frozen and stored at −80 °C until use. Total RNA was then isolated using the mirVana miRNA Isolation Kit (Thermo Fisher Scientific AM1561) according to the manufacturer’s protocol and eluted from the spin column using 100 μl nuclease-free water. Samples were DNase treated (Thermo Fisher Scientific AM1906) and tested for quality using an Agilent Bioanalyzer RNA chip. All samples produced an RNA integrity number (RIN) greater than 9. To avoid poly-A selection, we used the TruSeq Stranded Total RNA Library Prep Kit with Ribo-Zero Gold (Illumina RS-122–2301) and prepared each RNA sample for sequencing according to the manufacturer’s protocol. Complementary DNA libraries were amplified across 15 PCR cycles followed by AMPure XP Bead clean-up (1:1 bead:solution ratio). Finally, the library sizes were confirmed to be between 200 and 500 bp using the BioAnalyzer before sequencing 75-bp paired-end reads on the Illumina NextSeq500. To minimize and identify technical variation, three replicates spanning two culture batches were prepared, pooled, and sequenced to depths of greater than 60 million reads per library.
RNA-seq analysis.
RNA-seq reads were mapped to the RefSeq transcriptome (transcriptome fasta downloaded from the UCSC genome browser on 28 July 2017) using Salmon60. In accordance with TruSeq Stranded Total RNA Library Preparation, mapping was done using the -ISR flag. In addition, 100 bootstraps of transcript quantification were performed. The resulting quantifications of transcripts per million (TPM) for each RefSeq transcript were used for all downstream analyses (Figs. 1–6 and Supplementary Table 3). The Wasabi package (https://github.com/COMBINE-lab/wasabi) was used to convert Salmon bootstraps to the format necessary for differential expression analysis by Sleuth50. Differentially expressed transcripts were called using the Sleuth wald test, with a q value threshold of 0.05 (Supplementary Table 4). For eRNA analysis, RNA-seq reads were mapped to the mm9 genome using STAR version 2.7.1 (ref. 61) using default settings. Resulting bigwig files were used to quantify RNA signal overlapping each enhancer interval.
Linear regression modeling.
To assess the relative contributions of cis-regulatory elements to activity-response gene expression, for each transcript in our 5C regions we sought to quantify its promoter activity, looping strength, looped enhancer activity, and nearby enhancer activity. Transcripts whose promoter fell within 200 kb of the edge of a 5C region were removed owing to incomplete or truncated ability to query loops outside the 5C regions. In addition, if transcripts of the same gene had overlapping promoters (±2 kb from the TSS), only the transcript with the highest maximum expression across the TTX and Bic RNA-seq replicates was carried forward for further analysis. The promoter activity of each gene was calculated using the PyBigWig package to find the log2[Bic/TTX] fold change of the sum H3K27ac bigwig signal across the 4-kb promoter (±2 kb from the TSS) in each condition (Fig. 2a,f).
Each transcript was paired with the enhancer nearest to its TSS along the linear genome. If no enhancers fell within 200 kb of the promoter, the transcript was considered to have no ‘near enhancer’ (only the case for NM_026271). The ‘activity’ of the near enhancers was then also calculated as the log2[Bic/TTX] fold change of the sum H3K27ac bigwig signals across the enhancer (Fig. 2g). In addition, the total interaction frequency for each promoter was calculated by summing the observed 5C counts in the Bic and TTX conditions of all 5C bins the promoter overlapped and calculating the log2[Bic/TTX] fold change (Fig. 2b). Similarly, the promoter of each transcript was intersected with 5C loops so that it could be paired with enhancers that fell at the other anchor of each loop. Often, promoters formed several loops, interacting with multiple enhancers. To select the single enhancer−promoter loop (so that we could accurately compare to the single nearest enhancer) predicted to have the largest regulatory role on the gene in question, we leveraged an adapted ABC-model approach37, selecting the enhancer−promoter loop that had the highest ((H3K27ac signal) × (5C observed/expected)) value (Fig. 2c). Only promoters that looped to enhancers were included in calculations of loop strength and looped enhancer signal (Fig. 2d,e,h–i). Notably, the looped enhancer models were more predictive of activity-dependent gene expression than the nearest enhancer and promoter-only models, and this trend remained whether we used only genes engaged in loops (n = 45, Supplementary Fig. 6b–e) or all genes (n = 69, Fig. 2d,e,h,i). ‘Loop strength’ was then calculated as the log2[Bic/TTX] fold change of the 5C observed/expected counts of the ABC-prioritized loop for each gene (Fig. 2d,h). ‘Looped enhancer’ signal was calculated as the log2[Bic/TTX] fold change of the sum H3K27ac bigwig signal in each condition at the selected looped enhancer (Fig. 2e,i). Lastly, the ((H3K27ac signal) × (5C observed/expected)) score itself was used to build a regression model (Fig. 2j). The expression fold change of each transcript was calculated as the log2[Bic/TTX] fold change of the TPM estimate provided by the Salmon quantification algorithm (a pseudocount of 1 was added to the TPM expression counts in each condition before log transformation).
For linear regression modeling, the vectors of each epigenetic feature described above were min–max scaled to a range of −0.5 to 0.5 using the sklearn. preprocessing minmax_scale function, so that the calculated coefficients of each model could be compared. The ordinary least squares function of the statsmodels. formula.api package was then used to generate linear regression models from combinations of these epigenetic features as explanatory variables, with fold change of expression as the response variable. Residuals were plotted to confirm approximate normal distributions. The performances of these models were evaluated by the coefficient (slope) and significance of each term (Fig. 2l), and the per cent of the transcriptional variance explained (R2) of each model (Fig. 2k).
Hi-C pre-processing.
Mouse33 and human41 paired-end reads were aligned to the mm9 and hg19 genomes, respectively, using bowtie2 (ref. 62) (global parameters: –very-sensitive –L 30 –score-min L,−0.6,−0.2 –end-to-end–reorder; local parameters:–very-sensitive –L 20 –scoremin L,−0.6,−0.2 –end-to-end–reorder) through HiC-Pro software63. Unmapped reads, non-uniquely mapped reads and PCR duplicates were filtered, uniquely aligned reads were paired, and replicates were merged (Supplementary Table 1). Cis-contact matrices were assembled by binning paired reads into uniform 20-kb (human) or 10-kb (mouse) bins. After matrix assembly, poorly mapped regions were removed based on the mm9 and hg19 50-mer CRG Alignability tracks from ENCODE. The interactions of 50-kb windows that uniquely aligned at a rate below 40% (mouse) and 50% (human) were set to NaN. Owing to noticeably lower complexity in the human libraries, rows containing less than seven non-zero pixels within 200 kb of the diagonal were completely removed during the human Hi-C analysis only. Matrices containing the remaining cis-contact counts were balanced using the Juicer implementation of the Knight Ruiz algorithm with default parameters64. The final bias factors were retained for subsequent loop calling (see the next section). Balanced matrices were used for plotting (Fig. 1c and Extended Data Fig. 2).
Hi-C loop calling.
Hi-C interactions were tested for significance using methods reported in ref. 17, with minor alterations. To estimate the local background domain interaction frequency at each locus we used the donut expected model approach (described above, see ref. 17) with parameters p = 1, w = 4 for the human libraries (20-kb resolution) and p = 2, w = 6 for the mouse libraries (10-kb resolution). For each matrix entry the expected values were calculated using both the full donut window and just the lower-left region of the donut, and the higher of the two was carried forward (that is, expected = max(donut,lower-left)). However, owing to the extremely high on-diagonal counts we found this approach often overestimated the expected background at short-range interactions (less than 100 kb). To accurately capture short-range interactions, we modeled the on-diagonal (less than 100-kb) background expected using only the upper-triangle region of the donut footprint. Expected contact matrices were then ‘deconvoluted’ back to discrete counts using the bias factors generated during Knight Ruiz balancing (see the previous section)17. Each entry in the cis-contact matrix (pre-balancing) was tested for significance using a Poisson distribution parameterized by its corresponding deconvoluted expected value17. Resulting P values were corrected for multiple testing using the Benjamini–Hochberg procedure. For an interaction to be called as significantly enriched above background, it was required to pass 3 thresholds: (i) a q value threshold (q < 0.01 human, q < 0.025 mouse); (ii) a balanced-count threshold (count of >10 for human, count of >20 for mouse); (iii) a distance threshold (distance of >60 kb for human, distance of >40 kb for mouse). Matrix entries passing these thresholds were clustered by adjacency into loops. Loops that were made up of fewer than 2 (human) or 3 (mouse) constituent matrix entries (interactions) were removed from further analysis.
Activity-dependent loop classification and gene expression analysis.
Both 5C and mouse Hi-C loops were classified by the presence of enhancers at their anchors into mutually exclusive loop classes. 5C loops (Bic-only, TTX-only, constitutive) were classified using a specific order of intersection: loops were classified as containing a Bic-specific (activity-induced) enhancer (classes 1 and 2; Fig. 3d,e, green) if a Bic-specific (activity-induced) enhancer fell at (at least) one of its loop anchors. Of the loops that did not intersect a Bic-specific or constitutive enhancer, the loop was class 3 if a TTX-specific (activity-decommissioned) enhancer intersected a loop anchor (class 3; Fig. 3d,e, purple). If the loop’s anchors intersected no enhancers but did intersect a promoter (defined as ±2 kb surrounding RefSeq TSSs downloaded from the UCSC genome browser) it was classified as a ‘TSS loop’ (Fig. 3d, orange). The remaining loops of each class (Bic-only, TTX-only, constitutive loops) were ‘Unclassified’ because they did not intersect a queried epigenetic feature. The three classes highlighted in subsequent analyses (Fig. 3d–j) were Bic-specific enhancers in Bic-only loops (class 1), Bic-specific enhancers in constitutive loops (class 2), and TTX-specific enhancers in constitutive loops (class 3). The average observed/expected signal for each looping cluster in each looping class was calculated (Fig. 3f). The promoter (±2 kb of TSS) of each RefSeq transcript was then tested for whether it overlapped a loop anchor of each class. If multiple transcripts of the same gene shared (had overlapping) promoters, only the transcript with the maximum expression (TPM) across the Bic and TTX conditions was considered. In addition, genes were not considered if they fell within 200 kb of the edges of our 5C regions because we could not accurately capture their looping profiles. Those transcripts linked to promoters that fell at the base of each loop class were analyzed for Bic or TTX expression upregulation (Fig. 3g) and class 1 genes were analyzed for their gene ontology enrichment (Fig. 3j).
Genes at the base of genome-wide mouse cortical neuron Hi-C loops (original data from ref. 33) were similarly classified into mutually exclusive groups based on the enhancers to which they looped (Fig. 3h–j). Hi-C loops were first classified based on enhancers that intersected each anchor; class 2 anchors contain activity-induced enhancers with no activity-decommissioned enhancers, class 3 anchors contain activity-decommissioned enhancers with no activity-induced enhancers. If an enhancer class overlapped the upstream anchor, the downstream anchor was queried for intersection with promoters. If multiple transcripts of the same gene had promoters that overlapped the same anchor, only the transcript with the highest average expression across the Bic and TTX conditions was considered.
Gene ontology enrichment was performed using WebGestalt65 (http://www.webgestalt.org) with the following settings: Organism of interest = mmusculus; Method of interest = overrepresentation enrichment, Functional database = geneontology, biological_process_noRedun. refSeq mRNA identifiers were uploaded for each set of classified genes. The genome_protein-coding set was used as the reference set for genome-wide Hi-C gene classes; all genes that fell within our 5C regions were used as the reference set for 5C gene class enrichment. The enrichment ratios and −log10[Benjamini–Hochberg FDR] values for all gene ontology terms with an FDR of <0.05 were plotted (Fig. 3j and Extended Data Fig. 7e).
IEG and SRG analysis.
We analyzed rapid IEGs (defined as rIEGs in ref. 9), translation-independent SRGs (tiSRG, defined as dPRG in ref. 9) and translation-dependent SRGs (tdSRG, defined as SRG in ref. 9) by utilizing gene lists provided in Supplementary Table 5 of ref. 9. Genes were removed from each class if their promoter (10 kb upstream from the TSS) did not overlap an H3K27ac peak called in the Bic condition or the gene (plus 10-kb promoter) did not intersect the anchor of a mouse Hi-C cortical neuron looping interaction. The number of loops that each gene (plus 10-kb promoter) intersected was recorded (Fig. 4k). In addition, the distance of each loop was calculated as the difference between the center point of the two anchors (Fig. 4l). For each loop in which an IEG or SRG gene was at one anchor, the other anchor was tested for an intersection with Bic-specific enhancers. The number of loop anchors paired with each gene that intersected a Bic-specific enhancer were tallied (genes that did not loop to any Bic-specific enhancers were not considered) (Extended Data Fig. 8c). Representative boxplots depict: center line, median; box limits, upper and lower quartiles; whiskers, 1.5x interquartile range; points, outliers. Expression timing of Bdnf, Arc, and Fos was calculated using Supplementary Table 2 from ref. 9. Each count was normalized to the maximum count for that gene across the four time points. The mean normalized count at each time point was plotted along with 95% confidence intervals (Fig. 4a).
Disease-associated GWAS SNV enrichment.
Common variants associated with neurodevelopmental diseases were analyzed from the following sources:
Schizophrenia: Schizophrenia Working Group of the Psychiatric Genomics Consortium in ref. 38; P ≤ 5 × 10⁻⁸, Supplementary Table 2 from the referenced paper.
ASDs: Autism Spectrum Disorders Working Group of The Psychiatric Genomics Consortium in ref. 39 (European population); P < 10−4, Additional File S3 from the referenced paper.
daSNVs that fell within exons or gene promoters (2 kb upstream of the TSS) were discarded from the analysis. rsIDs for each disease set were uploaded to SNPsnap42 to generate 10,000 matched ‘background’ SNVs for each daSNV. daSNVs were matched according the 1000 Genomes Phase 3 European data set at a linkage disequilibrium (LD) distance cutoff of r2 = 0.7 and ‘LD buddies’ (SNPsnap parameter) at r2 = 0.7. daSNVs that could not be background matched using SNPsnap were discarded. Genome-wide LD r2 values for SNV pairs were downloaded from the SNIPA tool66. For each daSNV and background SNV, an LD block was identified as the set of nucleotides for which the SNV in question had an r2 > 0.7. Background LD blocks that overlapped each other or a disease-associated block were removed. The size of each LD block, disease and background, was calculated as the number of constituent SNVs. For each daSNV, five background SNVs with the same size LD block were selected. If fewer than five background LD blocks of the exact same size existed, background LD blocks of size one greater and one smaller than the disease-associated LD block in question were included in the set of five size-matched background LD blocks. The size of included background blocks was iteratively increased by one until five size-matched background LD blocks could be selected. If fewer than five background LD blocks had a size within ten of the disease-associated block, successful background matching could not occur and the process was stopped. For example, for a daSNV with an LD block of size 75, background SNVs with LD blocks of sizes 65–85 could be matched, with preference given to those of size 75, then 74 and 76, and so on. daSNVs that could not be successfully matched to five background LD blocks were removed from further analysis. Note that for schizophrenia-associated SNVs, the number of size-matched LD blocks was decreased to four per daSNV. If more than five background LD blocks were equally able to be matched to a given daSNV, five were randomly chosen. Owing to this randomness in the algorithm, 100 different sets of background size-matched SNVs were chosen for each daSNV (note that there are 100 data points in Fig. 6b, one per background set).
LD blocks (disease and background) were tested for their presence at loop anchors in the following manner. Loops were called on germinal zone and cortical plate fetal brain tissue Hi-C data from ref. 41 (see Hi-C processing steps above). Cortical plate and germinal zone loops were then merged to create a master set of 24,544 loops spanning the two brain tissues. In addition, 25,722 ‘background loops’ were identified as those Hi-C contact matrix entries that had a P value of >0.99 and an interaction frequency count of >0 in both cortical plate and germinal zone data sets. Background loops were confirmed to display the same loop distances and loop sizes as the real loop set. Bic-specific, TTX-specific, and constitutive enhancers were lifted to the hg19 genome build using the liftOver tool on the UCSC genome browser, with default parameters. Fetal brain loops were classified by enhancer presence at its anchor(s) in the same way as mouse cortical neuron Hi-C loops. Queried LD blocks were then classified based on their presence at loop anchors: if any SNV in the LD block overlapped a loop anchor that was shared by a TTX-specific enhancer and not a Bic-specific enhancer, the LD block was considered a class 3 variant; if any SNV in the LD block overlapped a loop anchor that was shared by a Bic-specific enhancer and not a TTX-specific enhancer, the LD block was considered a class 2 variant. LD blocks had to fall at the same anchor as the enhancer to be classified. Finally, those LD blocks that did not overlap a classified loop anchor were tested for their presence at the anchor of a background loop. For each class, enrichment was calculated using Fisher’s exact test with the following contingency table:
[[disease-associated blocks in loop of class X, background blocks in loop of class X],
[disease-associated blocks in background loops, background blocks in background loops]]
The resulting odds ratios were recorded for each of the 100 background size-matched SNV sets and plotted (Fig. 6b) with the median P value of the 100 tests.
LD score regression.
To assess the polygenic enrichments of GWAS data sets listed above within looping classes, we applied LD score regression43,67. This was run on the European subset of summary statistics from each GWAS. We used pre-computed LD scores based on the European ancestry samples of the 1000 Genomes Project68,69 restricted to HapMap3 SNVs, and generated partitioned LD scores for each looping class. All default LD score regression parameters were used. LDSC version 1.0.0 was used (https://github.com/bulik/ldsc).
We conducted enrichment analyses of the heritability for SNVs located in each looping class. We regressed the χ2 from the GWAS summary statistics on to looping class-specific LD scores, with baseline scores (original 53 annotation model), regression weights, and allele frequencies based on European ancestry 1000 Genome Project data. The enrichment of a looping class was defined as the proportion of SNV heritability in the category divided by the proportion of SNVs in that category; we report enrichment values and statistical significance of this enrichment as P values (Fig. 6c).
Disease-associated gene expression.
For each loop that was found to have a disease-associated LD block and classified enhancer at one anchor (see above), the other anchor of the same loop was tested for intersection with promoters (±2 kb from TSS data of the human RefSeq database, downloaded from UCSC genome browser). To identify as many target genes as possible, disease-associated LD blocks that could not be size-matched in the previous section were included here because no enrichment against background SNVs was being calculated (however, those SNVs that were not in the 1000 Genomes database and therefore could not be assigned LD blocks or matched in SNPsnap were still excluded, as well as all daSNVs that overlapped exons and promoters). Promoters that colocalized on the other side of classified loops are annotated in Supplementary Table 19 and Fig. 6d. Human gene symbols were matched to mouse homologs using the Jackson laboratories complete list of homologs (http://www.informatics.jax.org/downloads/reports/HOM_MouseHumanSequence.rpt). Mouse homologs of classified genes that fell in loops across from disease-associated LD blocks could then be stratified by their Bic/TTX expression (TPM) fold change, and plotted (Fig. 6d).
Statistics.
For linear regression modeling (Fig. 2f–l), the ordinary least squares package from statsmodels (https://www.statsmodels.org/dev/examples/notebooks/generated/ols.html) was used to generate and plot best fit lines with 95% confidence intervals (Fig. 2f–j and Extended Data Fig. 6b,c). The best fit coefficients, their t-test P values and standard error estimates were plotted as barplots (Fig. 2l and Extended Data Fig. 6e). Gene expression differences across looping classes (Fig. 3f–h) were tested for significance using the scipy Wilcoxon test (https://docs.scipy.org/doc/scipy/reference/generated/scipy.stats.wilcoxon.html). Differences in loop complexity across gene class (Fig. 4k,l) were tested for significance using the scipy Mann-Whitney U-test (https://docs.scipy.org/doc/scipy/reference/generated/scipy.stats.mannwhitneyu.html#scipy.stats.mannwhitneyu). SNV overlap of classified loop anchors (Fig. 6b) was tested for significance using Fisher’s exact test. No statistical methods were used to pre-determine sample sizes but our sample sizes are similar to those reported in previous publications17,27,28. Treatment conditions were evenly distributed across culture batches and treatments were randomly assigned to culture dishes within each batch. Data collection and analysis were not performed blind to the conditions of the experiments. No animals or data points were excluded from the analyses.
Reporting Summary.
Further information on research design is available in the Nature Research Reporting Summary linked to this article.
Data availability
We have uploaded all data from this manuscript to the Gene Expression Omnibus (GEO) under accession number GSE131025.
Code availability
5C analysis code has been included as a supplementary zip file.
Extended Data
Extended Data Fig. 1 |. Mapping genome folding across neural activity states.
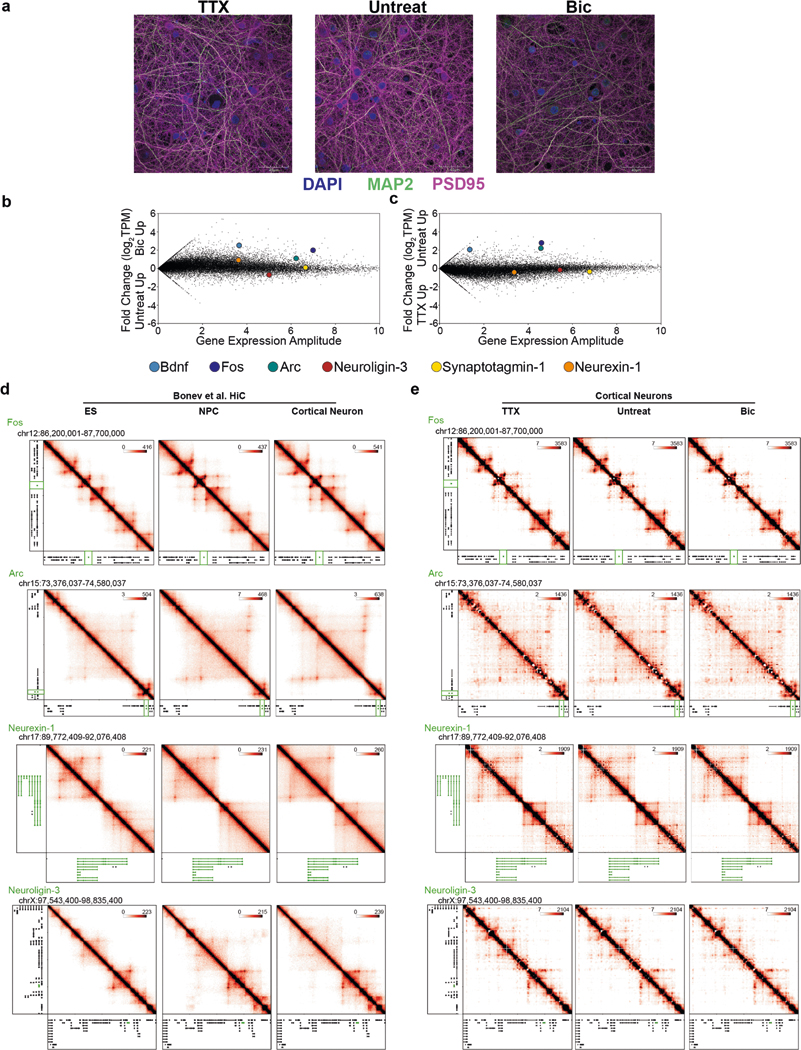
a, Representative immunofluorescence images of DAPI (blue), MAP2 (green), PSD95 (magenta) signal across conditions. Results were consistent across 2 culture batches, 4 total 5C replicates, 3 RNA-seq replicates, and H3K27ac ChIP replicate analyzed. b,c, Fold change vs amplitude plots of RNA-seq data comparing the Bic vs Untreat conditions (b) and TTX vs Untreat conditions (c). d, Interaction frequency heatmaps of 1–3 Mb regions surrounding the Fos, Arc, Neurexin-1, and Neuroligin-3 genes (labeled in green) across embryonic stem (ES) cells, neural progenitor cells (NPCs), and cortical neurons (CNs) (data analyzed from Bonev+ 2017). e, Interaction frequency heatmaps of the regions presented in (a) across tetrodotoxin-treated (TTX), untreated, and bicuculline-treated (Bic) DIV16 cortical neurons.
Extended Data Fig. 2 |. Activity-induced loops are not present earlier in cortical neuron differentiation.

a, Zoom-in heatmaps of critical loops presented throughout the paper. From left to right the columns are Obs/Exp heatmaps of HiC (Bonev et al.) data from 1) embryonic stem (ES) cells, 2) neural progenitor cells (NPC), 3) cortical neurons (CN), followed by 5C interaction score heatmaps across the 4) TTX, 5) untreated, and 6) BIC treated conditions. Genes of interest in each zoom window, Figure panels where same loop is further analyzed, and loop classification are listed on left.
Extended Data Fig. 3 |. 5C data correlateions cluster by condition.

a, b, Pearson’s correlation coefficients of background-normalized contact frequencies (‘observed/expected’) at activity-induced loops (a) and activity-invariant loops (b) across each pair of replicates. The N = 4 independent biological replicates for each condition were then hierarchically clustered based on correlation results.
Extended Data Fig. 4 |. Activity-induced and activity-invariant loops are reproducible across condition replicates.

a, Zoom-in interaction score heatmaps from each of the 12 5C replicates generated for critical loops presented throughout the paper. Genes of interest in each zoom window, Figure panels where same loop is further analyzed, and loop classification are listed on left.
Extended Data Fig. 5 |. identifying dynamic looping across neural activity states.
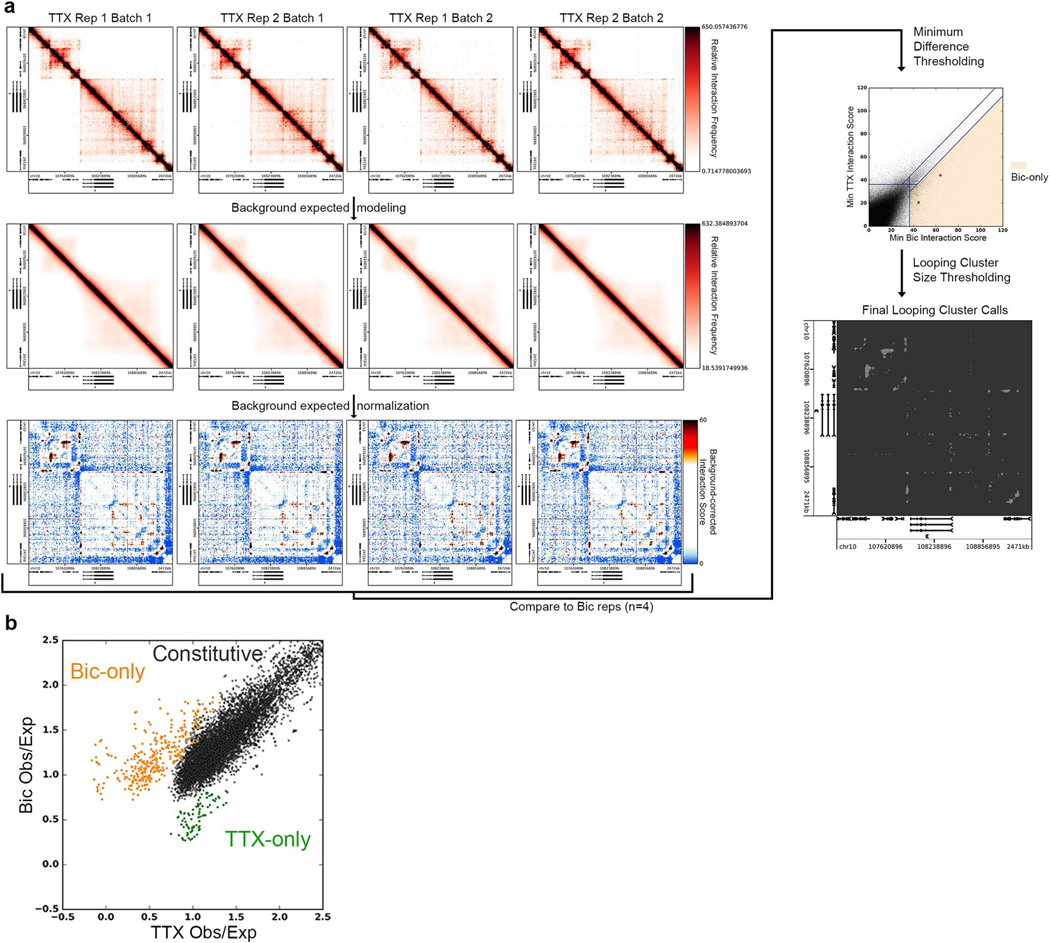
a, Diagram of 5C processing pipeline used to call significant constitutive and dynamic loops (bottom right) starting from 5C interaction frequency counts for all pairs of 4 kb genomic bins within queried regions across 4 replicates (from two litter/culture batches) of each condition (top left). First the local domain background signal is quantified using a donut expected model (Rao + 2014) and removed from the interaction frequency signal. Probabilistic modeling converts these expected-normalized interaction frequencies to an ‘interaction score’ (bottom left). For a bin-bin pair to be classified as looping, its interaction score must fall above a given ‘significance threshold’. For a looping bin-bin pair to be classified as ‘Bic-only’ the minimum interaction score of the Bic replicates must exceed the maximum interaction score of the four TTX replicates by a given ‘difference threshold’ (Supplementary Methods). Looping pixels not classified as Bic- or TTX-only are classified as constitutive (top right). Bin-bin pairs of the same class are then grouped into clusters if they are directly adjacent; clusters below a selected size threshold are removed from looping classification (bottom right). See Methods for more details. b, Scatterplot of the background-normalized contact frequency (‘Observed/Expected’) counts of looping-classified pixels in TTX and Bic conditions.
Extended Data Fig. 6 |. Quantifying activity-dependent regulatory elements.

a, Spearman’s correlation coefficients for terms included in models (Fig. 2f-i). b, c, Results of promoter-only (b) and promoter plus nearest enhancer (c) models for only genes that form loops to classified enhancers within 5C regions. N = 45 genes analyzed. d, R2 values of models presented in (b-c). e, Coefficients of each explanatory variable term in models presented in (b-c). t-statistic p-values and standard errors represented via stars and error bars, respectively. f–h, Acetylation heatmaps, pileups of classified activity-induced (f), activity-decommissioned (g), invariant (h) enhancers.
Extended Data Fig. 7 |. Assessing activity-dependent regulation using murine HiC (Bonev et al.33) loop calls.

a, Expression (TPM) of the transcripts whose promoters intersect each looping class. P-values presented calculated using two-tailed Wilcoxon signed-rank test. b, Expression (log2(TPM)) of the genes whose promoters fall opposite activity-induced (class 2) and activity-decommissioned (class 3) enhancers in genome-wide cortical neuron loops, original data from Bonev et al.33. Number of genes in each class (a, b) listed as N = above boxes. Boxes in a-b range from lower to upper quartile with median line, whiskers extend to min/max data point within 1.5*interquartile range. c, Number of loops called in HiC data obtained from embryonic stem cells (ES), neural progenitor cells (NPCs), and cortical neurons (CN) (Bonev et al.33). c,d, Interaction frequency heatmaps (top) and thresholded loop calls (bottom) for a ~2.5 Mb region surrounding the Synaptotagmin1 Syt1 gene. d,e, Expression (log2(TPM)) of the genes whose promoters fall opposite activity-induced (class 2) and activity-decommissioned (class 3) enhancers in genome-wide cortical neuron loops, original data from Bonev et al.33. Number of genes in each class listed above boxes. The remaining gene ontology terms passing the FDR < 0.05 threshold for class 2 (a) which could not be presented in Fig. 3. N = 2139 Class 2 genes, enrichment calculated using Webgestalt65. f, (Left) Gene ontology enrichment ratios for class 3 genes parsed by expression into activity downregulated (Bic/TTX < 2/3), activity invariant (5/6 < Bic/TTX < 6/5), and activity upregulated (Bic/TTX > 3/2) groups. (Right) Genes found in the ‘regulation of trans-synaptic signaling’ and ‘synapse organization’ GO terms enriched in activity downregulated class 3 genes.
Extended Data Fig. 8 |. Expression of Bdnf transcripts.

a, Depiction of the 12 RefSeq transcript isoforms of the Bdnf gene, above which we annotate the 8 promoters as in Hong et al., Neuron, 2008. b, Expression strip plots of each Bdnf isoform, organized in columns by shared promoter. N = 3, mean lines plotted. c, Boxplots overlaid by strip plots of count of opposing looping anchors that contain an activity-dependent enhancer for rapid immediate early genes (rIEGs, as defined as rPRGs in Tyssowski et al.9), translation-independent SRGs (tiSRGs, defined as dPRGs in Tyssowski et al.9), translation-dependent SRGs (tdSRGs, defined as SRGs in Tyssowski et al.9), and all genes. Boxes range from lower to upper quartile with median line, whiskers extend to min/max data point within 1.5*interquartile range.
Extended Data Fig. 9 |. Verification of the eRNA signature captures enhancer activity dynamics.

a, Genome browser view of ~50 kb window surrounding the Fos gene. Rows from top to bottom present: 1) RNA signal in active neurons from Kim et al. 12, 2) RNA signal in inactive neurons from Kim et al. 12, 3) RNA signal from neurons in the Bic condition, 4) RNA signal from neurons in the TTX condition, 5) H3K27ac ChIP-seq signal from neurons in the Bic condition, 6) H3K27ac ChIP-seq signal from neurons in the TTX condition. b, RNA-seq signatures at enhancers near Fos across 0, 5, 20, 60, and 360 minutes of acute neuron activation.
Extended Data Fig. 10 |. Foxp1 and Slc4a10 fall opposite disease-associated variants in conserved classified loops.

a, Number of loops called in HiC data obtained from human fetal cortical plate (CP) and germinal zone (GZ) tissue (Won et al.41). b, Interaction frequency heatmap (left) and thresholded loop calls (right) of the 2.5 Mb region surrounding the Bdnf gene in human cortical plate (CP) fetal tissue. c–e, Human (c) and mouse (d) interaction frequency heatmaps of a 2 Mb region surrounding the Foxp1 gene. The expression of the looping Foxp1 isoform labeled in green in (d) is plotted in (e). f–h, Human (f) and mouse (g) interaction frequency heatmaps of a < 2 Mb region surrounding the Slc4a10 gene (green), followed by expression of its 5 expressed isoforms (h). N = 3 RNA-seq replicates in (e,h), mean lines plotted.
Supplementary Material
Acknowledgements
We thank members of the Cremins laboratory for helpful discussions. J.E.P.-C. is a New York Stem Cell Foundation Robertson Investigator and an Alfred P. Sloan Foundation Fellow. This research was supported by the New York Stem Cell Foundation (J.E.P.-C.), the US National Institutes of Health (NIH) Director’s New Innovator Award from the National Institute of Mental Health (1DP2MH11024701, J.E.P.-C.), a National Institute of Mental Health grant (R01MH112766, J.D.S.), a Chan Zuckerberg Ben Barres Early Career Acceleration Award (J.D.S.), a 4D Nucleome Common Fund grant (1U01HL12999801, J.E.P.-C.), a joint NSF–NIGMS grant to support research at the interface of the biological and mathematical sciences (1562665, J.E.P.-C.), a Brain Research Foundation Fay Frank Seed Grant (J.E.P.-C.), a National Institute of Neurological Disorders and Stroke grant (R01NS114226, J.E.P.-C. and J.D.S.), and by National Science Foundation Graduate Research Fellowships under grant numbers DGE1321851 (J.A.B.) and DGE-1321851 (L.R.F.).
Footnotes
Competing interests
The authors declare no competing interests.
Additional information
Extended data is available for this paper at https://doi.org/10.1038/s41593-020-0634-6.
Supplementary information is available for this paper at https://doi.org/10.1038/s41593-020-0634-6.
Peer review information Nature Neuroscience thanks Hyejung Won and the other, anonymous, reviewer(s) for their contribution to the peer review of this work.
Publisher’s note Springer Nature remains neutral with regard to jurisdictional claims in published maps and institutional affiliations.
References
- 1.Flavell SW & Greenberg ME Signaling mechanisms linking neuronal activity to gene expression and plasticity of the nervous system. Annu. Rev. Neurosci. 31, 563–590 (2008). [DOI] [PMC free article] [PubMed] [Google Scholar]
- 2.Yap EL & Greenberg ME Activity-regulated transcription: bridging the gap between neural activity and behavior. Neuron 100, 330–348 (2018). [DOI] [PMC free article] [PubMed] [Google Scholar]
- 3.Greenberg ME & Ziff EB Stimulation of 3T3 cells induces transcription of the c-fos proto-oncogene. Nature 311, 433–438 (1984). [DOI] [PubMed] [Google Scholar]
- 4.Muller R, Bravo R, Burckhardt J & Curran T. Induction of c-fos gene and protein by growth factors precedes activation of c-myc. Nature 312, 716–720 (1984). [DOI] [PubMed] [Google Scholar]
- 5.Curran T & Morgan JI Superinduction of c-fos by nerve growth factor in the presence of peripherally active benzodiazepines. Science 229, 1265–1268 (1985). [DOI] [PubMed] [Google Scholar]
- 6.Link W et al. Somatodendritic expression of an immediate early gene is regulated by synaptic activity. Proc. Natl Acad. Sci. USA 92, 5734–5738 (1995). [DOI] [PMC free article] [PubMed] [Google Scholar]
- 7.Lyford GL et al. Arc, a growth factor and activity-regulated gene, encodes a novel cytoskeleton-associated protein that is enriched in neuronal dendrites. Neuron 14, 433–445 (1995). [DOI] [PubMed] [Google Scholar]
- 8.Fowler T, Sen R & Roy AL Regulation of primary response genes. Mol. Cell 44, 348–360 (2011). [DOI] [PMC free article] [PubMed] [Google Scholar]
- 9.Tyssowski KM et al. Different neuronal activity patterns induce different gene expression programs. Neuron 98, 530–546 e511 (2018). [DOI] [PMC free article] [PubMed] [Google Scholar]
- 10.Kawashima T et al. Synaptic activity-responsive element in the Arc/Arg3.1 promoter essential for synapse-to-nucleus signaling in activated neurons. Proc. Natl Acad. Sci. USA 106, 316–321 (2009). [DOI] [PMC free article] [PubMed] [Google Scholar]
- 11.Pintchovski SA, Peebles CL, Kim HJ, Verdin E & Finkbeiner S. The serum response factor and a putative novel transcription factor regulate expression of the immediate-early gene Arc/Arg3.1 in neurons. J. Neurosci. 29, 1525–1537 (2009). [DOI] [PMC free article] [PubMed] [Google Scholar]
- 12.Kim TK et al. Widespread transcription at neuronal activity-regulated enhancers. Nature 465, 182–187 (2010). [DOI] [PMC free article] [PubMed] [Google Scholar]
- 13.Malik AN et al. Genome-wide identification and characterization of functional neuronal activity-dependent enhancers. Nat. Neurosci. 17, 1330–1339 (2014). [DOI] [PMC free article] [PubMed] [Google Scholar]
- 14.Su Y et al. Neuronal activity modifies the chromatin accessibility landscape in the adult brain. Nat. Neurosci. 20, 476–483 (2017). [DOI] [PMC free article] [PubMed] [Google Scholar]
- 15.Schardin M, Cremer T, Hager HD & Lang M. Specific staining of human chromosomes in Chinese hamster x man hybrid cell lines demonstrates interphase chromosome territories. Hum. Genet. 71, 281–287 (1985). [DOI] [PubMed] [Google Scholar]
- 16.Lieberman-Aiden E et al. Comprehensive mapping of long-range interactions reveals folding principles of the human genome. Science 326, 289–293 (2009). [DOI] [PMC free article] [PubMed] [Google Scholar]
- 17.Rao SS et al. A 3D map of the human genome at kilobase resolution reveals principles of chromatin looping. Cell 159, 1665–1680 (2014). [DOI] [PMC free article] [PubMed] [Google Scholar]
- 18.Nora EP et al. Spatial partitioning of the regulatory landscape of the X-inactivation centre. Nature 485, 381–385 (2012). [DOI] [PMC free article] [PubMed] [Google Scholar]
- 19.Dixon JR et al. Topological domains in mammalian genomes identified by analysis of chromatin interactions. Nature 485, 376–380 (2012). [DOI] [PMC free article] [PubMed] [Google Scholar]
- 20.Beagan JA & Phillips-Cremins JE On the existence and functionality of topologically associating domains. Nat. Genet. 52, 8–16 (2020). [DOI] [PMC free article] [PubMed] [Google Scholar]
- 21.Phillips-Cremins JE et al. Architectural protein subclasses shape 3D organization of genomes during lineage commitment. Cell 153, 1281–1295 (2013). [DOI] [PMC free article] [PubMed] [Google Scholar]
- 22.Phanstiel DH et al. Static and dynamic DNA loops form AP-1-bound activation hubs during macrophage development. Mol. Cell 67, 1037–1048 e1036 (2017). [DOI] [PMC free article] [PubMed] [Google Scholar]
- 23.Gabriele M et al. YY1 Haploinsufficiency causes an intellectual disability syndrome featuring transcriptional and chromatin dysfunction. Am. J. Hum. Genet. 100, 907–925 (2017). [DOI] [PMC free article] [PubMed] [Google Scholar]
- 24.Gregor A et al. De novo mutations in the genome organizer CTCF cause intellectual disability. Am. J. Hum. Genet. 93, 124–131 (2013). [DOI] [PMC free article] [PubMed] [Google Scholar]
- 25.Hirayama T, Tarusawa E, Yoshimura Y, Galjart N & Yagi T. CTCF is required for neural development and stochastic expression of clustered Pcdh genes in neurons. Cell. Rep. 2, 345–357 (2012). [DOI] [PubMed] [Google Scholar]
- 26.Yamada T et al. Sensory experience remodels genome architecture in neural circuit to drive motor learning. Nature 569, 708–713 (2019). [DOI] [PMC free article] [PubMed] [Google Scholar]
- 27.Beagan JA et al. YY1 and CTCF orchestrate a 3D chromatin looping switch during early neural lineage commitment. Genome Res 27, 1139–1152 (2017). [DOI] [PMC free article] [PubMed] [Google Scholar]
- 28.Beagan JA et al. Local genome topology can exhibit an incompletely rewired 3D-folding state during somatic cell reprogramming. Cell Stem. Cell 18, 611–624 (2016). [DOI] [PMC free article] [PubMed] [Google Scholar]
- 29.Kim JH et al. 5C-ID: increased resolution chromosome-conformation-capture-carbon-copy with in situ 3C and double alternating primer design. Methods 142, 39–46 (2018). [DOI] [PMC free article] [PubMed] [Google Scholar]
- 30.Straughan DW, Neal MJ, Simmonds MA, Collins GG & Hill RG Evaluation of bicuculline as a GABA antagonist. Nature 233, 352–354 (1971). [DOI] [PubMed] [Google Scholar]
- 31.Narahashi T, Moore JW & Scott WR Tetrodotoxin blockage of sodium conductance increase in lobster giant axons. J. Gen. Physiol. 47, 965–974 (1964). [DOI] [PMC free article] [PubMed] [Google Scholar]
- 32.Shepherd JD & Huganir RL The cell biology of synaptic plasticity: AMPA receptor trafficking. Annu. Rev. Cell Dev. Biol. 23, 613–643 (2007). [DOI] [PubMed] [Google Scholar]
- 33.Bonev B et al. Multiscale 3D genome rewiring during mouse neural development. Cell 171, 557–572 e524 (2017). [DOI] [PMC free article] [PubMed] [Google Scholar]
- 34.Gilgenast TG & Phillips-Cremins JE Systematic evaluation of statistical methods for identifying looping interactions in 5C data. Cell Syst. 8, 197–211 e113 (2019). [DOI] [PMC free article] [PubMed] [Google Scholar]
- 35.Fernandez LR, Gilgenast TG & Phillips-Cremins JE 3DeFDR: Identifying cell type-specific looping interactions with empirical false discovery rate guided thresholding. Preprint at bioRxiv 10.1101/501056 (2018). [DOI] [Google Scholar]
- 36.Joo JY, Schaukowitch K, Farbiak L, Kilaru G & Kim TK Stimulus-specific combinatorial functionality of neuronal c-fos enhancers. Nat. Neurosci. 19, 75–83 (2016). [DOI] [PMC free article] [PubMed] [Google Scholar]
- 37.Fulco CP et al. Activity-by-contact model of enhancer-promoter regulation from thousands of CRISPR perturbations. Nat. Genet. 51, 1664–1669 (2019). [DOI] [PMC free article] [PubMed] [Google Scholar]
- 38.Schizophrenia Working Group of the Psychiatric Genomics Consortium Biological insights from 108 schizophrenia-associated genetic loci. Nature 511, 421–427 (2014). [DOI] [PMC free article] [PubMed] [Google Scholar]
- 39.Autism Spectrum Disorders Working Group of The Psychiatric Genomics Consortium Meta-analysis of GWAS of over 16,000 individuals with autism spectrum disorder highlights a novel locus at 10q24.32 and a significant overlap with schizophrenia. Mol. Autism 8, 21 (2017). [DOI] [PMC free article] [PubMed] [Google Scholar]
- 40.Maurano MT et al. Systematic localization of common disease-associated variation in regulatory DNA. Science 337, 1190–1195 (2012). [DOI] [PMC free article] [PubMed] [Google Scholar]
- 41.Won H et al. Chromosome conformation elucidates regulatory relationships in developing human brain. Nature 538, 523–527 (2016). [DOI] [PMC free article] [PubMed] [Google Scholar]
- 42.Pers TH, Timshel P & Hirschhorn JN SNPsnap: a web-based tool for identification and annotation of matched SNPs. Bioinformatics 31, 418–420 (2015). [DOI] [PMC free article] [PubMed] [Google Scholar]
- 43.Finucane HK et al. Partitioning heritability by functional annotation using genome-wide association summary statistics. Nat. Genet. 47, 1228–1235 (2015). [DOI] [PMC free article] [PubMed] [Google Scholar]
- 44.Araujo DJ et al. Foxp1 in forebrain pyramidal neurons controls gene expression required for spatial learning and synaptic plasticity. J. Neurosci. 37, 10917–10931 (2017). [DOI] [PMC free article] [PubMed] [Google Scholar]
- 45.Sinning A, Liebmann L & Hubner CA Disruption of Slc4a10 augments neuronal excitability and modulates synaptic short-term plasticity. Front. Cell. Neurosci. 9, 223 (2015). [DOI] [PMC free article] [PubMed] [Google Scholar]
- 46.Krietenstein N et al. Ultrastructural details of mammalian chromosome architecture. Preprint at bioRxiv 10.1101/639922 (2019). [DOI] [PMC free article] [PubMed] [Google Scholar]
- 47.Luscher C & Malenka RC NMDA receptor-dependent long-term potentiation and long-term depression (LTP/LTD). Cold Spring Harb. Perspect. Biol. 4, a005710 (2012). [DOI] [PMC free article] [PubMed] [Google Scholar]
- 48.Sun JH et al. Disease-associated short tandem repeats co-localize with chromatin domain boundaries. Cell 175, 224–238.e15 (2018). [DOI] [PMC free article] [PubMed] [Google Scholar]
- 49.Norton HK & Phillips-Cremins JE Crossed wires: 3D genome misfolding in human disease. J. Cell Biol. 216, 3441–3452 (2017). [DOI] [PMC free article] [PubMed] [Google Scholar]
- 50.Pimentel H, Bray NL, Puente S, Melsted P & Pachter L. Differential analysis of RNA-seq incorporating quantification uncertainty. Nat. Methods 14, 687–690 (2017). [DOI] [PubMed] [Google Scholar]
- 51.Shepherd JD et al. Arc/Arg3.1 mediates homeostatic synaptic scaling of AMPA receptors. Neuron 52, 475–484 (2006). [DOI] [PMC free article] [PubMed] [Google Scholar]
- 52.Langmead B. Aligning short sequencing reads with Bowtie. Curr. Protoc. Bioinformatics Ch. 11, 11.17 (2010). [DOI] [PMC free article] [PubMed] [Google Scholar]
- 53.Zhang Y et al. Model-based analysis of ChIP-Seq (MACS). Genome Biol. 9, R137 (2008). [DOI] [PMC free article] [PubMed] [Google Scholar]
- 54.Ramirez F et al. deepTools2: a next generation web server for deep-sequencing data analysis. Nucleic Acids Res. 44, W160–W165 (2016). [DOI] [PMC free article] [PubMed] [Google Scholar]
- 55.Hnisz D et al. Activation of proto-oncogenes by disruption of chromosome neighborhoods. Science 351, 1454–1458 (2016). [DOI] [PMC free article] [PubMed] [Google Scholar]
- 56.Kim JH et al. LADL: light-activated dynamic looping for endogenous gene expression control. Nat. Methods 16, 633–639 (2019). [DOI] [PMC free article] [PubMed] [Google Scholar]
- 57.Phillips-Cremins JE Unraveling architecture of the pluripotent genome. Curr. Opin. Cell Biol. 28, 96–104 (2014). [DOI] [PubMed] [Google Scholar]
- 58.Lajoie BR, van Berkum NL, Sanyal A & Dekker J. My5C: web tools for chromosome conformation capture studies. Nat. Methods 6, 690–691 (2009). [DOI] [PMC free article] [PubMed] [Google Scholar]
- 59.Imakaev M et al. Iterative correction of Hi-C data reveals hallmarks of chromosome organization. Nat. Methods 9, 999–1003 (2012). [DOI] [PMC free article] [PubMed] [Google Scholar]
- 60.Patro R, Duggal G, Love MI, Irizarry RA & Kingsford C. Salmon provides fast and bias-aware quantification of transcript expression. Nat. Methods 14, 417–419 (2017). [DOI] [PMC free article] [PubMed] [Google Scholar]
- 61.Dobin A et al. STAR: ultrafast universal RNA-seq aligner. Bioinformatics 29, 15–21 (2013). [DOI] [PMC free article] [PubMed] [Google Scholar]
- 62.Langmead B & Salzberg SL Fast gapped-read alignment with Bowtie 2. Nat. Methods 9, 357–359 (2012). [DOI] [PMC free article] [PubMed] [Google Scholar]
- 63.Servant N et al. HiC-Pro: an optimized and flexible pipeline for Hi-C data processing. Genome Biol. 16, 259 (2015). [DOI] [PMC free article] [PubMed] [Google Scholar]
- 64.Durand NC et al. Juicer provides a one-click system for analyzing loop-resolution Hi-C experiments. Cell Syst. 3, 95–98 (2016). [DOI] [PMC free article] [PubMed] [Google Scholar]
- 65.Wang J, Vasaikar S, Shi Z, Greer M & Zhang B. WebGestalt 2017: a more comprehensive, powerful, flexible and interactive gene set enrichment analysis toolkit. Nucleic Acids Res. 45, W130–W137 (2017). [DOI] [PMC free article] [PubMed] [Google Scholar]
- 66.Arnold M, Raffler J, Pfeufer A, Suhre K & Kastenmuller G. SNiPA: an interactive, genetic variant-centered annotation browser. Bioinformatics 31, 1334–1336 (2015). [DOI] [PMC free article] [PubMed] [Google Scholar]
- 67.Bulik-Sullivan BK et al. LD Score regression distinguishes confounding from polygenicity in genome-wide association studies. Nat. Genet. 47, 291–295 (2015). [DOI] [PMC free article] [PubMed] [Google Scholar]
- 68.International HapMap C et al. Integrating common and rare genetic variation in diverse human populations. Nature 467, 52–58 (2010). [DOI] [PMC free article] [PubMed] [Google Scholar]
- 69.Genomes Project C et al. An integrated map of genetic variation from 1,092 human genomes. Nature 491, 56–65 (2012). [DOI] [PMC free article] [PubMed] [Google Scholar]
Associated Data
This section collects any data citations, data availability statements, or supplementary materials included in this article.
Supplementary Materials
Data Availability Statement
We have uploaded all data from this manuscript to the Gene Expression Omnibus (GEO) under accession number GSE131025.