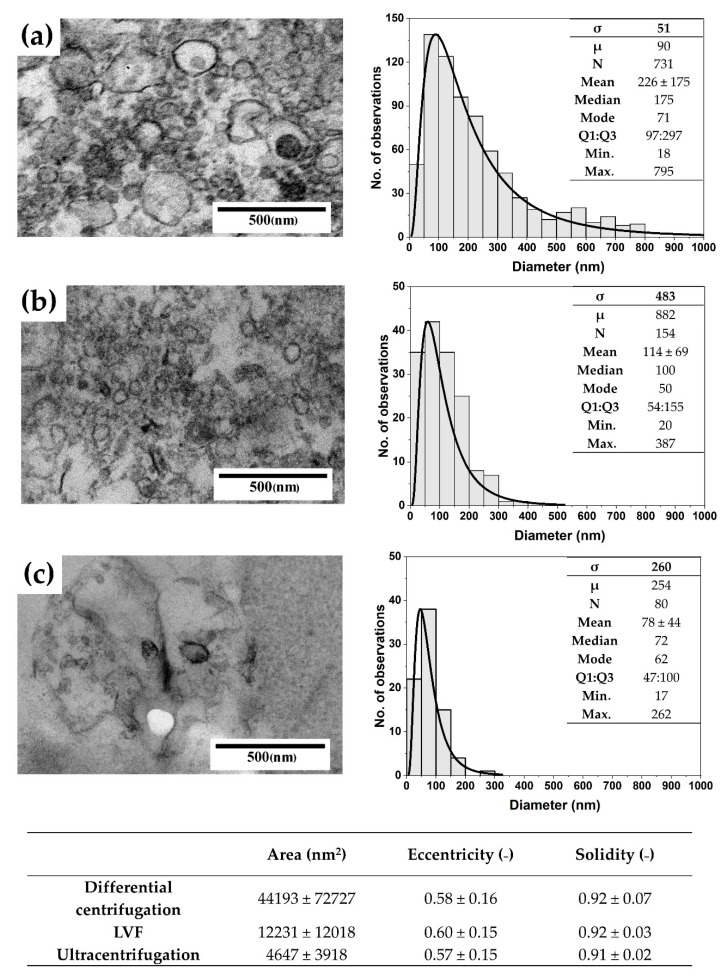
Figure 4.
Representative TEM images and size distributions, with the log-normal fit parameters, for the EVs isolated using (a) differential centrifugation; (b) LVF; (c) Ultracentrifugation. The table below the images presents the mean area, eccentricity and solidity of the EVs obtained using these three isolation methods.

