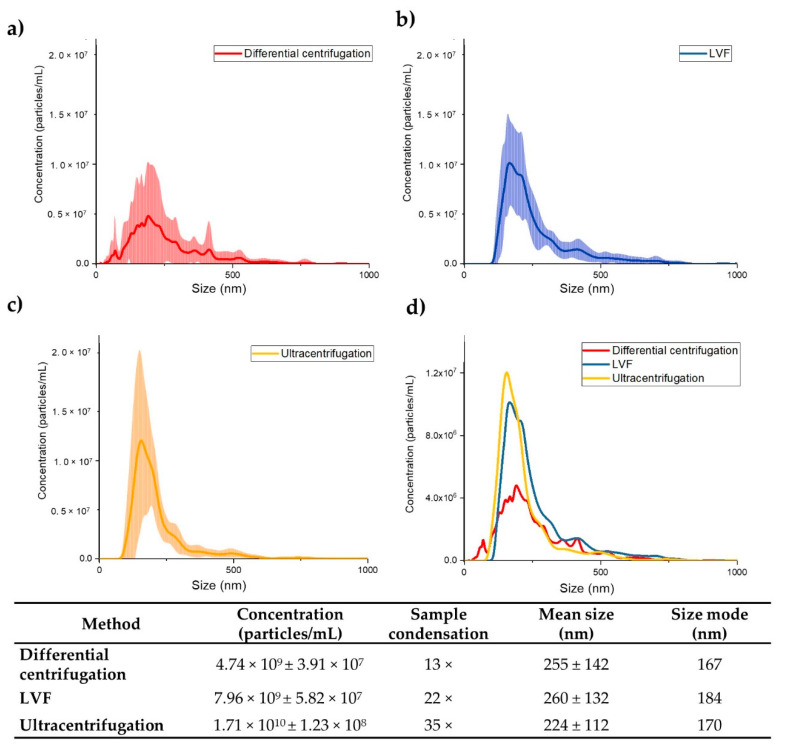
Figure 5.
Results of the Nanoparticle Tracking Analysis (NTA). (a) Differential centrifugation; (b) LVF; (c) Ultracentrifugation; (d) Comparison of the isolation methods tested. The lines indicate the mean concentrations (line) of the three samples. Each sample was recorded for 30 s and the measurement was repeated 5 times. The SDs of the three independent measurements are presented as the colored areas around the mean concentration line. The table presents the average concentrations of EVs in the samples after isolation; sample condensation, defined as the relative increase in the number of EVs in the sample after isolation compared to their concentration in the starting samples; the average EV diameter; and the size mode.

