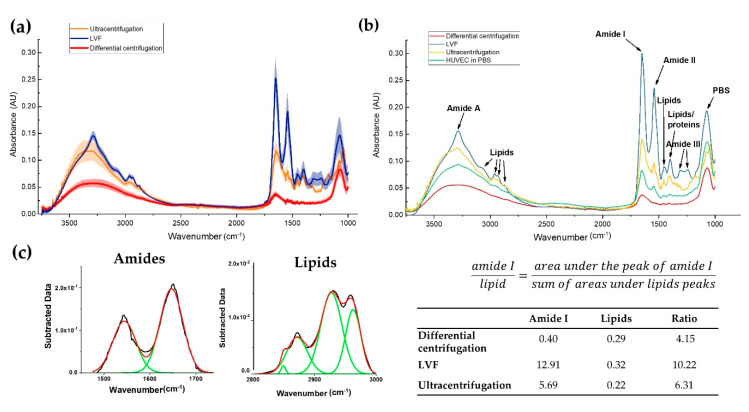
Figure 6.
Results of the FTIR analysis. (a) Average infrared spectra for EVs isolated with the tested methods (line) with the SD of three independent measurements (upper and lower edges of the colored areas); (b) Comparison of the EVs spectra with the spectra of HUVEC cells with the assignment of the main peaks; (c) Example of the Gaussian function fitting for amide I/lipids ratio calculation with results (see the table). HUVEC: human umbilical endothelial vein cells.

