Abstract
BACKGROUND
Chronic pancreatitis is associated with pancreatic cancer (PC), although the relationship between acute pancreatitis (AP) and the risk of PC remains unclear due to inconsistent and contradictory results.
AIM
To conduct a meta-analysis of retrospective and prospective studies to explore the association between AP and PC risk.
METHODS
We first searched original articles on the association of AP with PC using PubMed, Web of Science, Cochrane, and EMBASE databases. Then we calculated the combined overall effect estimates (EEs) between AP and PC risk at a 95% confidence interval (CI) deploying a random-effects model, and assessed heterogeneity using the I2 test. The combined relative risk with 95%CI was performed to examine the relationship between AP and PC. Publication bias and subgroup analyses were also conducted. Furthermore, we performed sensitivity analysis to explain this heterogeneity.
RESULTS
Eleven studies were eligible for inclusion standards in this meta-analysis, resulting in pooled EEs of 2.07 (95%CI: 1.36-2.78) for AP and PC risk. Additionally, five prospective cohort studies reported 103961 patients in the AP group, relative to 1442158 subjects in the control group, with a pooled relative risk of 7.81 (95%CI: 5.00-12.19). We also performed subgroup analyses using different follow-up times and type of research methods (case-control or cohort). Results from analyses of different follow-up times revealed the following pooled effect values: 1-year lag period (EEs = 23.47, 95%CI: 3.26-43.68), 2-year lag period (EEs = 9.82, 95%CI: 3.01-16.64), 5-year lag period (EEs = 2.47, 95%CI: 1.93-3.02), 10-year lag period (EEs = 1.69, 95%CI: 1.26-2.11), and > 10-year lag period (EEs = 1.17, 95%CI: 0.78-1.57). With regards to the methods, the case-control studies recorded EEs = 3.03 (95%CI: -1.02 to 7.08), whereas cohort studies had EEs = 2.09 (95%CI: 1.22-2.97) pooled effect values.
CONCLUSION
Overall, our findings indicated an association between AP and PC risk. Based on subgroup analyses, AP is unlikely to be a causal factor for PC.
Keywords: Acute pancreatitis, Pancreatic cancer, Meta-analysis
Core Tip: It is well-known that acute pancreatitis (AP) might be the earliest clinical presentation of pancreatic cancer (PC). However, the relationship between AP and the risk of PC remains unclear due to inconsistent and contradictory results. In the current study, we conducted a meta-analysis of retrospective and prospective studies to explore the association between AP and PC risk. Our findings suggest that AP might not be a direct cause of PC risk, but its occurrence could be an indicator of PC. Future studies are expected to analyze the association between AP and PC risk across different follow-up times in order to improve early PC identification. Overall, more focus should be directed towards improving PC prevention approaches, of which a key element is early screening for patients at the onset of AP.
INTRODUCTION
Considerable progress in the management of pancreatic cancer (PC) has been made using surgery, chemotherapy, and other fields[1], although the long-term survival of PC patients remains unsatisfactory. According to the latest research statistics from the National Cancer Center, the 5-year survival rate of patients with PC is only 7.2%[2]. At the time of diagnosis, many patients’ symptoms cannot be resolved because they are advanced or irreversible[3]. PC has therefore become a major cause of cancer-related deaths worldwide, with a poor prognosis[4,5]. Curative-intent surgery remains the only approach for increasing the survival rates of PC patients. However, fewer than 20% of PC patients are eligible for surgery after diagnosis, due to local disease progression and metastasis[4]. Avoiding risk factors as well as early diagnosis are therefore the most essential ways to improve the survival of PC patients.
Previous studies have revealed several risk factors for PC including diabetes[6], smoking[7] and chronic pancreatitis[8]. However, the relationship between PC and acute pancreatitis (AP) remains unclear. AP is one of the most common gastrointestinal diseases that requires hospitalization of the patients[9]. The condition is also more likely to be exhibited at the onset of PC[10]. Consequently, PC patients who initially exhibit AP are likely to be diagnosed early, thereby contributing to a better prognosis. Generally, AP patients develop chronic pancreatitis. Research evidence has shown that chronic pancreatitis is one of the risk factors for PC[8], plausibly suggesting that AP may also be a risk factor for PC. Moreover, an animal model implicated AP in the induction of brief inflammation, which enhances the risk of PC[11,12]. However, outcomes from different studies have been either inconsistent or conflicting[13,14]. Therefore, the current meta-analysis was performed to evaluate the association between AP and the risk of PC.
MATERIALS AND METHODS
Search strategy
A comprehensive literature search was performed to identify original articles describing the analysis of the association between AP and PC across PubMed, Web of Science, MEDLINE, and EMBASE databases. A variably combined text and MeSH heading search strategy was used to select studies. This meta-analysis conformed to the guidelines of the Observational Studies in Epidemiology[15] and included the following terms: (“AP”) and (“PC” or “pancreatic neoplasm” or “pancreatic tumor” or “pancreatic tumor” or “pancreatic carcinoma” or “pancreatic malignancy” or “pancreatic adenocarcinoma”) and (“prospective” or “cohort” or “retrospective” or “case-control”). Articles published between establishment of databases and April 1, 2020 were retrieved for analysis. Reference lists comprising relevant review papers and related articles were simultaneously collected for further inclusion. All references are published, comprehensive studies. There were no language restrictions applied during screen or selection process of studies.
Inclusion and exclusion criteria
We included all eligible studies if they met the following standards: (1) were retrospective or prospective studies; (2) Examined an association between AP and subsequent PC; (3) Were population-based reports; and (4) Provided relevant data for this meta-analysis. Conversely, studies were ineligible for inclusion according to the following standards: (1) Low-quality articles; (2) Clinical trials, commentaries, meta-analysis, letters, reviews, or conference abstracts; and (3) Articles without critical data that could be used.
Data extraction
Studies screened by two reviewers (Liu J and Wang Y) independently based on the inclusion and exclusion standards by reading the titles and abstracts and examined their eligibility. After excluding ineligible studies preliminarily, we read the entire article and extracted key data from eligible studies. The following items were collected and recorded for each included study: Study design, name of the first author, country, year of publication, age, ratio of males to females, the period of enrollment, numbers of AP and PC, effect values, including standardized incidence ratio (SIR), relative risk (RR), hazard ratio (HR), and odds ratio (OR), as well as covariates used for adjustment or not. Any discrepancies between the two reviewers were settled by a third reviewer (Yu Y).
Quality assessment
Newcastle-Ottawa scale[16], a tool that provides a comprehensive score system with eight items for both case-control and cohort studies, is adopted for assessing the methodological quality of included studies. Quality assessment items for case-control studies include: Adequate definition of patient cases (0-1 point), representativeness of patients’ cases (0-1 point), selection of controls (0-1 point), and definition of controls (0-1 point). Other items include comparison control for important or additional factors (0-2 point), ascertaining exposure (0-1 point), same method of for assessment of participants (0-1 point) and non-response rate (0-1 point). On the other hand, quality assessment items for cohort studies include: The level of representativeness of the exposed cohort (0-1 point), selection of a non-exposed cohort (0-1 point), ascertaining exposure (0-1 point), assessing outcomes of interest not presented at the start of the study (0-1 point), design- or analysis-based comparisons (0-2 point), period of follow-up that allows outcomes to occur (0-1 point), assessment of outcomes (0-1 point) and adequate evaluation of follow-up of cohorts (0-1 point). The total score was calculated by adding up all points of each item. Only studies with a score of 6 or higher were considered to be high-quality methodological studies and included in this meta-analysis.
Statistical analysis
As PC is rare in the population, we ignored the distinctions between different risk estimates in terms of OR, RR, HR, SIR[17]. To determine the effect of AP on the risk of developing PC, a random-effects model was deployed for calculating pooled overall effect estimates (EEs) with 95% confidence intervals (CIs), and the effect values were extracted from included studies according to the longest follow-up time. The pooled RR with 95%CI was performed to examine the relationship between AP and PC. If a study had different effect measures, between AP and PC, the results of each effect value were considered a single effect value before inclusion in this meta-analysis. Cochran’s Q statistic was used for assessing heterogeneity, with a P value less than 0.10 to infer significance. Furthermore, the heterogeneity was graded using the I2 statistic, with 25%, 50% and 75% denoting low, moderate and high levels of heterogeneity, respectively[18]. Subgroup analyses were performed according to different follow-up times, and the type of research method (case-control or cohort). Sensitivity analyses were conducted to investigate the robustness of our meta-analysis and Egger’s test and funnel plots was used to assess the risk publication bias[19]. To correct and identify the asymmetry of the funnel plot caused by publication bias, the trim and fill method was performed. All statistical analyses were conducted using STATA 12.0 (StataCorp, College Station, TX, United States).
RESULTS
Studies included
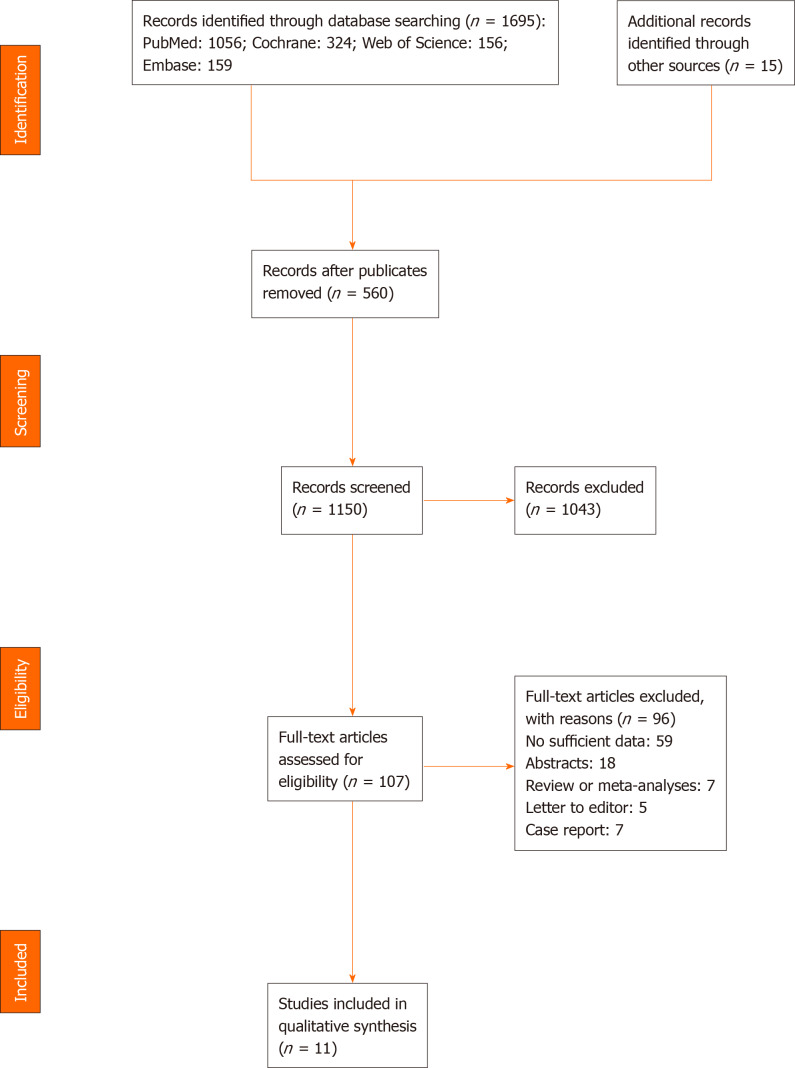
Databases and manual searches identified a total of 1695 studies. Specifically, PubMed accounted for 1056, Cochrane had 324, Web of Science resulted in 156, Embase yielded 159, whereas manual search produced 15 studies. After removal of duplicate studies (n = 560) and screening of the remaining 1150, a total of 1043 articles failed to meet the inclusion criteria due to unqualified titles and/or abstracts. The remaining 107 studies were subsequently examined for eligibility as per the aforementioned inclusion standards by reading full-text articles; 97 were excluded for various reasons. Among the 97 studies, 59 lacked sufficient data, 7 were case reports, 5 were letters or comments, 18 only had abstracts, and 7 were reviews or meta-analyses. Finally, 11 studies were included in this meta-analysis. A summary of the retrieval process is outlined in Figure 1.
Figure 1.
Flow diagram representing the selection of studies.
Study characteristics and quality assessment
The 11 studies included were prospective or retrospective in design, and were published between 1994 to 2018. Among these studies, three (each) were conducted in the United States and Sweden, two were from China, and a single study (each) was conducted in Britain, the Netherlands, and Denmark. The risk effect measures for two studies were RR, two studies were OR, three studies were SIR, and four studies were HR. A detailed description of the study characteristics is presented in Table 1[10,13,14,20-27], while an outline of the quality ratings across each study is recorded in Table 2. In general, the methodological quality was fair for the included studies, with all 11 studies considered high quality with a score of 6 or higher.
Table 1.
Demographics and characteristics of studies included in this meta-analysis
| Ref. | Country | M/F ratio | Age, mean or median | Period of recruitment | PC cases/AP cases | AP verification | PC verification | Effect value and 95%CI |
| Cohort studies | ||||||||
| Rijkers et al[20], 2017 | Netherlands | 1.19 | 58.0 | 2004-2007 | 5/731 | Clinical evaluation | Clinical evaluation | SIR 1.1 (0.3-3.3) |
| Kirkegård et al[21], 20181 | Denmark | 1.21 | 55.8 | 1980-2013 | 937/41669 | ICD code | ICD code | HR 2.02 (1.57-2.61)2 |
| Pang et al[22], 20181 | China | 0.69 | 51.5 | 2004-2008 | 13/1066 | ICD code | ICD code | HR 9.99 (3.20-31.16)2 |
| Munigala et al[23], 20141 | United States | 13.29 | 57.0 | 1998-2000 | 86/5720 | ICD code | ICD code | RR 1.05 (0.14-7.68)2 |
| Chung et al[24], 20121 | China | 1.96 | > 40 | 2000-2003 | 11/747 | ICD code | ICD code | HR 9.10 (3.81-21.76) |
| Ekbom et al[25], 1994 | Sweden | 1.19 | 55.6 | 1965-1983 | NA/NA | ICD code | ICD code | SIR 0.9 (0.2-2.5)2 |
| Sadr-Azodi et al[10], 20181 | Sweden | 1.06 | 62.0 | 1997-2013 | 536/49749 | ICD code | ICD code | HR 1.24 (0.68-2.25)2 |
| Goldacre et al[26], 20081 | Britain | 0.88 | NA | 1963-1999 | 91/24993 | ICD code | ICD code | RR 5.70 (4.54-7.08) |
| Karlson et al[14], 19971 | Sweden | 1.49 | 54.5 | 1965-1983 | 152/24753 | ICD code | ICD code | SIR 1.6 (1.3-2.0)2 |
| Case-control studies | ||||||||
| Bansal et al[27], 19951 | United States | NA | 57.0 | 1988-1992 | 2639/64 | ICD code | ICD code | OR 1.76 (1.28-2.41) |
| Duell et al[13], 20061 | United States | NA | > 21 | 1995-1999 | 308/16 | Self-reported (physician diagnosed) | Pathology+ physician reported | OR 6.4 (2.7-15) |
Effect values in the study have matched/adjustment variables.
Effect values are extracted from included studies according to the longest follow-up time. AP: Acute pancreatitis; CI: Confidence interval; F: Female; HR: Hazard ratio; ICD: International Classification of Diseases; M: Male; OR: Odds ratio; PC: Pancreatic cancer; RR: Relative risk; SIR: Standardized incidence ratio.
Table 2.
Quality assessment of included studies in this meta-analysis
| Ref. | Representativeness of the exposed cohort | Selection of the non-exposed cohort | Ascertainment of exposure | Outcome of interest was not present at start of study | Based on the design or analysis | Assessment of outcome | Follow-up long enough for outcomes to occur | Adequacy of follow-up of cohorts | Overall Score | |
| Cohort studies | Rijkers et al[20], 2017 | 1 | 0 | 1 | 1 | 2 | 1 | 1 | 1 | 8 |
| Kirkegård et al[21], 2018 | 1 | 0 | 1 | 1 | 2 | 1 | 1 | 1 | 8 | |
| Pang et al[22], 2018 | 1 | 1 | 1 | 1 | 2 | 1 | 1 | 1 | 9 | |
| Munigala et al[23], 2014 | 1 | 0 | 1 | 1 | 2 | 1 | 1 | 1 | 8 | |
| Chung et al[24], 2012 | 1 | 1 | 1 | 1 | 2 | 1 | 1 | 1 | 9 | |
| Ekbom et al[25], 1994 | 1 | 0 | 1 | 1 | 2 | 1 | 1 | 1 | 8 | |
| Sadr-Azodi et al[10], 2018 | 1 | 1 | 1 | 1 | 2 | 1 | 1 | 1 | 9 | |
| Goldacre et al[26], 2008 | 1 | 1 | 1 | 1 | 2 | 0 | 1 | 1 | 8 | |
| Karlson et al[14], 1997 | 1 | 0 | 1 | 1 | 2 | 1 | 1 | 1 | 8 | |
| Case-control studies | Bansal et al[27], 1995 | 1 | 1 | 1 | 1 | 2 | 1 | 1 | 0 | 8 |
| Duell et al[13], 2006 | 0 | 1 | 1 | 1 | 2 | 0 | 1 | 0 | 6 |
AP and PC risk
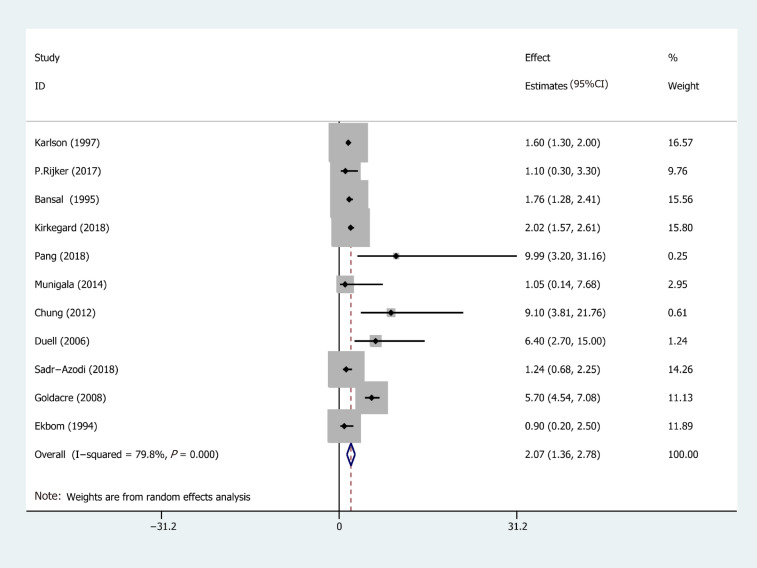
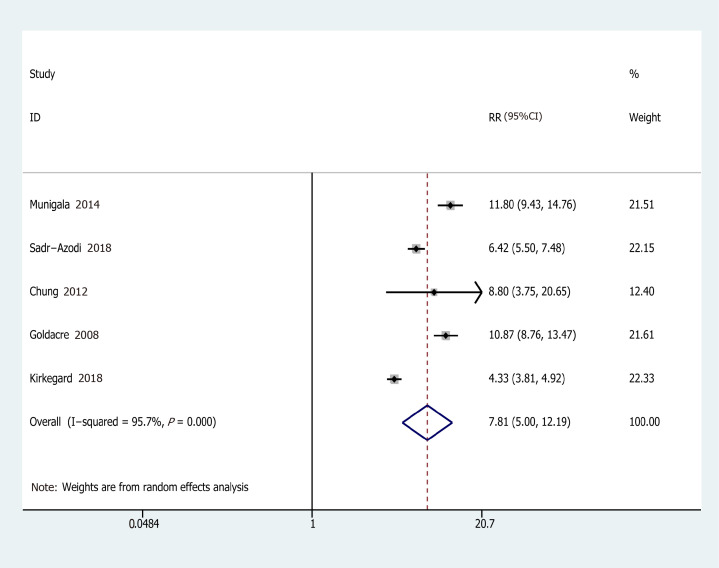
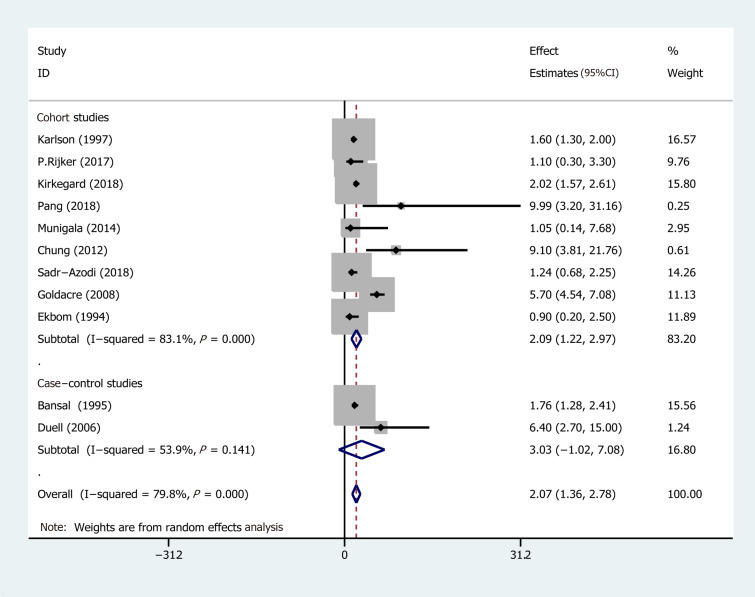
Eleven studies from ten studies exhibited the EEs of PC in AP (Figure 2). We recorded a pooled EEs for AP and PC risk 2.07 (95%CI: 1.36-2.78), and statistically significant heterogeneity of I2 = 78.9% (P < 0.001). Consequently, the random-effects model was used for our meta-analysis. Furthermore, five prospective cohort studies, comprising 103961 patients in the AP group and 1442158 subjects in the control group (the number of patients is recorded in Supplementary Table 1), were included in the analysis to assess the relationship between AP and PC. Their pooled RR was 7.81 (95%CI: 5.00-12.19) based on the random-effects model (Figure 3).
Figure 2.
Forest plot of the risk of pancreatic cancer associated with acute pancreatitis. Hollow diamonds represent pooled effect estimates.
Figure 3.
Forest plot of the association of acute pancreatitis and pancreatic cancer. Hollow diamonds represent pooled relative risk.
Subgroup analysis
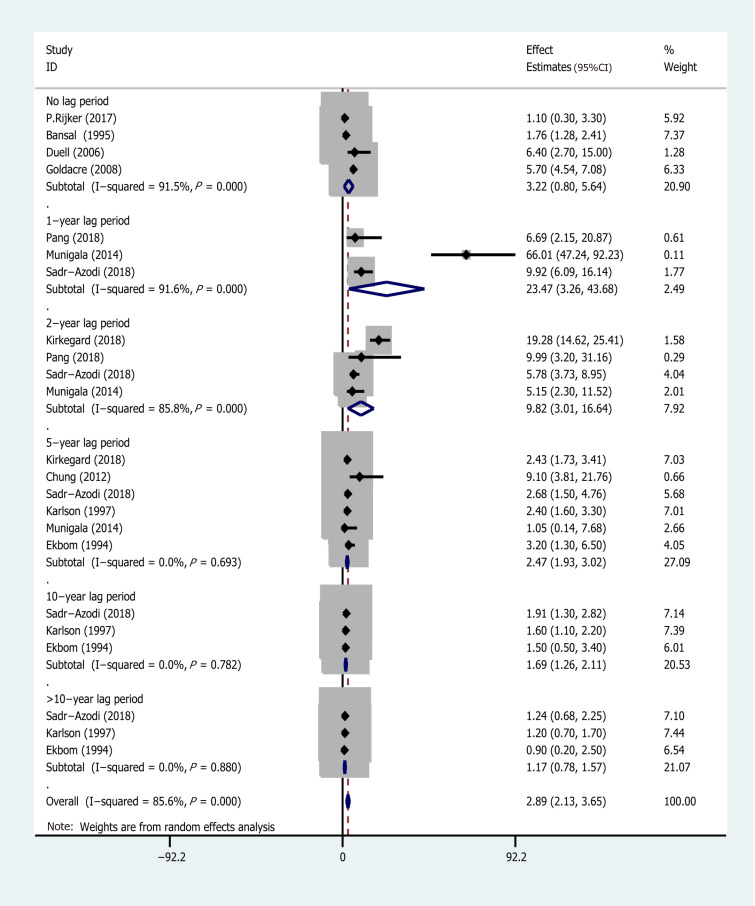
Subgroup analyses were conducted based on different follow-up times (the risk estimates of the different follow-up times are recorded in Supplementary Table 2) and the type of research methods (case-control or cohort). Pooled effect values were: 1-year lag period (EEs = 23.47, 95%CI: 3.26-43.68), 2-year lag period (EEs = 9.82, 95%CI: 3.01-16.64), 5-year lag period (EEs = 2.47, 95%CI: 1.93-3.02), 10-year lag period (EEs = 1.69, 95%CI: 1.26-2.11), and > 10-year lag period (EEs = 1.17, 95%CI: 0.78-1.57), indicating that the association between AP and PC risk diminishes with long-term follow-up (The forest plot is described in Figure 4). On the other hand, the pooled effects value for case-control studies was EEs = 3.03 (95%CI: -1.02 to 7.08, P = 0.141), whereas that for cohort studies was 2.09 (95%CI: 1.22-2.97) (Figure 5). Based on subgroup analysis, case-control studies demonstrated a stronger association between AP and PC risk than cohort studies.
Figure 4.
Subgroup analysis for different follow-up times. AP: Acute pancreatitis; CI: Confidence interval; EEs: Effect estimates; PC: Pancreatic cancer.
Figure 5.
Subgroup analysis for the type of research method.
Publication bias and sensitivity analysis
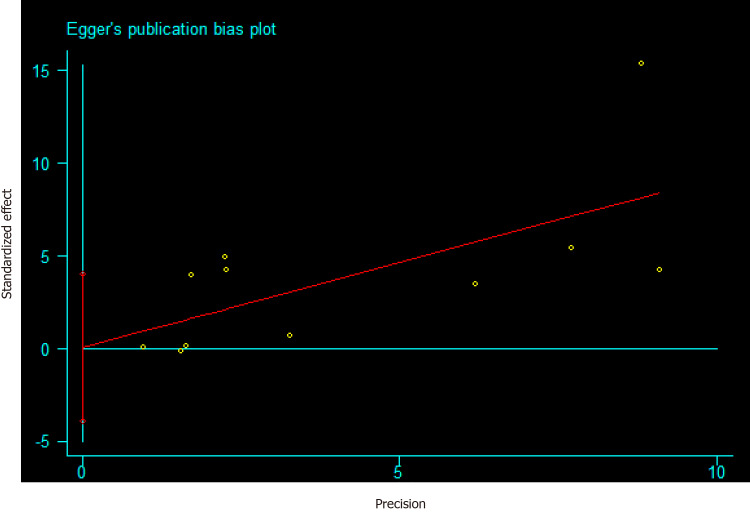
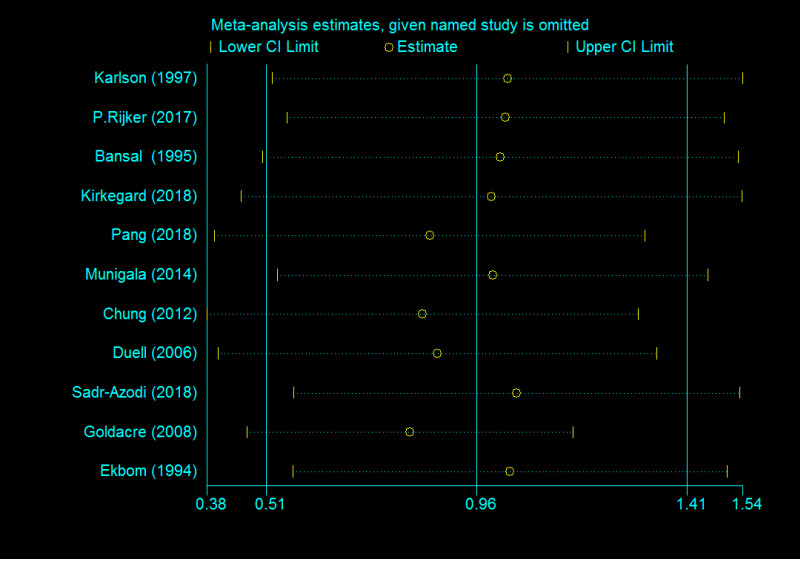
The funnel plot depicted no obvious publication bias and result from Egger’s test gave no evidence of publication bias (P = 0.106) in the association between AP and PC (Supplementary Figure 1). Meanwhile, a publication bias (P = 0.025) was recorded for developing AP in PC risk (Figure 6). Calculations using the trim and fill method, revealed no increase in heterogeneity and variance between studies, indicating that there was no missing literature, hence the publication bias could be ignored. After the trimming and filling method, the results of the funnel plot are shown in Supplementary Figure 2. Furthermore, we performed a sensitivity analysis to explain this heterogeneity. We found that the association of AP with PC risk had a significant influence on the result of the pooled EEs in the two studies[24,26] (Figure 7).
Figure 6.
Risk of publication bias for developing acute pancreatitis in pancreatic cancer risk based on the Egger’s test.
Figure 7.
Sensitivity analysis of included studies for developing acute pancreatitis in pancreatic cancer risk.
DISCUSSION
Previous studies have reported meta-analyses of the relationship between AP and PC[28]. However, these studies only analyzed differences in the number of patients between exposure and control groups, but not the pooled effect value. Based on this, we hypothesized that this does not adequately describe the relationship between AP and PC, hence the need for a comprehensive meta-analysis. Our current study is the first meta-analysis to summarize all current studies (case-control and cohort), to demonstrate the existence of an association between AP and PC (EE: 2.07; 95%CI: 1.36-2.78). Interestingly, our subgroup analysis revealed a strong association between AP and PC risk within 1 year from AP diagnosis (EEs = 23.47, 95%CI: 3.26-43.68) and declined with long-term follow-up. Subsequently, it did not reveal an association between AP and PC over the 10-year follow-up period. For example, Kirkegård et al[8] conducted a meta-analysis and confirmed that chronic pancreatitis increased the risk of PC (EE: 16.60; 95%CI: 12.59-20.73), and found a diminishing association with long-term follow-up. Similarly, Tong et al[29] reported a pooled OR of 7.05 (95%CI: 6.42-7.75) between pancreatitis and PC risk, and found that AP was also associated with PC (pooled OR = 2.12; 95%CI: 1.59-2.83) based on a meta-analysis of two case-control studies. Our study demonstrated almost the same association between AP and PC risk based on the results from 11 studies including cohort and case-control studies.
Chung et al[24] investigated the risk of PC after AP in the Chinese population. During the 5-year follow-up of 747 patients with AP, 11 developed PC (1.47%) compared with 10 patients who developed PC in the 5976 controls (0.17%), suggesting that patients with AP have a 9-fold greater risk of developing PC (HR = 9.10; 95%CI: 3.81-21.76) after 5 years from AP diagnosis. In another study, Goldacre et al[26] reported an association between AP and PC risk in a British matched cohort study. Although chronic pancreatitis is more closely associated with PC than acute pancreatitis, the EE of 27.0 (95%CI: 21.4-33.8) vs 5.7 (95%CI: 4.54-7.08), the relationship between AP and PC cannot be ignored. Similarly, 731 patients with AP were followed up by Rijkers et al[20] and 51 patients developed chronic pancreatitis. Only 3 patients developed PC of the 680 patients without chronic pancreatitis, and the SIR for development of PC was 1.1 (95%CI: 0.3-3.3). It is worth mentioning that 2 of 51 patients with chronic pancreatitis developed PC and risk of PC was almost 9 times higher (SIR = 9.0; 95%CI: 2.3-35.7) compared to patients without chronic pancreatitis. Kirkegård et al[21] found elevated PC risk during the 5-year follow-up, with patients diagnosed with AP appearing to be more vulnerable to PC compared with age- and sex-matched groups within the follow-up period. Though this risk seemed to decline with long-term follow-up, the fluctuation was comparatively placid and remained at a high level, as shown by the results of long-term observations for more than 5 years (HR 2.02; 95%CI: 1.57-2.61). In addition, a prospective cohort study of 0.5 million people in China, Pang et al[22] found that individuals with acute pancreatitis, after being diagnosed for 2 years, had an 8-fold higher risk of pancreatic cancer compared to controls (HR = 8.26; 95%CI: 3.42-19.98). A recent study performed by Gong et al[30], suggesting that a shorter overall survival for pancreatic ductal adenocarcinoma who got a AP than those without a history of AP and the HR for mortality was 1.808 (95%CI: 1.241-2.632). Similarly, it has been reported that AP is an independent risk factor for recurrence of PC (OR = 4.13; 95%CI: 1.41-12.10) and AP is associated with a worse disease-free survival of patients with PC[31]. Therefore, even if AP did not show a stronger association of PC risk compared with chronic pancreatitis, the relationship between AP and PC risk should be taken seriously.
Notably, numerous studies have demonstrated that if PC is diagnosed shortly after the onset of AP follow-up. Based on our results, AP is less likely to be a causal risk factor for PC, owing to the strong association between their risk (EEs = 23.47, 95%CI: 3.26-43.68), 1 year after AP diagnosis. However, estimates across different follow-up times are required for adequate validation of these findings. PC risk in patients with AP showed a declining trend across time points, as evidenced by EEs of 2.47 (95%CI: 1.93-3.02), 1.69 (95%CI: 1.26-2.11), and 1.17 (95%CI: 0.78-1.57) for 5, 10 and > 10-year lag periods, respectively. This is consistent with previous studies that have reported a 20-fold increase in PC risk within the first 2 years following AP diagnosis[23,24]. Generally, PC patients may initially manifest symptoms similar to mild AP. Consequently, many cases may be inaccurately diagnosed as AP[32]. Based on this, Cho et al[33] suggested that occurrence of AP may be an indicator for PC, affirming the need for early examinations, after an interval of 3 to 4 wk, to allow for resolution of inflammatory changes secondary to the pancreatitis episode, especially in high-risk patients. Consequently, a spuriously strong overall association has been reported in patients misdiagnosed with AP, when in fact they had PC. This may explain the strong association observed between AP and PC risk within 1 year of AP diagnosis as well as the diminishing relationship after 1 year of diagnosis.
This study had some limitations. First, a pre-existing pancreatic cancer might go undetected, which clinically presented as acute pancreatitis. This can be attributed to the following reasons: (1) It is possible that the physician treated a more common disease, such as gallstones or alcohol abuse, rather than focusing on a pre-existing pancreatic cancer. (2) The diagnosis of AP is based on imaging examination, such as contrast-enhanced computed tomography (CECT) and magnetic resonance imaging (MRI). However, a pancreatic tumor mass might be mistaken for an inflammatory mass in the acute setting even after CECT or MRI[34]. And (3) CECT and MRI are not the standard diagnostic tools for acute pancreatitis[35]. Although several patients with acute pancreatitis are subjected to such examinations during hospitalization and subsequent follow-up, it is possible that pre-existing pancreatic cancer is missed. Second, some studies included in this meta-analysis were too old. Recent prospective studies in this field will confirm the current state of knowledge in this area.
CONCLUSION
Overall, our findings indicated an association between AP and PC risk. Based on subgroup analyses, AP is unlikely to be a causal factor for PC.
ARTICLE HIGHLIGHTS
Research background
Pancreatic cancer (PC) is a major cause of cancer-related deaths worldwide. Its prognosis is poor, and curative-intent surgery remains the only approach for improving survival rates of PC patients. However, fewer than 20% of PC patients are eligible for surgery following diagnosis, due to local disease progression and metastasis. Therefore, avoiding risk factors as well as early diagnosis represent the most essential approaches for improving the survival of PC patients.
Research motivation
Previous studies have revealed several risk factors for PC including diabetes, smoking and chronic pancreatitis. Although chronic pancreatitis has been associated with PC, the relationship between acute pancreatitis (AP) and PC risk remains unclear due to inconsistent and contradictory results.
Research objectives
We explored the association between AP and PC risk using a meta-analysis of retrospective and prospective studies.
Research methods
We first searched PubMed, Web of Science, Cochrane, and EMBASE databases for original articles associating AP with PC using. We then calculated combined overall effect estimates (EEs) between AP and PC risk at a 95% confidence interval (CI), using a random-effects model and assessed heterogeneity using the I2 test. Thereafter, we examined the relationship between AP and PC using combined relative risk (RR), at 95%CI. Furthermore, we conducted publication bias and subgroup analyses, then analyzed sensitivities to explain the observed heterogeneity.
Research results
Eleven studies were eligible for inclusion in this meta-analysis, and resulted in a pooled EE of 2.07 (95%CI: 1.36-2.78) for AP and PC risk. Additionally, five prospective cohort studies reported 103961 patients in the AP group, relative to 1442158 subjects in the control group, with a pooled RR of 7.81 (95%CI: 5.00-12.19). Subgroup analyses, performed using different follow-up times, revealed pooled EEs of 23.47 (95%CI: 3.26-43.68), 9.82, (95%CI: 3.01-16.64), 2.47 (95%CI: 1.93-3.02), 1.69 (95%CI: 1.26-2.11) and 1.17 (95%CI: 0.78-1.57) for 1, 2, 5, 10 and > 10-year lag periods, respectively. Similar analyses targeting the type of research methods revealed EEs of 3.03 (95%CI: -1.02 to 7.08, P = 0.141) and 2.09 (95%CI: 1.22-2.97) for case-control sand cohort studies, respectively.
Research conclusions
Overall, our findings indicated an association between AP and PC risk. Based on subgroup analyses, AP is unlikely to be a causal factor for PC.
Research perspectives
Although AP might not be a direct cause for PC risk, its occurrence could be an indicators for PC. Future studies are expected to elucidate the association between AP and PC risk across different follow-up times, in order to improve early PC diagnosis.
Footnotes
Conflict-of-interest statement: All authors have no conflict(s) of interest to declare in relation to this manuscript.
PRISMA 2009 Checklist statement: The authors have read the PRISMA 2009 Checklist, and the manuscript was prepared and revised in accordance with this checklist.
Manuscript source: Unsolicited manuscript
Peer-review started: May 6, 2020
First decision: June 18, 2020
Article in press: August 26, 2020
Specialty type: Medicine, research and experimental
Country/Territory of origin: China
Peer-review report’s scientific quality classification
Grade A (Excellent): 0
Grade B (Very good): B, B
Grade C (Good): C, C, C
Grade D (Fair): D
Grade E (Poor): 0
P-Reviewer: Chiba T, Eleftheriadis N, Jadallah KA, Tsolakis A, Tsoulfas G S-Editor: Gong ZM L-Editor: Filipodia P-Editor: Wang LL
Contributor Information
Jie Liu, Department of Gastroenterology, Affiliated Provincial Hospital, Anhui Medical University, Hefei 230001, Anhui Province, China.
Ying Wang, Endoscopy Center Department, The First Affiliated Hospital of USTC, Division of Life Sciences and Medicine, University of Science and Technology of China, Hefei 230036, Anhui Province, China.
Yue Yu, Department of Gastroenterology, Affiliated Provincial Hospital, Anhui Medical University, Hefei 230001, Anhui Province, China. yuyuemd@163.com.
References
- 1.Lambert A, Schwarz L, Borbath I, Henry A, Van Laethem JL, Malka D, Ducreux M, Conroy T. An update on treatment options for pancreatic adenocarcinoma. Ther Adv Med Oncol. 2019;11:1758835919875568. doi: 10.1177/1758835919875568. [DOI] [PMC free article] [PubMed] [Google Scholar]
- 2.Zeng H, Chen W, Zheng R, Zhang S, Ji JS, Zou X, Xia C, Sun K, Yang Z, Li H, Wang N, Han R, Liu S, Li H, Mu H, He Y, Xu Y, Fu Z, Zhou Y, Jiang J, Yang Y, Chen J, Wei K, Fan D, Wang J, Fu F, Zhao D, Song G, Chen J, Jiang C, Zhou X, Gu X, Jin F, Li Q, Li Y, Wu T, Yan C, Dong J, Hua Z, Baade P, Bray F, Jemal A, Yu XQ, He J. Changing cancer survival in China during 2003-15: a pooled analysis of 17 population-based cancer registries. Lancet Glob Health. 2018;6:e555–e567. doi: 10.1016/S2214-109X(18)30127-X. [DOI] [PubMed] [Google Scholar]
- 3.Miller KD, Siegel RL, Lin CC, Mariotto AB, Kramer JL, Rowland JH, Stein KD, Alteri R, Jemal A. Cancer treatment and survivorship statistics, 2016. CA Cancer J Clin. 2016;66:271–289. doi: 10.3322/caac.21349. [DOI] [PubMed] [Google Scholar]
- 4.Ryan DP, Hong TS, Bardeesy N. Pancreatic adenocarcinoma. N Engl J Med. 2014;371:1039–1049. doi: 10.1056/NEJMra1404198. [DOI] [PubMed] [Google Scholar]
- 5.Siegel RL, Miller KD, Jemal A. Cancer statistics, 2019. CA Cancer J Clin. 2019;69:7–34. doi: 10.3322/caac.21551. [DOI] [PubMed] [Google Scholar]
- 6.Molina-Montes E, Van Hoogstraten L, Gomez-Rubio P, Löhr M, Sharp L, Molero X, Márquez M, Michalski CW, Farré A, Perea J, O'Rorke M, Greenhalf W, Ilzarbe L, Tardon A, Gress TM, Barberà VM, Crnogorac-Jurcevic T, Muñoz-Bellvis L, Domínguez-Muñoz E, Balsells J, Costello E, Iglesias M, Kleeff J, Kong B, Mora J, O'Driscoll D, Poves I, Scarpa A, Yu J, Ye W, Hidalgo M, Carrato A, Lawlor R, Real FX, Malats N PanGenEU Study Investigators. Pancreatic Cancer Risk in Relation to Lifetime Smoking Patterns, Tobacco Type, and Dose-Response Relationships. Cancer Epidemiol Biomarkers Prev. 2020;29:1009–1018. doi: 10.1158/1055-9965.EPI-19-1027. [DOI] [PubMed] [Google Scholar]
- 7.Rahn S, Zimmermann V, Viol F, Knaack H, Stemmer K, Peters L, Lenk L, Ungefroren H, Saur D, Schäfer H, Helm O, Sebens S. Diabetes as risk factor for pancreatic cancer: Hyperglycemia promotes epithelial-mesenchymal-transition and stem cell properties in pancreatic ductal epithelial cells. Cancer Lett. 2018;415:129–150. doi: 10.1016/j.canlet.2017.12.004. [DOI] [PubMed] [Google Scholar]
- 8.Kirkegård J, Mortensen FV, Cronin-Fenton D. Chronic Pancreatitis and Pancreatic Cancer Risk: A Systematic Review and Meta-analysis. Am J Gastroenterol. 2017;112:1366–1372. doi: 10.1038/ajg.2017.218. [DOI] [PubMed] [Google Scholar]
- 9.Majidi S, Golembioski A, Wilson SL, Thompson EC. Acute Pancreatitis: Etiology, Pathology, Diagnosis, and Treatment. South Med J. 2017;110:727–732. doi: 10.14423/SMJ.0000000000000727. [DOI] [PubMed] [Google Scholar]
- 10.Sadr-Azodi O, Oskarsson V, Discacciati A, Videhult P, Askling J, Ekbom A. Pancreatic Cancer Following Acute Pancreatitis: A Population-based Matched Cohort Study. Am J Gastroenterol. 2018;113:1711–1719. doi: 10.1038/s41395-018-0255-9. [DOI] [PubMed] [Google Scholar]
- 11.Carrière C, Young AL, Gunn JR, Longnecker DS, Korc M. Acute pancreatitis accelerates initiation and progression to pancreatic cancer in mice expressing oncogenic Kras in the nestin cell lineage. PLoS One. 2011;6:e27725. doi: 10.1371/journal.pone.0027725. [DOI] [PMC free article] [PubMed] [Google Scholar]
- 12.Carrière C, Young AL, Gunn JR, Longnecker DS, Korc M. Acute pancreatitis markedly accelerates pancreatic cancer progression in mice expressing oncogenic Kras. Biochem Biophys Res Commun. 2009;382:561–565. doi: 10.1016/j.bbrc.2009.03.068. [DOI] [PMC free article] [PubMed] [Google Scholar]
- 13.Duell EJ, Casella DP, Burk RD, Kelsey KT, Holly EA. Inflammation, genetic polymorphisms in proinflammatory genes TNF-A, RANTES, and CCR5, and risk of pancreatic adenocarcinoma. Cancer Epidemiol Biomarkers Prev. 2006;15:726–731. doi: 10.1158/1055-9965.EPI-05-0797. [DOI] [PubMed] [Google Scholar]
- 14.Karlson BM, Ekbom A, Josefsson S, McLaughlin JK, Fraumeni JF, Jr, Nyrén O. The risk of pancreatic cancer following pancreatitis: an association due to confounding? Gastroenterology. 1997;113:587–592. doi: 10.1053/gast.1997.v113.pm9247480. [DOI] [PubMed] [Google Scholar]
- 15.Stroup DF, Berlin JA, Morton SC, Olkin I, Williamson GD, Rennie D, Moher D, Becker BJ, Sipe TA, Thacker SB. Meta-analysis of observational studies in epidemiology: a proposal for reporting. Meta-analysis Of Observational Studies in Epidemiology (MOOSE) group. JAMA. 2000;283:2008–2012. doi: 10.1001/jama.283.15.2008. [DOI] [PubMed] [Google Scholar]
- 16.The Newcastle-Ottawa Scale (NOS) for Assessing the Quality if Nonrandomized Studies in Meta-Analyses. 2011. Available from: http://www.ohri.ca/programs/clinical_epidemiology/oxford.htm.
- 17.Greenland S. Quantitative methods in the review of epidemiologic literature. Epidemiol Rev. 1987;9:1–30. doi: 10.1093/oxfordjournals.epirev.a036298. [DOI] [PubMed] [Google Scholar]
- 18.Higgins JP, Thompson SG. Quantifying heterogeneity in a meta-analysis. Stat Med. 2002;21:1539–1558. doi: 10.1002/sim.1186. [DOI] [PubMed] [Google Scholar]
- 19.Egger M, Davey Smith G, Schneider M, Minder C. Bias in meta-analysis detected by a simple, graphical test. BMJ. 1997;315:629–634. doi: 10.1136/bmj.315.7109.629. [DOI] [PMC free article] [PubMed] [Google Scholar]
- 20.Rijkers AP, Bakker OJ, Ahmed Ali U, Hagenaars JCJP, van Santvoort HC, Besselink MG, Bollen TL, van Eijck CH Dutch Pancreatitis Study Group. Risk of Pancreatic Cancer After a Primary Episode of Acute Pancreatitis. Pancreas. 2017;46:1018–1022. doi: 10.1097/MPA.0000000000000879. [DOI] [PubMed] [Google Scholar]
- 21.Kirkegård J, Cronin-Fenton D, Heide-Jørgensen U, Mortensen FV. Acute Pancreatitis and Pancreatic Cancer Risk: A Nationwide Matched-Cohort Study in Denmark. Gastroenterology. 2018;154:1729–1736. doi: 10.1053/j.gastro.2018.02.011. [DOI] [PubMed] [Google Scholar]
- 22.Pang Y, Kartsonaki C, Turnbull I, Guo Y, Yang L, Bian Z, Chen Y, Millwood IY, Bragg F, Gong W, Xu Q, Kang Q, Chen J, Li L, Holmes MV, Chen Z. Metabolic and lifestyle risk factors for acute pancreatitis in Chinese adults: A prospective cohort study of 0.5 million people. PLoS Med. 2018;15:e1002618. doi: 10.1371/journal.pmed.1002618. [DOI] [PMC free article] [PubMed] [Google Scholar]
- 23.Munigala S, Kanwal F, Xian H, Scherrer JF, Agarwal B. Increased risk of pancreatic adenocarcinoma after acute pancreatitis. Clin Gastroenterol Hepatol. 2014;12:1143–1150.e1. doi: 10.1016/j.cgh.2013.12.033. [DOI] [PubMed] [Google Scholar]
- 24.Chung SD, Chen KY, Xirasagar S, Tsai MC, Lin HC. More than 9-times increased risk for pancreatic cancer among patients with acute pancreatitis in Chinese population. Pancreas. 2012;41:142–146. doi: 10.1097/MPA.0b013e31822363c3. [DOI] [PubMed] [Google Scholar]
- 25.Ekbom A, McLaughlin JK, Karlsson BM, Nyrén O, Gridley G, Adami HO, Fraumeni JF., Jr Pancreatitis and pancreatic cancer: a population-based study. J Natl Cancer Inst. 1994;86:625–627. doi: 10.1093/jnci/86.8.625. [DOI] [PubMed] [Google Scholar]
- 26.Goldacre MJ, Wotton CJ, Yeates D, Seagroatt V, Collier J. Liver cirrhosis, other liver diseases, pancreatitis and subsequent cancer: record linkage study. Eur J Gastroenterol Hepatol. 2008;20:384–392. doi: 10.1097/MEG.0b013e3282f4489f. [DOI] [PubMed] [Google Scholar]
- 27.Bansal P, Sonnenberg A. Pancreatitis is a risk factor for pancreatic cancer. Gastroenterology. 1995;109:247–251. doi: 10.1016/0016-5085(95)90291-0. [DOI] [PubMed] [Google Scholar]
- 28.Zhang X, An R, Tian H, Zhao J. Increased risk of pancreatic cancer after acute pancreatitis: A meta-analysis of prospective cohort studies. Clin Res Hepatol Gastroenterol. 2019;43:e39–e41. doi: 10.1016/j.clinre.2018.09.008. [DOI] [PubMed] [Google Scholar]
- 29.Tong GX, Geng QQ, Chai J, Cheng J, Chen PL, Liang H, Shen XR, Wang DB. Association between pancreatitis and subsequent risk of pancreatic cancer: a systematic review of epidemiological studies. Asian Pac J Cancer Prev. 2014;15:5029–5034. doi: 10.7314/apjcp.2014.15.12.5029. [DOI] [PubMed] [Google Scholar]
- 30.Gong Y, Fan Z, Luo G, Huang Q, Qian Y, Cheng H, Jin K, Ni Q, Yu X, Liu C. Prior history of acute pancreatitis predicts poor survival in patients with resectable pancreatic ductal adenocarcinoma. Pancreatology. 2020;20:716–721. doi: 10.1016/j.pan.2020.02.016. [DOI] [PubMed] [Google Scholar]
- 31.Feng Q, Li C, Zhang S, Tan CL, Mai G, Liu XB, Chen YH. Recurrence and survival after surgery for pancreatic cancer with or without acute pancreatitis. World J Gastroenterol. 2019;25:6006–6015. doi: 10.3748/wjg.v25.i39.6006. [DOI] [PMC free article] [PubMed] [Google Scholar]
- 32.Mujica VR, Barkin JS, Go VL. Acute pancreatitis secondary to pancreatic carcinoma. Study Group Participants. Pancreas. 2000;21:329–332. doi: 10.1097/00006676-200011000-00001. [DOI] [PubMed] [Google Scholar]
- 33.Cho JH, Choi JS, Hwang ET, Park JY, Jeon TJ, Kim HM, Cho JH. Usefulness of scheduled follow-up CT in discharged patients with acute pancreatitis. Pancreatology. 2015;15:642–646. doi: 10.1016/j.pan.2015.09.004. [DOI] [PubMed] [Google Scholar]
- 34.Frampas E, Morla O, Regenet N, Eugène T, Dupas B, Meurette G. A solid pancreatic mass: tumour or inflammation? Diagn Interv Imaging. 2013;94:741–755. doi: 10.1016/j.diii.2013.03.013. [DOI] [PubMed] [Google Scholar]
- 35.Tenner S, Baillie J, DeWitt J, Vege SS American College of Gastroenterology. American College of Gastroenterology guideline: management of acute pancreatitis. Am J Gastroenterol. 2013;108:1400–15; 1416. doi: 10.1038/ajg.2013.218. [DOI] [PubMed] [Google Scholar]


