

Abstract
An impressive clinical success has been observed in treating a variety of cancers using immunotherapy with programmed cell death‐1 (PD‐1) checkpoint blockade. However, limited response in most patients treated with anti‐PD‐1 antibodies remains a challenge, requiring better understanding of molecular mechanisms limiting immunotherapy. In colorectal cancer (CRC) resistant to immunotherapy, mismatch‐repair‐proficient or microsatellite instability‐low (pMMR‐MSI‐L) tumors have low mutation burden and constitute ~85% of patients. Here, we show that inhibition of N 6‐methyladenosine (m6A) mRNA modification by depletion of methyltransferases, Mettl3 and Mettl14, enhanced response to anti‐PD‐1 treatment in pMMR‐MSI‐L CRC and melanoma. Mettl3‐ or Mettl14‐deficient tumors increased cytotoxic tumor‐infiltrating CD8+ T cells and elevated secretion of IFN‐γ, Cxcl9, and Cxcl10 in tumor microenvironment in vivo. Mechanistically, Mettl3 or Mettl14 loss promoted IFN‐γ‐Stat1‐Irf1 signaling through stabilizing the Stat1 and Irf1 mRNA via Ythdf2. Finally, we found a negative correlation between METTL3 or METTL14 and STAT1 in 59 patients with pMMR‐MSI‐L CRC tumors. Altogether, our findings uncover a new awareness of the function of RNA methylation in adaptive immunity and provide METTL3 and METTL14 as potential therapeutic targets in anticancer immunotherapy.
Keywords: CD8+ T cells, colorectal carcinoma, immunotherapy, m6A methylation
Subject Categories: Immunology, RNA Biology
Disruption of m6A methyltransferases leads to enhanced immunotherapy response in colorectal cancer and melanoma cells due to enhanced IFN‐γ‐Stat1‐Irf1 signaling and modulation of the tumor microenvironment.

Introduction
Immunotherapy has become one of the unprecedented treatment modalities for multiple cancers by targeting the interactions between tumor and immune system (Ribas & Wolchok, 2018). The immune system discriminates exogeneous cells from self through the recognition of the major histocompatibility complex (MHC) complex‐peptides presented on target cells, e.g., tumor cell, and T cell receptors (TCR) on immune cells (Schreiber et al, 2011; Khalil et al, 2016), whereas this recognition alone is not sufficient for initiation of the immune response. Other regulatory circuits also play important roles to co‐inhibit or co‐activate immune cells, the former role is typically exploited by cancer cells to evade immunosurveillance (Townsend & Allison, 1993; Sharma & Allison, 2015; Wei et al, 2018b). Among these negative regulatory pathways, PD‐1 (programmed cell death–1) and CTLA‐4 (cytotoxic T‐lymphocyte protein 4) have been targeted by immune checkpoint inhibitors (ICIs) to enhance tumor cell killing by T cells in immunotherapy (Jenkins et al, 2018). Tumors with mutated genome are likely to generate peptide neoantigen to recruit and activate immune cells via MHC complex‐TCR recognition in immunotherapy to induce durable response (Samstein et al, 2019). Although impressive success has been observed in the clinical practice of ICIs for tumors with high mutation burden, such as non‐small cell lung cancer (NSCLC) and melanoma, while the failure of response or elapse in low‐mutation‐burden cancer patients treated with ICIs remains common (Alexandrov et al, 2013; Sharma et al, 2017; Ganesh et al, 2019). In addition to mutational load, a number of other useful biomarkers for ICI responses have been identified including interferon signatures (Ayers et al, 2017), checkpoint ligand expression, and inflammation in tumor microenvironments (Kowanetz et al, 2018).
Mismatch‐repair deficiency or high level of microsatellite instability (dMMR‐MSI‐H) in tumors has emerged as an effective biomarker to predict solid tumor responses to ICIs (Le et al, 2017; Mandal et al, 2019). dMMR‐MSI‐H tumors possess microsatellite instability (MSI) leading to genetic hypermutability and accumulation of thousands of mutations. These studies are exciting and provide a proof of concept that reliable biomarkers could provide important criteria for patient stratification for ICI therapies. However, mismatch‐repair‐proficient or microsatellite instability‐low (pMMR‐MSI‐L) tumors have low mutation burden and constitute ~85% of CRC patients (Ganesh et al, 2019). Apart from the status of mutation burden, lack of response or being resistant to ICIs also involves the alternations of molecular mechanisms in both cancer and immune system as well as their interface (Sharma et al, 2017). Within these alternations, the abnormality of T cells, the absence of antigen presentation, and the aberrant oncogenic signaling were revealed by recent studies (Sharma et al, 2017). Therefore, new mechanisms governing the response and resistance to ICIs therapy need to be discovered. In addition, mechanism‐driven biomarkers should be identified for guiding cancer immunotherapy for pMMR‐MSI‐L tumors in CRC.
N 6‐methyladenosine (m6A) is the most abundant chemical modification in mRNA and lncRNA in eukaryotes (Dominissini et al, 2012; Meyer et al, 2012; Yue et al, 2015; Meyer & Jaffrey, 2017). In mammalian cells, this epitranscriptomic mark is installed by methyltransferase machinery comprising a METTL3‐METTL14 core and other subunits (Liu et al, 2014; Ping et al, 2014). The reversal of this modification is mediated by the alpha‐ketoglutarate‐dependent dioxygenases FTO and ALKBH5 (Jia et al, 2011; Zheng et al, 2013). Dynamics of RNA methylation influences a broad range of physiological processes including RNA metabolism and protein translation mainly through the readout of YTH family m6A binding proteins (Wang et al, 2014, 2015; Xiao et al, 2016; Hsu et al, 2017; Li et al, 2017; Nachtergaele & He, 2018). Aberrant m6A RNA methylation is associated with various diseases including cancer (Deng et al, 2018; Wu et al, 2019). Recently, studies have started to provide emerging roles of RNA methylation and its machinery in tumor initiation, differentiation, and progression (Jaffrey & Kharas, 2017; Liu et al, 2019). Moreover, elevation of RNA methylation affects both immune response and melanoma cell sensitivity within anticancer immunotherapy (Han et al, 2019; Yang et al, 2019). Despite this discovery, suppression of m6A had also been observed in the tumorigenesis (Deng et al, 2018). Recently, depletion of ALKBH5 in sensitizing tumors to cancer immunotherapy has been described where ALKBH5 modulates target gene expression and splicing, leading to changes in lactate content of the tumor microenvironment, which regulates the composition of tumor‐infiltrating Treg and myeloid‐derived suppressor cells (Li et al, 2020). Remarkably, a small‐molecule inhibitor of ALKBH5 enhanced the efficacy of cancer immunotherapy (Li et al, 2020). The complex and varied roles of m6A in tumors suggest that much needs to be done to further understand the importance and dynamic of this modification in cancer biology and its clinical application. Besides, apart from total mutation burden, whether RNA methylation pathway involves the insensitivity of refractory cancer in immunotherapy remains unknown.
Here, we present that the disruption of m6A methyltransferases enhanced immunotherapy response in pMMR‐MSI‐L colorectal cancer through modulating the intratumor microenvironment and tumor‐infiltrating cells. Mechanistically, depletion of Mettl3 or Mettl14 enhanced IFN‐γ‐Stat1‐Irf1 signaling through stabilizing the Stat1 and Irf1 mRNA mediated by Ythdf2. Our findings uncovered, a previously unrecognized, mechanism of mRNA methylation in sensitizing pMMR‐MSI‐L colorectal cancer to PD‐1 blockade, thereby providing potential new biomarkers and a therapeutic avenue for this malignant disease refractory to ICIs treatment.
Results
Loss of Mettl3 or Mettl14 sensitizes colorectal carcinoma and melanoma tumors to anti‐PD‐1 treatment
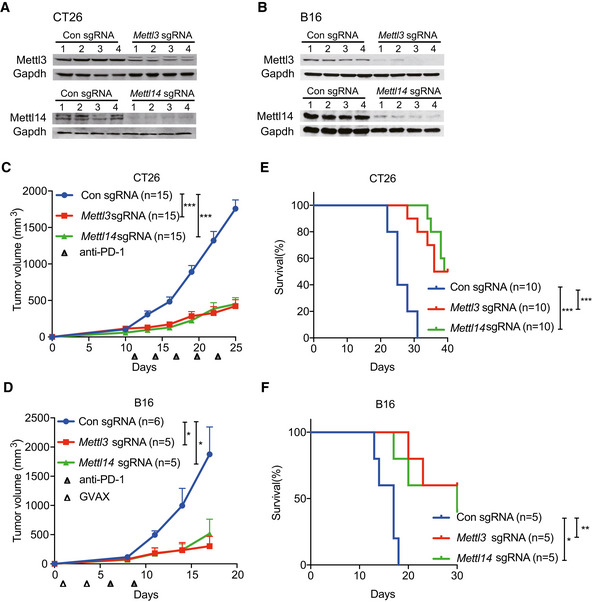
So far, the roles of m6A methyltransferases (METTL3 and METTL14) in cancer immunotherapy have not been investigated. To determine the biological function of METTL3 and METTL14 in this process, we employed mouse models using the modestly immunogenic colorectal cancer cell line CT26 (Kim et al, 2014) and a poorly immunogenic murine melanoma cell line B16 (Manguso et al, 2017). Loss of Mettl3 and Mettl14 CT26 colorectal carcinoma and B16 melanoma cells were generated using sgRNA and validated the effect of depletion by Western blotting (Fig 1A and B). To establish these mouse models, we first investigated the immune checkpoint‐blocking antibody response in CT26 tumors. We treated BALB/c mice bearing CT26 colorectal carcinoma with control IgG, anti‐PD‐1, or combined anti‐PD‐1 plus anti‐CTLA‐4 antibodies. Anti‐PD‐1 antibody had limited effect on tumor growth and mice survival compared with control IgG antibody treatment, whereas combined anti‐PD‐1 and anti‐CTLA‐4 treatment responded better than anti‐PD‐1 (Fig EV1A and B), consistent with the previous study (Kim et al, 2014) showing resistance to anti‐PD‐1 treatment in colon cancer immunotherapy. Next, Mettl3‐ or Mettl14‐depleted and control cells were subcutaneously injected into BALB/c mice, and mice were treated with anti‐PD‐1 antibody. Compared to control, the mice bearing Mettl3‐ or Mettl14‐depleted CT26 tumors showed slower tumor growth (Figs 1C and EV1C) and prolonged survival (Fig 1E). We also analyzed the effect of Mettl3 or Mettl14 depletion in a well‐established B16 melanoma model where C57BL/6J mice were treated with combination of anti‐PD‐1 antibody and granulocyte‐macrophage colony‐stimulating factor (GM‐CSF)‐secreting irradiated B16 cell vaccine (GVAX), which simulates an adaptive immune response (Manguso et al, 2017). Consistent with the results of CT26, Mettl3‐ or Mettl14‐deficient‐B16‐tumor‐bearing mice exhibited tumor growth inhibition (Figs 1D and EV1D) and longer survival than controls (Fig 1F). Additionally, we confirmed that Mettl3 and Mettl14 were efficiently repressed in these mouse tumors by Western blot (Fig EV1E and F) and found the expression of Ki‐67 was decreased in Mettl3‐ or Mettl14‐depleted tumors using immunohistochemistry (IHC) staining, which indicated that Mettl3 or Mettl14 null tumors were smaller than control tumors caused reduced proliferation (Fig EV1G). Then, we assessed whether Mettl3 or Mettl14 depletion alone was able to affect cell or tumor growth since Mettl3 and Mettl14 are lethal in particular cancer types such as leukemia (Barbieri et al, 2017; Vu et al, 2017; Weng et al, 2018), glioblastoma (Cui et al, 2017), and hepatocellular carcinoma (Ma et al, 2017; Chen et al, 2018). Our observation revealed that all the cells and tumors with control and Mettl3 or Mettl14 knockout have quite similar cellular proliferation in vitro (Fig EV2A) and tumor volume in vivo (Fig EV2B–E). Collectively, these results suggested a generalizable role of m6A methyltransferases in colorectal carcinoma and melanoma, where the loss of Mettl3 or Mettl14 sensitizes tumor to the effect of immunotherapy, but not intrinsically impairs their growth alone.
Figure 1. Depletion of Mettl3 or Mettl14 sensitizes CT26 and B16 tumors to immunotherapy.
-
A, BImmunoblotting were performed to validate Mettl3 or Mettl14 expression levels in CT26 and B16 cells as indicated. Gapdh served as a loading control.
-
C, DTumor volume was monitored for control and Mettl3‐ or Mettl14‐depleted tumors with treatment as indicated in CT26 colon cancer and B16 melanoma, respectively. Data are mean ± SEM of the indicated number of mice in each group. n, the numbers of mice. *P < 0.05; ***P < 0.001 by Student's t‐tests.
-
E, FSurvival analysis of control tumors and those with depleted genes were recorded as indicated in CT26 colon cancer and B16 melanoma, respectively. Data are mean ± SEM of the indicated number of mice in each group. n, the numbers of mice. *P < 0.05; **P < 0.01; ***P < 0.001 by Student's t‐tests.
Source data are available online for this figure.
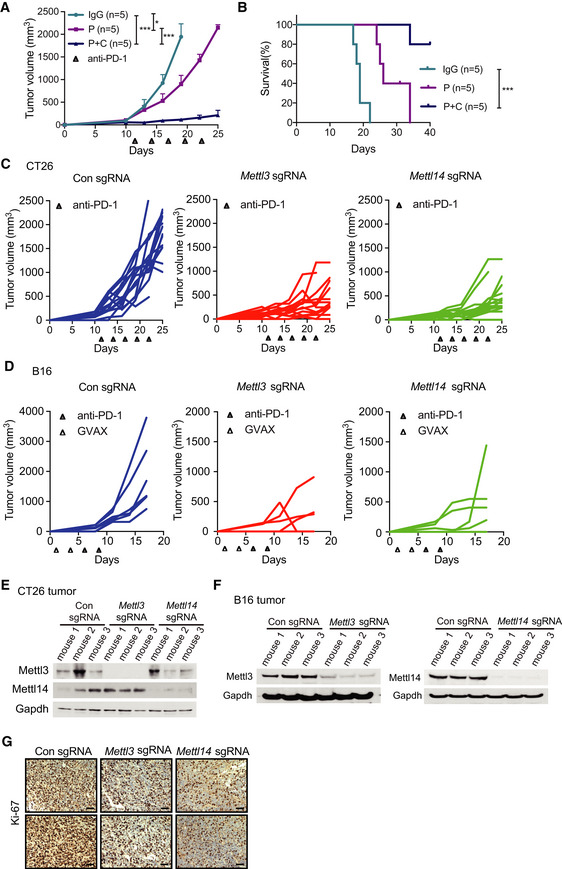
Figure EV1. Depletion of Mettl3 or Mettl14 enhanced the response to immunotherapy. (Related to Fig 1).
-
ACT26 tumor volume was measured from tumor‐bearing mice treated with IgG (IgG control), P (anti‐PD-1 antibody), and P plus C (anti‐CTLA-4 antibody) therapeutic modalities. n, the numbers of mice. Data are mean ± SEM of the indicated number of mice. *P < 0.05; ***P < 0.001 by Student's t‐tests.
-
BSurvival analysis after various treatments of mice bearing CT26 tumors. n, the numbers of mice. Data are mean ± SEM of the indicated number of mice. ***P < 0.001 by Student's t‐tests.
-
C, DC57BL/6J or BALB/c mice bearing control and Mettl3‐ or Mettl14‐depleted tumors (C, CT26; D, B16) were treated with various therapeutic modalities as indicated. Tumor volume was recorded over time as indicated. Each line represents one mouse.
-
E, FImmunoblots of Mettl3 and Mettl14 were carried out in the indicated CT26 and B16 mouse tumors in triplicates with Gapdh as a loading control.
-
GRepresentative images of Ki‐67 were stained by IHC analysis. Tissue sections from BALB/c mice bearing the indicated knockout of genes with treatment of PD1 antibody. Scale bars, 50 μm.
Source data are available online for this figure.
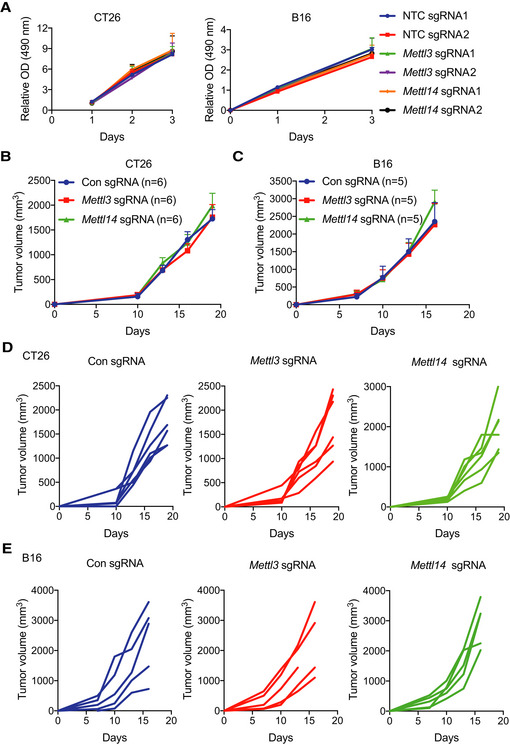
Figure EV2. Loss of Mettl3 or Mettl14 has no effect to cell proliferation and tumor growth.
-
ACell proliferation was assessed in knockout of Mettl3, Mettl14, and non‐targeting control (NTC) CT26 and B16 cells using MTS assay in vitro. Mean ± SD of n = 3.
-
B, CTumor growth of xenografts from CT26 and B16 cells with Mettl3‐ or Mettl14‐depleted genes and control as indicated. n, the numbers of mice. Data are mean ± SEM of the indicated number of mice.
-
D, ETumor growth from C57BL/6J or BALB/c mice with control and Mettl3 or Mettl14‐depleted tumors (D, CT26; E, B16). Tumor volume was recorded over time as indicated. Each line represents one mouse.
Depletion of Mettl3 or Mettl14 increased cytotoxic tumor‐infiltrating CD8+ T cells and altered tumor microenvironment
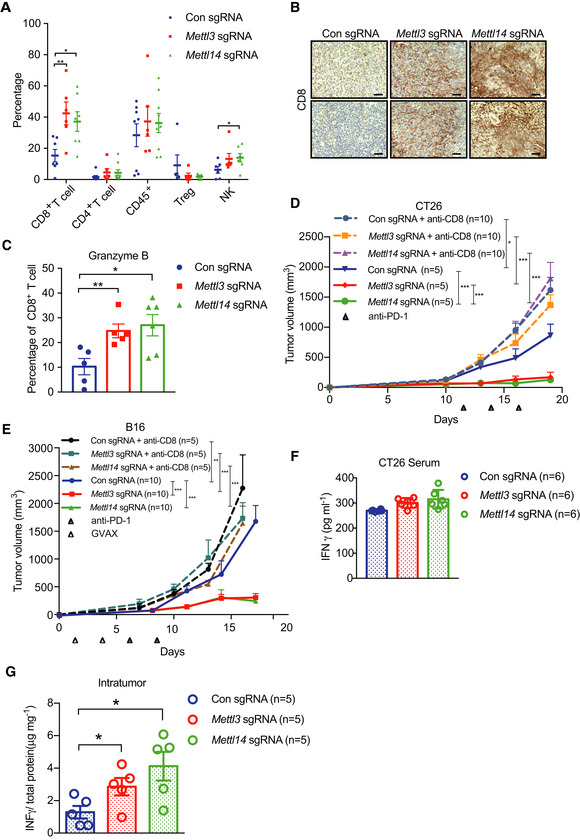
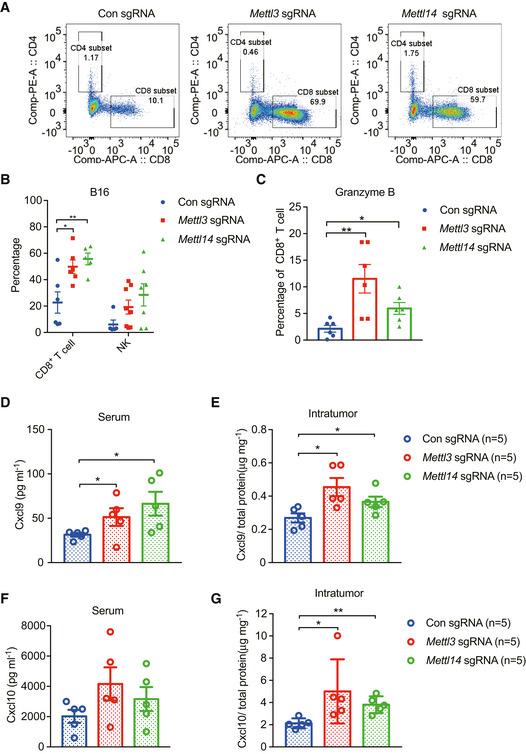
To identify the mechanisms by which depletion of Mettl3 or Mettl14 increased the response to immunotherapy, we analyzed the immune cell components within the CT26 tumor tissues by flow cytometry. The immune infiltrates contained significantly increased CD8+ T cells in both Mettl3 and Mettl14 null tumors compared to control tumors (Figs 2A and EV3A), whereas no differences in the CD4+ T cells, CD45+ cells, and Treg cells were observed (Fig 2A). Additionally, the level of natural killer (NK) cells is higher from Mettl14‐deficient tumors than that of control tumors (Fig 2A). In line with the observations of flow cytometry analysis, we also found that Mettl3‐ and Mettl14‐depleted tumors had higher expression of CD8 than that of control (Fig 2B). Further analysis revealed that Mettl3‐ and Mettl14‐depleted tumors contained a dramatically enhanced granzyme B expression in CD8+ T cells (Fig 2C). Consistently, compared with control tumors, we observed increased CD8+ T cells and granzyme B expression in CD8+ T cells from Mettl3 and Mettl14 null B16 tumors as well (Fig EV3B and C). Taken together, loss of Mettl3 or Mettl14 improved cytotoxic tumor‐infiltrating CD8+ T cells. To further investigate the contributions of CD8+ T cells to the antitumor response of immunotherapy, we depleted CD8+ T cells using an anti‐CD8 antibody and monitored the tumor growth from mice bearing control, Mettl3, or Mettl14 null tumors during immunotherapy. Our results showed that enhanced response to immunotherapy caused by depletion of Mettl3 or Mettl14 was completely abolished in both CT26 and B16 tumors (Fig 2D and E), indicating that CD8+ T cells are essential for controlling tumor growth (Ribas & Wolchok, 2018).
Figure 2. Mettl3 or Mettl14 deficiency enhances tumor‐infiltrating CD8+ T cells and cytokine production.
-
APercentage of tumor‐infiltrating T cells, Treg, and NK cells were identified by flow cytometry from CT26 tumors as indicated. Each spot represents one mouse. *P < 0.05; **P < 0.01 by Student's t‐tests.
-
BRepresentative images of CD8 by IHC staining. Tissue sections from BALB/c mice bearing the indicated knockout of genes with treatment of PD1 antibody. Scale bars, 50 μm.
-
CPercentage of granzyme B‐expressing CD8+ T cells from control and Mettl3‐ or Mettl14‐deficient CT26 tumors. Each spot represents one mouse. *P < 0.05; **P < 0.01 by Student's t‐tests.
-
D, EMice bearing control and Mettl3 or Mettl14 null tumors were treated with CD8‐depleting antibody and PD‐1 antibody or PD‐1/GVAX as indicated. Tumor volume was measured over time points. n, the numbers of mice. *P < 0.05; **P < 0.01; ***P < 0.001 by Student's t‐tests.
-
F, GIFN‐γ production in serum (F) and intratumor (G) from BALB/c mice by ELISA. The results are representatives of at least three independent experiments. n, the numbers of mice. Data are mean ± SEM. *P < 0.05 by Student's t‐tests.
Figure EV3. Tumor‐infiltrating CD8+ T cells and chemokines concentration were altered in Mettl3 or Mettl14 null tumors. (Related to Fig 2).
- Representative examples for CD8+ T cells from FACS analyses in CT26 tumors.
- Percentage of tumor‐infiltrating CD8+ T cells and NK cells were analyzed from control and Mettl3‐ or Mettl14‐deficient B16 tumors using flow cytometry. Each spot represents one mouse. Data are mean ± SEM of the indicated number of mice. *P < 0.05; **P < 0.01 by Student's t‐tests.
- Percentage of granzyme B‐expressing CD8+ T cells from B16 tumors as indicated. Each spot represents one mouse. *P < 0.05; **P < 0.01 by Student's t‐tests.
- Secretion of Cxcl9 in serum from the indicated BALB/c mice by ELISA. Each spot represents one mouse. *P < 0.05 by Student's t‐tests.
- Intratumoral Cxcl9 concentration were determined by ELISA in the indicated CT26 tumor extracts and then calculated by the total protein concentration. Each spot represents one mouse. n, the numbers of mice. *P < 0.05 by Student's t‐tests.
- Secretion of Cxcl10 in serum from the indicated BALB/c mice by ELISA. Each spot represents one mouse.
- Intratumoral Cxcl10 concentration were determined by ELISA in the indicated CT26 tumor extracts and then calculated by the total protein concentration. Each spot represents one mouse. n, the numbers of mice. *P < 0.05; **P < 0.01 by Student's t‐tests.
CD8+ T cells are multiple cytokine producers (Paliard et al, 1988), which predominately secrete cytokines including IFN‐γ and TNFα (Lichterfeld et al, 2004; Pandiyan et al, 2007). IFN‐γ plays an important role in tumor immune surveillance (Castro et al, 2018) via inducing the production of CXCL9 and CXCL10, where these chemokines facilitate recruitment of CD8+ and CD4+ effector T cells to suppress tumor growth (Gorbachev et al, 2007; Tokunaga et al, 2018). To address this question, we then analyzed the secretion of IFN‐γ, Cxcl9, and Cxcl10 in both mouse serum and intratumor using ELISA. Our results showed that the production of IFN‐γ and Cxcl10 was not significantly changed in mouse serum (Figs 2F and EV3F) except for Cxcl9 (Fig EV3D). Interestingly, we observed a remarkably increased concentration of IFN‐γ (Fig 2G), Cxcl9 (Fig EV3E), and Cxcl10 (Fig EV3G) in both Mettl3‐ and Mettl14‐deficient intratumor relative to control intratumor. Together, these results indicate a mechanism where Mettl3 or Mettl14 loss enhanced efficacy of immunotherapy through modulating production of cytokines and chemokines in the tumor microenvironment.
Identification of potential targets of Mettl3 and Mettl14
To understand the molecular mechanism of Mettl3 and Mettl14 in cancer immunotherapy, we employed RNA sequencing (RNA‐seq) to identify the affected genes upon Mettl3 and Mettl14 depletion. Through analysis of our RNA‐seq data, we identified the mRNA transcript level of 402 genes was upregulated and 282 genes was downregulated in Mettl3 null tumors compared to control tumors, while 283 genes were increased and 73 genes were decreased in Mettl14‐deficient tumors compared with control (Fig 3A). Furthermore, 230 Mettl3‐ and Mettl14‐dependent genes were altered among both tumors with knockout of Mettl3 and Mettl14 compared to control: including 202 co‐upregulated and 28 co‐downregulated genes (Fig 3B, Dataset EV1). Gene ontology (GO) analysis was performed on 202 co‐upregulated genes since the limited numbers of co‐downregulated genes, and these enriched pathways were mainly associated with responses to interferons, defense, inflammation, leukocyte cell–cell adhesion, cytokine production, adaptive immunity, and antigen processing and presentation (Fig 3C). Notably, Mettl3‐ and Mettl14‐dependent upregulated genes involved in interferon‐gamma and interferon‐beta pathways including Stat1, Stat4, Irf1, Irf4, Irf7, and Pdl1, and cytokine/chemokine‐mediated signaling pathway such as Ccl5, Cxcl9, and Cxcl10, which was consistent with our previous observation of productions of chemokines (Fig EV3E and G). To validate our RNA‐seq results, we performed qRT–PCR and our results showed that all of these genes involved in interferons and cytokine/chemokine pathways were significantly upregulated in Mettl3 and Mettl14 null tumors (Fig EV4A). Together, these findings suggested that the upregulated genes upon Mettl3 and Mettl14 depletion were principally connected with immune response‐associated processes.
Figure 3. Identification of target genes of Mettl3 and Mettl14 by RNA‐seq and m6A‐seq.
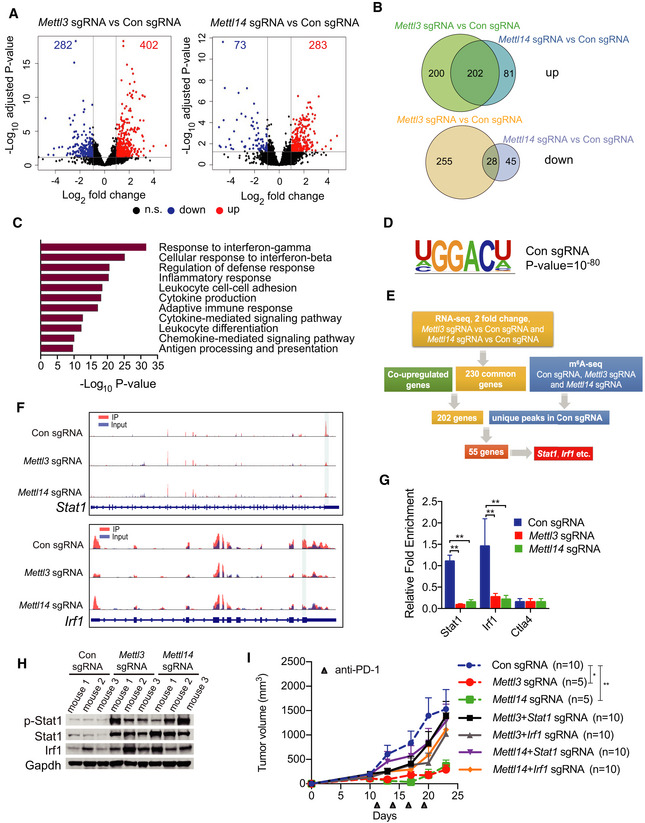
- Volcano plot of differentially expressed genes obtained by DESeq2 analysis in Mettl3 or Mettl14 null tumors compared to control tumors. Significantly upregulated or downregulated genes are plotted in red and blue points, respectively. n.s, non‐significant.
- Venn diagrams showing 202 significantly co‐upregulated genes and 28 significantly co‐downregulated genes in the indicated tumors.
- Meta‐enrichment analysis summary for 202 significantly co‐upregulated genes as indicated in (C).
- Consensus m6A motifs and P value identified by HOMER from two biological replicates, Student's t‐tests.
- Schematic workflow for analysis of Mettl3 and Mettl14 downstream genes and identified genes or peaks number.
- Representative genes with m6A sites generated by integrative genomics viewer. Data are representative of duplicates with similar results. Red represents reads coverage of IP sample and blue represents reads coverage of input sample. Rectangular cyan shade represents the m6A peaks located on transcripts.
- m6A enrichment of Stat1 and Irf1 was examined by m6A RIP‐qPCR in control, Mettl3‐, or Mettl14‐depleted CT26 tumors as indicated. Ctla4 functioned as a m6A negative control (Wang et al, 2019). Data are mean ± SD. **P < 0.01 by Student's t‐tests.
- Immunoblots of p‐Stat1 (phosphorylated), Stat1, and Irf1 were carried out in the indicated tumors in triplicate with Gapdh as a loading control.
- Tumor growth from CT26 cells with Mettl3‐, Mettl14‐, Mettl3/Stat1‐, Mettl3/Irf1-, Mettl14/Stat1‐, or Mettl14/Irf1‐depleted genes and control under treatment of PD‐1 antibody as indicated. n, the numbers of mice. Data are mean ± SEM of the indicated number of mice in each group. *P < 0.05; **P < 0.01 by Student's t‐tests.
Source data are available online for this figure.
Figure EV4. Gene expression changes and analysis of m6A modification in Mettl3‐ or Mettl14‐depleted tumors (Related to Fig 3).
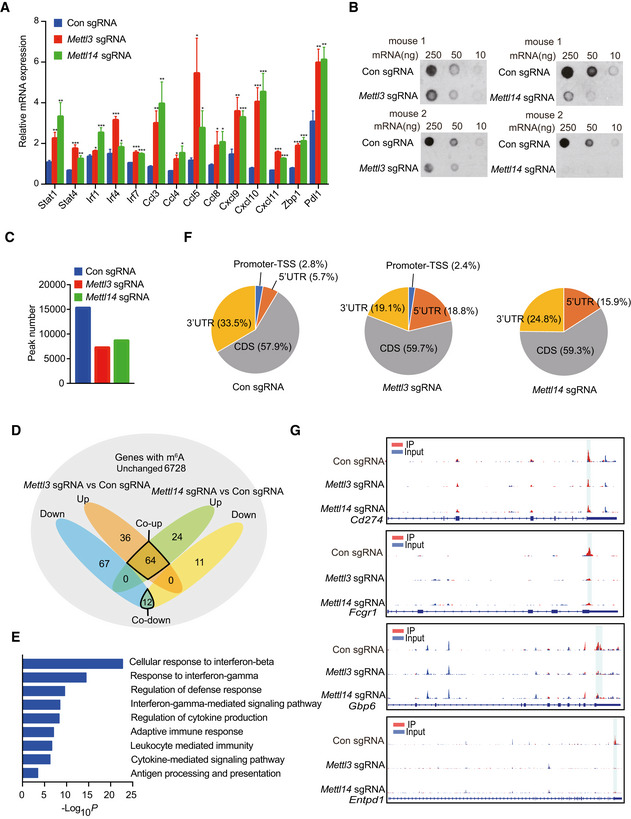
- Transcriptional analysis of the indicated genes identified from the RNA‐seq data using quantitative RT–PCR. mRNA levels in Mettl3‐ or Mettl14‐deficient tumors are presented as the relative fold change compared to control sgRNA tumor. The mean ± SD of five replicates is shown. *P < 0.05; **P < 0.01; ***P < 0.001 by Student's t‐tests.
- Dot blot of the total m6A levels in mRNA extracted from Mettl3‐ or Mettl14‐depleted and control tumors.
- Number of consensus m6A peaks identified from two biological replicates in the indicated tumors.
- Venn diagram of upregulated m6A containing genes, downregulated m6A containing genes, and common m6A genes without expression level changes as indicated. Orange shade represents upregulated m6A containing genes from Mettl3‐depleted tumors compared to control, blue shade represents downregulated m6A containing genes from Mettl3‐depleted tumors compared to control. Green shade represents upregulated m6A containing genes from Mettl14‐depleted tumors compared to control, yellow shade represents downregulated m6A containing genes from Mettl14‐depleted tumors compared to control. Gray shade represents common m6A genes without any changes from Mettl3‐ and Mettl14‐depleted tumors compared to control.
- GO analysis was performed on 64 co‐upregulated m6A containing genes from D as indicated.
- Distribution of m6A peaks in the indicated tumors. Pie charts show the proportion of m6A peaks in the 5′‐UTR (orange), CDS (gray), 3′‐UTR (yellow), and promoter‐TSS (blue).
- Representative genes with m6A sites generated by integrative genomics viewer. Blue represents reads coverage of input sample and red represents reads coverage of IP sample. Rectangular cyan shade represents the m6A peaks located on transcripts.
Source data are available online for this figure.
We then asked whether the altered gene expression caused by Mettl3 and Mettl14 depletion was a consequence of suppressed m6A methylation. We first analyzed the total m6A modification levels by dot‐blot experiments, which were significantly decreased in the Mettl3 and Mettl14 null tumors compared with control tumors (Fig EV4B). Next, m6A methylome between control and methyltransferase‐depleted tumors were compared by antibody‐based m6A immunoprecipitation together with high‐throughput sequencing (MeRIP‐seq) as described previously (Lichinchi et al, 2016a,b; Lichinchi & Rana, 2019). In line with total methylation level changes on mRNA, after combining the peaks in replicates, our analysis identified 16,883 high‐confidence m6A peaks in control tumor, whereas 7,701 and 8,794 m6A peaks were identified in Mettl3‐ and Mettl14‐deficient tumors, respectively (Fig EV4C). These results indicate a global loss of m6A methylation in methyltransferase‐depleted tumors. To investigate the role of m6A on the regulation of mRNA level, we identified the upregulated, downregulated, and unchanged m6A‐containing genes from MeRIP‐seq and RNA‐seq data. Although the majority of m6A‐containing genes (6,728) were unchanged, 64 m6A‐containing genes were co‐upregulated in both Mettl3‐ and Mettl14‐deficient tumors, whereas only 12 m6A‐containing genes were downregulated, which reflected the specific regulatory role of m6A in response to immunotherapy and indicated the destabilization effect of m6A modification on RNA (Fig EV4D). Then, GO analysis was performed on 64 co‐upregulated m6A‐containing genes, and these enriched pathways were also related to immune response, predominately associated with response to interferons, regulation of cytokine production, adaptive immune response, and defense response, etc. (Fig EV4E, Dataset EV2). Furthermore, depletion of Mettl3 and Mettl14 decreased m6A enrichment in 3′UTR where the majority of m6A control the stability of mRNA, mirrored the upregulated overall genes and m6A‐containing genes (Fig EV4F and G). Moreover, previously identified GGACU m6A consensus motif was highly enriched within m6A peaks in the control tumors (Fig 3D).
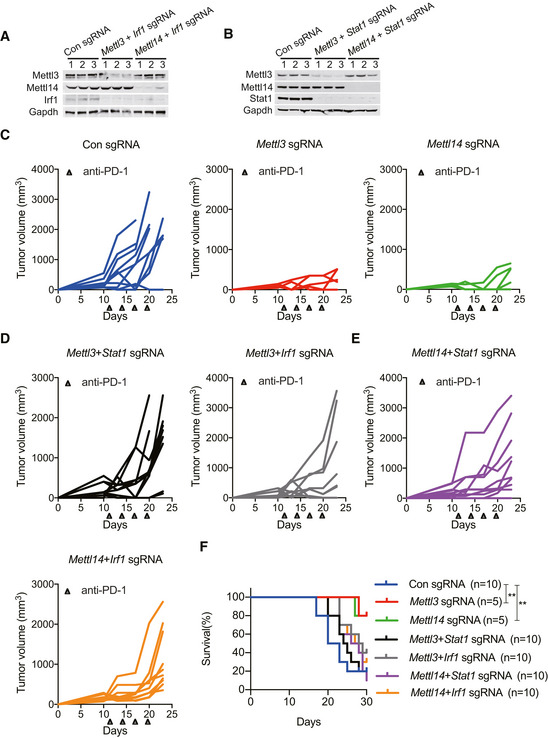
To identify the potential targets of Mettl3 and Mettl14, we developed a workflow scheme outlined in Fig 3E. We filtered 202 co‐upregulated genes enriched in pathways that were found in the RNA‐seq with 11,167 m6A peaks which were lost in both Mettl3 and Mettl14 null tumors. This analysis resulted in 55 candidate genes identification including Stat1 and Irf1 (Fig 3E, Dataset EV3). Given that STAT1 and IRF1 not only act as fundamental role in Janus kinase (JAK)–STAT signaling, which is involved in antiviral and antibacterial response (Ramana et al, 2000; Honda et al, 2006; Pautz et al, 2010), but also play a critical role in IFN‐γ signaling (Sharma et al, 2017) and anti‐PD‐1 response (Garcia‐Diaz et al, 2017; Zenke et al, 2018), which results in antitumor effects. Then, we further analyzed our MeRIP‐seq data, which showed that Mettl3 and Mettl14 deposit m6A on 3′UTR (near stop codon) of both Stat1 and Irf1, and these two m6A sites have drastically decreased methylation level in Mettl3 and Mettl14 null tumors (Fig 3F). We further validated these findings by MeRIP‐qPCR showing significant decrease in Stat1 and Irf1 mRNA levels in Mettl3 and Mettl14 null tumors demonstrating that our MeRIP‐seq data were robust and accurate (Fig 3G). In agreement with the transcript level of Stat1 and Irf1 validated by qRT–PCR (Fig EV4A), we also observed an increased Stat1, phosphorylated (p‐) Stat1 and Irf1 protein levels in the Mettl3 and Mettl14 null tumors (Fig 3H). To further investigate whether the mechanism of enhanced immunotherapy response of Mettl3 or Mettl14 null tumors relies on the increased Stat1 and Irf1, we generated knockout of Stat1 or Irf1 CT26 cells based on the Mettl3‐ or Mettl14‐depleted cells we already had, and then double knockout of Mettl3/Stat1, Mettl3/Irf1, Mettl14/Stat1, or Mettl14/Irf1 CT26 cells were obtained and validated the effect via Western blot (Fig EV5A and B). We next compared the tumor growth of these double knockout cells with tumors lacking Mettl3 or Mettl14 only under immunotherapy. Double loss of Mettl3/Stat1, Mettl3/Irf1, Mettl14/Stat1, and Mettl14/Irf1 reversed the observed effects on Mettl3‐ or Mettl14‐deficient tumor growth (Figs 3I and EV5C–E). Moreover, the mice bearing these double knockout of Mettl3/Stat1, Mettl3/Irf1, Mettl14/Stat1, and Mettl14/Irf1 tumors have quite similar survival rate compared to control, whereas shortened survival than depleted Mettl3 or Mettl14 only (Fig EV5F). Thus, these data demonstrate that Stat1 and Irf1 are the main targets regulated by both Mettl3 and Mettl14.
Figure EV5. Stat1 and Irf1 are targets regulated by Mettl3 and Mettl14 (Related to Fig 3).
-
A, BImmunoblot analysis of the protein levels of Mettl3, Mettl14, Irf1, and Stat1 in CT26 cells as indicated. Gapdh served as a control.
-
C–ETumor growth in BALB/c mice bearing the lacking indicated genes treated with PD‐1 antibody. Each line represents one mouse.
-
FSurvival analysis of tumors with the lacking indicated genes and control were observed in CT26 colon cancer. n, the numbers of mice. Data are mean ± SEM of the indicated number of mice in each group. **P < 0.01 by Student's t‐tests.
Source data are available online for this figure.
Role of Mettl3 and Mettl14 in tumor cells response to IFN‐γ
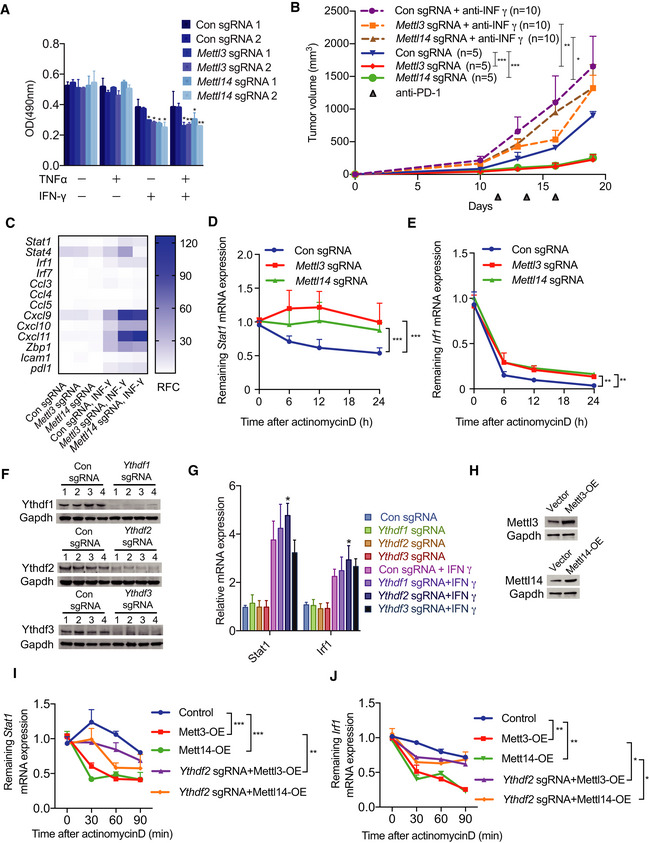
IFN‐γ signaling is a key contributor in adaptive and acquired resistance to the checkpoint blockade therapeutic strategy and has impressive effects on antitumor immune responses (Sharma et al, 2017). We next investigated whether depletion of Mettl3 or Mettl14 could improve the response of tumor cells to IFN‐γ. To this purpose, we first assessed whether IFN‐γ has the effect on the growths of cells with knockout of Mettl3 or Mettl14. The results of cellular proliferation assay showed that Mettl3 or Mettl14 deficiency indeed sensitized CT26 cells to IFN‐γ, and combined IFN‐γ and TNFα‐induced growth inhibition, but not TNFα alone, indicating that IFN‐γ alone is sufficient to inhibit Mettl3 or Mettl14 deficient cell growth (Fig 4A). In line with this result, we also found that blocking of INFγ using anti‐IFN‐γ antibody in BALB/c mice partially reversed the inhibition of tumor growth by Mettl3 or Mettl14 depletion under immunotherapy, suggesting IFN‐γ is responsible for the observed Mettl3 or Mettl14 loss‐mediated suppression during immunotherapy (Fig 4B). Furthermore, transcriptional analysis of the Mettl3‐ or Mettl14‐deficient and control CT26 cells with or without the stimulation of IFN‐γ by qRT–PCR suggested that an increased expression of IFN‐γ pathway genes including Stat1 and Irf1, but no alteration of gene expression in unstimulated conditions (Fig 4C). Thus, the loss of Mettl3 or Mettl14 increased sensitivity to IFN‐γ treatment. To determine whether the increased mRNA levels of Stat1 and Irf1, in Mettl3 and Mettl14 null tumors, are a consequence of enhanced mRNA stability, we determined the half‐life of these mRNAs. Control and Mettl3‐ or Mettl14‐deficient cells with stimulation of IFN‐γ were treated with actinomycin D for 0, 6, 12, and 24 h, and then, mRNA stability was monitored using qRT–PCR. This analysis revealed that Mettl3‐ and Mettl14‐depleted cells contained more stabilized Stat1 and Irf1 mRNAs than control cells (Fig 4D and E), and this alternation is consistent with the observation of decreased m6A enrichment in 3′UTR of Stat1 and Irf1 in Mettl3‐ or Mettl14‐depleted tumors (Fig 3F).
Figure 4. Tumor cells with knockout of Mettl3 or Mettl14 exhibit enhanced response to IFNγ.
-
ACellular proliferation analysis of Mettl3‐ or Mettl14‐depleted and control CT26 cells treated with indicated combinations of cytokines for 48 h. The mean ± SD of three replicates is shown. *P < 0.05; **P < 0.01 by Student's t‐tests.
-
BBALB/c mice bearing Mettl3‐ or Mettl14‐deficient and control tumors were treated with IFNγ‐blocking antibody and PD‐1 antibody as indicated. Tumor size was measured over time. n, the numbers of mice. Data are mean ± SEM of the indicated number of mice. *P < 0.05; **P < 0.01; ***P < 0.001 by Student's t‐tests.
-
CQuantitative RT–PCR was performed to identify transcriptional changes of the IFN‐γ response gene expression (n = 3). Data are shown as the relative fold change (RFC, color coded bar).
-
D, EmRNA stability of Stat1 and Irf1 were measured by qRT–PCR in tumor cells treated with IFN‐γ and actinomycin D. Mean ± SD of n = 3. **P < 0.01; ***P < 0.001 by Student's t‐tests.
-
FValidation the effect of knockout of Ythdf1‐3 using Western blotting, Gapdh served as a loading control.
-
GqPCR analysis of Stat1 and Irf1's expression in the indicated depletion of CT26 cells with/without stimulation of IFN‐γ. Mean ± SD of n = 3. *P < 0.05 by Student's t‐tests.
-
HWestern blot analysis of Mettl3 and Mettl14 in overexpressed CT26 cells. Gapdh served as a loading control for each.
-
I, JqPCR analysis of the mRNA stability of Stat1 and Irf1 in the indicated CT26 cells treated with IFN‐γ and actinomycin D. Mean ± SD of n = 3. *P < 0.05; **P < 0.01; ***P < 0.001 by Student's t‐tests.
Source data are available online for this figure.
To further explore how Mettl3 and Mettl14 regulate gene expression through its readers, since the downstream functions of m6A rely on its readers‐YTH family proteins, we generated knockout of Ythdf1‐3 CT26 cells (Fig 4F) and then analyzed the expression of Stat1 and Irf1 in these Yths‐depleted cells with or without treatment of IFN‐γ by qRT–PCR. This analysis indicated that loss of Ythdf2 significantly increased the mRNA levels of Stat1 and Irf1 with stimulation of IFN‐γ (Fig 4G). Accordingly, depletion of Ythdf2 partially reversed decreased mRNA stability of Stat1 and Irf1 caused by overexpression of Mettl3 or Mettl14 in cells with stimulation of IFN‐γ and then treatment with actinomycin D for 0, 30, 60, and 90 min (Fig 4H–J). Altogether, these results support that Ythdf2‐mediated mRNA stability controls Stat1 and Irf1 expression of Mettl3 and Mettl14 regulated genes.
METTL3 and METTL14 were negatively correlated with STAT1 in human pMMR‐MSI‐L CRC colon tissue
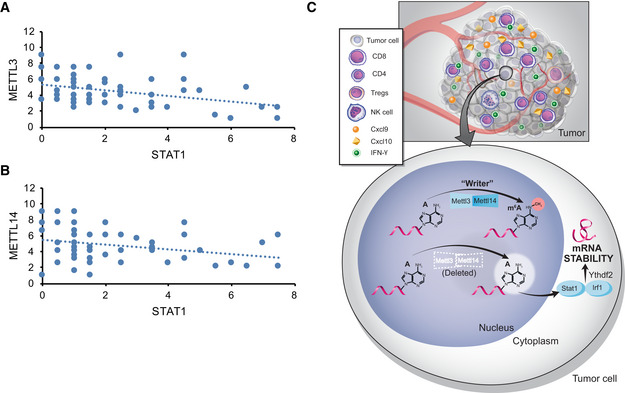
In agreement with our results of mouse model, we found a negative correlation between METTL3 or METTL14 and STAT1 in 59 patients with pMMR‐MSI‐L CRC tumors using immunohistochemistry (Fig 5A and B). Together, these results identify METTL3/14‐STAT1 axis as a regulator of IFN‐γ in pMMR‐MSI‐L CRC tumors and suggest that METTL3 and METTL14 inhibition could be a viable new strategy to sensitize these CRC tumors which are refractory to currently available immunotherapy treatments.
Figure 5. The negative correlation of METTL3, METTL14, and STAT1 in human pMMR‐MSI‐L CRC colon tissue.
-
A, BThe protein level of STAT1 was negatively correlated with METTL3 and METTL14 in human pMMR‐MSI-L CRC colon tissues (r 2 = −3.2477 for METTL3, r 2 = −2.7491 for METTL14). Each dot represents one tumor tissue.
-
CSchematic showing the functional and molecular mechanisms of Mettl3 and Mettl14 in antitumor immunotherapy.
Discussion
Overall, our work demonstrates that RNA‐modifying enzymes play a vital role in tumor survival during immunotherapy. Depletion of Mettl3 or Mettl14, core subunits of RNA methyltransferase, significantly slowed tumor growth and prolonged the survival in mouse bearing CT26 colorectal carcinoma and B16 melanoma with anti‐PD1 or anti‐PD1/GVAX treatments, respectively. Outside tumor cells, the elevation of CD8+ T cells in both Mettl3 and Mettl14 null tumors and NK cells in Mettl14 null tumors, accompanied by the increased production of cytokines and chemokines including IFN‐γ, Cxcl9, and Cxcl10 were detected, demonstrating the immune system and tumor microenvironment were altered under the abolishment of tumor m6A mRNA transferases. Inside tumor cells, the changes of the transcriptome profile in methyltransferase‐depleted tumor showed the activation of IFN‐γ signaling was pivotal to re‐sensitize tumor cells to immunotherapy. Epitranscriptome analysis indicated the loss of m6A modification on the transcripts in IFN‐γ‐Stat1‐Irf1 axis contributed to their stabilization mediated by m6A reader Ythdf2 thereby account for the upregulation of IFN‐γ signaling and the change of tumor microenvironment. Furthermore, the depletion of Mettl3 or Mettl14 increased sensitivity to IFN‐γ in tumor cells (Fig 5C). Lastly, based on the in vivo and in vitro observations, a negative correlation between METTL3/14 and STAT1 expression was also revealed in pMMR‐MSS colorectal carcinoma patients to further substantiate the clinical value of our discovery.
It is worth noting that depletion of Mettl3 or Mettl14 alone did not affect tumor growth in mice, highlighting the unique role of m6A in the tuning of certain pathways regulating immunotherapy. Previous studies reported that Mettl3 or Mettl14 depletion alone was able to affect cell proliferation or tumor growth in leukemia (Barbieri et al, 2017; Vu et al, 2017; Weng et al, 2018), glioblastoma (Cui et al, 2017), and hepatocellular carcinoma (Ma et al, 2017; Chen et al, 2018). In this study, however, the effect of RNA m6A modification machinery loss on tumors only emerged under immunotherapy. These findings highlight that the function of m6A mRNA modification varies under different physiological context and the role it plays to help tumors undergo specific external stresses like that from the immune system.
IFN‐γ‐Stat1‐Irf1 axis plays an essential role in the interaction between tumor and immune system. The protective role of IFN‐γ against implanted, chemically induced, and spontaneous tumors have been recorded in numerous studies since the mid‐1990s (Dunn et al, 2002). At the molecular level, our MeRIP‐seq and RNA‐seq revealed the suppression of m6A on the 3′UTR of Stat1 and Irf1 mRNA coupled with the elevation of their abundance. Accordingly, we also observed increased mRNA expression of Cxcl9, Cxcl10 and production of Cxcl9, and Cxcl10 in tumors. Given that the extracellular secretion of Cxcl9‐mediated lymphocytic infiltration to the tumor and suppressed tumor growth (Gorbachev et al, 2007), and Cxcl10 level was positively correlated with the number of circulating lymphocytes (Sridharan et al, 2016). Thus, it is likely that the activation of these chemokine genes and the elevation of their level within the intratumor environment, discovered in this study, accounts for the increased CD8+ TILs and intratumor IFN‐γ level, explaining the tumor inhibition by PD‐1 antibody treatment.
Interestingly, a recent study reported that the knockdown of FTO sensitized melanoma cells to IFN‐γ through the increase of m6A enrichment and consequently destabilization of transcripts encoded by melanoma promoting genes, including PD‐1, CXCR4, and SOX10 (Yang et al, 2019). At a first glance, this may seem that there is a discrepancy about the role that m6A modification machinery plays in tumor immunosurveillance that could be explained by the use of different experimental mouse model (Yang et al, 2019), but more importantly, our work on Mettl3/14 and the reported FTO findings (Yang et al, 2019) underscore the significance of epitranscriptomic regulation of molecular networks in response to certain stress conditions during tumorigenesis and tumor microenvironment altered by immunotherapy. Three recent reports further support the notion that the role of RNA modification machinery to regulate mechanism of gene expression is more complex that previously envisioned. (a) Changes in m6A mRNA levels by knockdown of either METTL14 or ALKBH5 inhibited cancer growth and invasion (Panneerdoss et al, 2018). ALKBH5/METTL14 formed a positive feedback loop with RNA stability factor HuR to regulate the stability of target transcripts. Further, hypoxia altered the level/activity of RNA modification machinery and expression of specific transcripts in cancer cells (Panneerdoss et al, 2018). (b) By developing and employing a new method, m6A‐Crosslinking‐Exonuclease‐sequencing (m6ACE‐seq), to map transcriptome‐wide m6A and m6Am at quantitative single‐base‐resolution, Goh and colleagues discovered that both ALKBH5 and FTO maintained their regulated sites in an unmethylated steady‐state (Koh et al, 2019). (c). The role of ALKBH5 in enhancing anti‐PD‐1 immunotherapy involves regulation of lactate content in the tumor microenvironment and the composition of tumor‐infiltrating Treg and myeloid‐derived suppressor cells (Li et al, 2020). Remarkably, ALKBH5 inhibition by a small molecule resulted in a similar phenotype and sensitized tumors to immunotherapy, indicating future translational potential of targeting m6A regulating machinery in cancers (Li et al, 2020). However, these studies do not exclude the possibility that specific RNA modifications are written and erased under various stress conditions by translocation of enzymes. Therefore, dynamic imbalance of m6A modification machinery location and function may affect the tumor progression and immunotherapy responses.
Despite the success of immunotherapy in the past decade, pMMR‐MSI‐L subtype colorectal cancer, the vast majority of CRC patients carried, failed to benefit from any immunotherapy alone (Ganesh et al, 2019). The lack of recruitment of immune cell to the tumor seems the primary reason since microsatellite instability‐high (pMMR‐MSI‐H) colorectal cancer (Llosa et al, 2015), another subtype of CRC that responds well to immunotherapy, is featured by an interferon‐rich microenvironment and heavily infiltrated immune cells like CD8+ TILs, CD4+ (Th1) TILs, and macrophages (Deschoolmeester et al, 2011). Our results revealed that suppression of m6A modification sensitized tumors to immunotherapy by altering the tumor microenvironment and recruitment of CD8+ TILs. Notably, the growth inhibitory effects in Mettl3/14‐depleted tumors we observed in the study were comparable to that of multiple combinatorial immunotherapy regimens (anti‐PD‐1+anti‐CTLA‐4). Thus, it is exciting to imagine the possibility that our study opens doors to combine immunotherapy with newly developed methyltransferase inhibitors for CRC therapy.
Taken together, we found the suppression of m6A modification enhanced response to immunotherapy in colorectal carcinoma and melanoma. This sensitization effect in CRC tumors is mediated by the elevated Stat1 and Irf1 expression whose mRNA transcripts were stabilized by the decreased m6A enrichment. This study demonstrates the essential role of m6A writer in the maintenance of tumor surveillance to immunotherapy. The inhibition of m6A writers also provides the opportunity to overcome the barrier in the pMMR‐MSI‐L colorectal cancer immunotherapy.
Materials and Methods
All studies were conducted in accordance with approved IRB protocols by the University of California, San Diego. All animal work was approved by the Institutional Review Board at the University of California, San Diego, and was performed in accordance with Institutional Animal Care and Use Committee guidelines.
Cell culture and viral infection
CT26 (CRL‐2638; murine colon carcinoma) and B16F10 (CRL‐6475; murine melanoma) were all purchased from ATCC. B16‐GM‐CSF cell line was a kind gift from Drs. Glenn Dranoff and Michael Dougan (Dana‐Farber/Harvard Cancer Center). These cell lines were cultured in DMEM, RPMI (Gibco) supplemented with 10% fetal bovine serum (Gibco) at 37°C in 5% CO2 incubators. HEK293FT cells were resuspended in DMEM and co‐transfected with CRISPR V2 backbones with the indicated sgRNA, and packaging plasmids psPAX2, and pMD2.G in 10 cm dish using Lipofectamine (Life Technologies, 11668027) in Opti‐MEM medium (Gibco). The medium was replaced with fresh completed DMEM after 4–6 h. The supernatant was harvested after 48 h and then infect cells by spin transduction. Finally, cells were selected by puromycin (Alfa Aesar, Thermo Fisher Scientific) or blasticidin (Alfa Aesar, Thermo Fisher Scientific). SgRNA used in this work was as follows: Mettl3‐sgRNA1: TAGGCACGGGACTATC ACTACACCG; Mettl3‐sgRNA2: TCAGGTGATTACCGTAGAGA; Mettl3‐sgRNA3: AGGTAGCAGGGACCATCGCA; Mettl3‐sgRNA4: CTGAAGTGCAGCTTGCGACA; Mettl14‐sgRNA1: GTCCAGTGTCTACAAAATGT; Mettl14‐sgRNA2: CACTGAACTACTTACATGGG; Mettl14‐sgRNA3: ATCAACTTACTACTCTCCCA; Mettl14‐sgRNA4: GCTGGACCTGGGATGATGTA. Ythdf1‐sgRNA1: AGCAGCCACTTCAACCCCGC; Ythdf1‐sgRNA2: TGAACACGGCAACAAGCGCC; Ythdf1‐sgRNA3: GACTTTGAGCCCTACCTTTC; Ythdf1‐sgRNA4: ACAAAAGGACAAGATAATAA. Ythdf2‐sgRNA1: CGAACCTTACTTGAGCCCAC; Ythdf2‐sgRNA2: GCCGCCTATCGTTCCATGAA; Ythdf2‐sgRNA3: TCGCAGAGACCAAAAGGTCA; Ythdf2‐sgRNA4: AGATTCCAGTCGAAATCTTT. Ythdf3‐sgRNA1: TGAGCATGGTAATAAGCGTT; Ythdf3‐sgRNA2: AAGCCGGTTCCCCTATTCCG; Ythdf3‐sgRNA3: AAGAATGTCAGCCACTAGCG; Ythdf3‐sgRNA4: CTTAAGTAGCCAGACAAATC.
Immunoblotting
Proteins from cells or fresh mice tumors were extracted using RIPA lysis buffer by homogenization followed by centrifugation to remove insoluble material and clarified supernatant was measured using BCA protein assay kit (Bio‐Rad). Subsequently, 50–150 μg of protein was resolved by NuPAGE Bis‐Tris or 10% Tris‐Glycine gels and transferred to PVDF membranes (Bio‐Rad). Membranes were blocked in 5% milk TBST buffer and then incubated with the indicated antibodies including Mettl3 (Abcam, ab195352), Mettl14 (Fisher Scientific, ABE1338MI), Gapdh (PROTEINTECH GROUP, HRP‐60004), Stat1 (PROTEINTECH GROUP, 10144‐2‐AP), p‐Stat1 (Cell Signaling Technology), Irf1 (PROTEINTECH GROUP, 11335‐1‐AP), Ythdf1 (PROTEINTECH GROUP, 17479‐1‐AP), Ythdf2 (PROTEINTECH GROUP, 24744‐1‐AP), and Ythdf3 (Sigma‐Aldrich, Inc., SAB2108258) overnight at 4°C. After being washed, membranes were incubated with HRP‐conjugated secondary antibodies at 25°C for 1 h and visualized on autoradiography film (Genesee Scientific Inc, 30‐100) using the enhanced chemiluminescence (ECL) detection system (Thermo Scientific).
Animal models
BALB/c and C57BL/6J mice (6–8 week) used for study were purchased from The Jackson Laboratory. 2 × 10⁶ CT26 cells with knockout of Mettl3, Mettl14, Mettl3/Stat1, Mettl3/Irf1, Mettl14/Stat1, or Mettl14/Irf1 and control were suspended in 200 μl of PBS/Matrigel (Corning) (1:1) and then subcutaneously inoculated into flank of each mouse. BALB/c mice bearing CT26 tumors were injected intraperitoneally (i.p.) with 200 μg (10 mg/kg) of anti‐CTLA‐4 (Bio X Cell, mCD152) and/or anti‐PD1 (Bio X Cell, clone 29F.1A12) and IgG (Bio X Cell, clone 2A3, BE0089) antibodies on days 11, 14, 17, 20, and 23 as recommended. (Kim et al, 2014) For the in vivo CD8 depletion study, CT26 tumor‐bearing mice were additionally treated i.p. with 200 μg (10 mg/kg) of anti‐CD8 antibody (Bio X Cell, clone YTS169.4) twice a week starting on day 8 and also injected i.p. with 200 μg (10 mg/kg) of anti‐PD1 antibody as indicated. For the in vivo IFN‐γ blocking assay, BALB/c mice bearing the indicated tumors were treated i.p. with 200 μg (10 mg/kg) of anti‐IFN‐γ antibody (Bio X Cell, Clone: XMG1.2) every 2 days starting on day 7 and also injected i.p. with 200 μg (10 mg/kg) of anti‐PD1 antibody as indicated. 0.5 × 10⁶ B16 cells with knockout of Mettl3, Mettl14, and control were implanted into the left flank, and 1 × 10⁶ irradiated (100 Gy) B16‐GM‐CSF cells (GVAX) were injected into the right flank of each C57BL/6J mouse on days 1 and 4. B16 tumor‐bearing mice were given a dose of 200 μg (10 mg/kg) of anti‐PD1 antibody i.p. on days 6 and 9. For the in vivo depletion study, B16 tumor‐bearing mice were treated i.p. with 200 μg (10 mg/kg) of anti‐CD8 antibody (Bio X Cell, clone YTS169.4) twice a week starting on day 3 and also injected i.p. with 200 μg (10 mg/kg) of anti‐PD1 antibody and GVAX were injected into the right flank as indicated. Tumor volumes were calculated according to the formula: volume (mm3) = (longer diameter × shorter diameter2)/2. Mice were monitored every 2 days as indicated. All animal studies were approved by the Institutional Animal Care and Use Committee of University of California, San Diego.
Flow cytometry analysis of tumor cells
Tumors with knockout of Mettl3, Mettl14, and control were collected from mice, weighted, mechanically diced, and then digested with 2 mg/ml collagenase P (Sigma‐Aldrich) and 50 μg/ml DNase I (Sigma‐Aldrich) at 37°C for 30 min. Then, these samples were filtered through 70‐μm cell strainers and washed by cell staining buffer (BioLegend). The red blood cells were lysed with lysis buffer (BioLegend, 420301). After counting viable cells and these cells were blocked with TruStain FcX (anti‐mouse CD16/32) antibody (BioLegend) and then incubated with Zombie Aqua Live/Dead fixable dye (BioLegend, 423102). Subsequently, specific antibodies recognized cell surface markers were stained. The intracellular staining procedures followed by the BioLegend protocol as recommended. Briefly, cells were fixed with fixation buffer (BioLegend, 420801), permeabilized, and stained with predetermined optimum combination of antibodies. Meanwhile, BD Compensation Beads (BD Biosciences, 552845) were used to optimize fluorescence compensation settings for multicolor flow cytometric analysis. Information about all the antibodies used in the flow cytometry analysis is provided below. CD45 (clone 30‐F11), CD3ε (clone 145‐2C11), CD4 (clone RM4‐5), CD8 (clone 53‐6.7), NK1.1(clone PK136), FoxP3 (clone MF‐14), granzyme B (clone QA16A02), and all the antibodies were purchased from BioLegend.
Production of cytokine/chemokine analysis
Intratumoral cytokine extraction from freshly harvested CT26 tumors and serum samples were prepared as described previously (Amsen et al, 2009; Veinalde et al, 2017). The productions of IFN‐γ, Cxcl9, and Cxcl10 were measured using IFN‐γ Mouse ELISA Kit (Invitrogen, 88‐7314‐22), mouse CXCL9 ELISA Kit (Fisher Scientific, EMCXCL9), and mouse CXCL10 ELISA Kit (Fisher Scientific, EMCXCL10) according to the manufacturer's instructions, respectively.
RNA isolation and quantitative real‐time PCR
Total RNA was extracted from fresh tumors using Direct‐zol RNA MiniPrep Kit (Zymo Research, 11‐331) and RNA extraction form cultured cells using Quick‐RNA Miniprep Kit (Zymo Research, R1055) following the manufacturer's instructions. Gene expression was analyzed as previously described (Mu et al, 2018). cDNA was generated using the iScript Reverse Transcription Synthesis Kit (Bio‐Rad, 1708841) and quantitative real‐time PCR was used SsoAdvanced Universal SYBR Green PCR SuperMix (Bio‐Rad, 1725270). All primers used for qPCR are listed in Table EV1.
RNA‐Seq
Total RNA was isolated from CT26 tumors with knockout of Mettl3, Mettl14, and control (five mice tumors for biological replicates in each group). RNA‐seq library preparation and sequencing were performed at the IGM Genomics Center, UCSD using Illumina HiSeq 4000. For the analysis, single‐end reads were trimmed by cutadapt (v1.18) then mapped to mouse genome (mm10) using HISAT2 (v2.1.0). Transcripts were quantified by HTSeq (0.11.2), and differential expressed genes (DEGs) were then determined by DESeq2.
MeRIP‐Seq and MeRIP‐qPCR
mRNA was isolated from tumors using RiboMinus Transcriptome Isolation Kit (life technology, K1500‐02) followed by the procedures as recommended. Purified mRNA samples were fragmented to 100–200 nucleotides with Fragmentation Reagents Kit (Invitrogen, AM8740) according to the manufacturer's protocol. 10% of total fragmented RNA was reserved as an input sample and the rest of fragmented RNA was further used for m6A immunoprecipitation with the anti‐N6‐methyladenosine (m6A) antibody (abcam, ab151230) in 500 μl IP binding buffer (150 mM NaCl, 10 mM Tris–HCl, pH 7.5, 0.1% NP‐40) with RNase inhibitor at 4°C for 2 h and then adding the washed protein A/G magnetic beads (NEB) by IP binding buffer to the RNA‐antibody immunoprecipitation mixture to rotate at 4°C for 2 h. The collected magnetic beads were washed twice in IP binding buffer, twice in low salt reaction buffer (50 mM NaCl, 10 mM Tris–HCl, pH 7.5, 0.1% NP‐40) and twice in high salt reaction buffer (500 mM NaCl, 10 mM Tris–HCl, pH 7.5, 0.1% NP‐40). The bound RNA was eluted from beads by adding 30 μl RLT buffer (QIAGEN) and incubated for 5 min at 25°C. Lastly, the eluted RNA was purified by ethanol precipitation and prepared for library generation using a TruSeq mRNA library preparation kit (Illumina). Sequencing was performed at IGM Genomics core, UCSD on an Illumina HiSeq4000 machine. Detection for enriched peaks in m6A immunoprecipitation samples was performed by model‐based analysis of ChIP‐seq (MACS2) algorithm (v2.1.0), peaks were detected if their FDR was < 5% and fold enrichment was higher than 1. High‐confidence peaks in both biological replicate samples were found by BEDtools intersect function. De novo motif search was performed by HOMER (v4.10). For m6A‐MeRIP‐qPCR, we adopted the same protocol above, m6A enrichment was determined by qPCR analysis with indicated primers on LightCycler 480 (Roche Diagnostics). Ctla4 without m6A‐modified transcript was used as negative control.(Wang et al, 2019) All primers used for MeRIP‐qPCR are listed in Table EV1.
Dot‐blot assays
mRNA from fresh tumors was isolated using Magnetic mRNA Isolation Kit (New England Biolabs, S1550S) and then denatured at 95°C for 3 min, followed by chilling on ice. Quantified mRNA was spotted on an Amersham Hybond‐N+ membrane (GE Healthcare, RPN3050B) and crosslinked to the membrane with UV radiation. The membrane was blocked in 5% of non‐fat milk PBST buffer and then incubated with anti‐m6A antibody (1: 2,000; abcam) overnight at 4°C. After incubating with HRP‐conjugated secondary antibodies, the membrane was visualized by SuperSignal West Femto Maximum Sensitivity Substrate (Thermo Fisher Scientific).
In vitro cytokines stimulation
Mettl3‐ or Mettl14‐deficient CT26 cells and control cells were cultured in 12‐well plates in RPMI/10% FBS with the indicated combinations of cytokines: TNFα (10 ng/ml, PeproTech) and IFN‐γ (100 ng/ml, BioLegend). Cells were further analyzed after 60 h.
Cell proliferation assays
A total of 2000 cells were plated in the 96‐well plate, cells with the indicated sgRNA were determined by CellTiter AQueous One Solution Cell Proliferation Assay kit (Promega, G3580) following the manufacturer's instructions. Briefly, adding 20 μl of CellTiter Reagent into each well of the 96‐well plate containing the cells. Incubating the plate at 37°C in 5% CO2 incubators for 1–2 h, and then record the absorbance at 490 nm.
mRNA stability measurements
An mRNA stability measurement assay was performed as previously reported.(Wei et al, 2018a; Wang et al, 2019). Briefly, CT26 cells with knockout of Mettl3, Mettl14, and control or overexpression of Mettl3, Mettl14, and a combination with depletion of Ythdf2 were stimulated with IFN‐γ. After 48 h, 5 μg/ml of Actinomycin D (Alfa Aesar, AAJ67160XF) was added for 0, 6, 12, and 24 h or 0, 30, 60, 90 min as indicated and then these cells were collected. Subsequently, mRNA levels were quantified by RT–qPCR with gene‐specific qPCR primers (Table EV1).
Immunohistochemistry
Human colon cancer tissues used in this study were obtained from US Biomax.inc. The staining analysis followed the previous description. (Mu et al, 2018) Briefly, slides of paraffin‐embedded from human and mouse tissue were deparaffinized in xylene and rehydrated in graded ethanol (5 min in 100%, 5 min in 95%, and 5 min in 75%) and then washed by PBS containing 0.3% Triton X‐100 (Sigma‐Aldrich) (PBST) for three times. Sections were pretreated with antigen retrieval with Tris/EDTA buffer pH 9.0, rinsed three times with PBST, incubated with 3% H2O2 in PBS at 37°C for 10 min. After blocking with 5% goat serum (Cell Signaling Technology, 5425S) in PBST for 1 h, tissue slides were incubated at 4°C overnight with primary antibodies as follows: Mettl3 (Abcam, ab195352), Mettl14 (Fisher Scientific, ABE1338MI), Stat1(PROTEINTECH GROUP, 10144‐2‐AP), MSH2 (PROTEINTECH GROUP,15520‐1‐AP), Ki‐67 (Cell Signaling Technology, 12202T), and CD8 (Cell Signaling Technology, 98941T). Then, the sections were washed by PBST for five times, incubated with biotinylated goat anti‐rabbit IgG (Vector laboratories, BA‐1000) at 25°C for 1 h and treated with AEC substrate kit (Vector laboratories, SK‐4205) for 5 min and then counterstained with hematoxylin. Finally, all the mouse and human colon tissue slides were imaged. For the human colon cancer slides, images were obtained and semiquantitative evaluation of staining was scored as follows: score = percentage of malignant cells staining positive (0 < 10%; 1, 10–25%; 2, 25–50%; 3, > 50%) × mean stain intensity (0–3) as previously defined (Lin et al, 2014).
Statistical analysis
Results were analyzed using Prism 5.0 software (GraphPad) and presented as mean ± SEM (standard error) or mean ± SD (standard deviation) as indicated. P values were calculated using Student's t‐tests and considered to be statistically significance at P < 0.05.
Author contributions
LW designed and performed the experiments, analyzed the data, and wrote the manuscript; HH, KA, and YK performed the bioinformatics analyses; NL, RT, and JY performed experiments; TMR conceived, designed, and planned the project, and participated in experimental design, data analysis, data interpretation, and manuscript writing.
Conflict of interest
T.M.R. is a founder of ViRx Pharmaceuticals and has an equity interest in the company. The terms of this arrangement have been reviewed and approved by the University of California San Diego in accordance with its conflict of interest policies.
Supporting information
Expanded View Figures PDF
Table EV1
Dataset EV1
Dataset EV2
Dataset EV3
Source Data for Expanded View
Review Process File
Source Data for Figure 1
Source Data for Figure 3
Source Data for Figure 4
Acknowledgements
We thank Drs. Glenn Dranoff and Michael Dougan for providing the B16 (GVAX) cells. We also thank Ye Wang (Peking University, Beijing, China) for help in RNA‐seq and m6A‐seq data analysis, Dr. Kristen Jepsen of the Institute of Genomic Medicine at UCSD for help with the HTSeq, Dr. Neal Sekiya, and Ms. Tara Rambaldo at the Center for AIDS Research at UCSD for flow cytometry analysis, Dr. M. Valeria Estrada at the Biorepository and Tissue Technology Shared Resource at UC San Diego Moores Cancer Center for Histology and Immunohistochemistry, and members of the Rana laboratory for helpful discussions and advice. This publication includes data generated at the UC San Diego IGM Genomics Center utilizing an Illumina NovaSeq 6000 that was purchased with funding from a National Institutes of Health SIG grant (#S10 OD026929). This work was supported in part by grants from the National Institutes of Health (CA177322, DA039562, DA046171, and AI 125103).
The EMBO Journal (2020) 39: e104514
Data availability
The RNA‐seq data and MeRIP‐Seq data in this study were deposited at the Gene Expression Omnibus (GEO, https://www.ncbi.nlm.nih.gov/geo/) database with an accession number GSE142589 (related to Fig 3).
References
- Alexandrov LB, Nik‐Zainal S, Wedge DC, Aparicio SA, Behjati S, Biankin AV, Bignell GR, Bolli N, Borg A, Børresen‐Dale A‐L (2013) Signatures of mutational processes in human cancer. Nature 500: 415 [DOI] [PMC free article] [PubMed] [Google Scholar]
- Amsen D, de Visser KE, Town T (2009) Approaches to determine expression of inflammatory cytokines. In Inflammation and Cancer (Springer), pp. 107–142 [DOI] [PMC free article] [PubMed]
- Ayers M, Lunceford J, Nebozhyn M, Murphy E, Loboda A, Kaufman DR, Albright A, Cheng JD, Kang SP, Shankaran V et al (2017) IFN‐gamma‐related mRNA profile predicts clinical response to PD‐1 blockade. J Clin Invest 127: 2930–2940 [DOI] [PMC free article] [PubMed] [Google Scholar]
- Barbieri I, Tzelepis K, Pandolfini L, Shi J, Millán‐Zambrano G, Robson SC, Aspris D, Migliori V, Bannister AJ, Han N (2017) Promoter‐bound METTL3 maintains myeloid leukaemia by m6A‐dependent translation control. Nature 552: 126 [DOI] [PMC free article] [PubMed] [Google Scholar]
- Castro F, Cardoso AP, Gonçalves RM, Serre K, Oliveira MJ (2018) Interferon‐gamma at the crossroads of tumor immune surveillance or evasion. Front Immunol 9: 847 [DOI] [PMC free article] [PubMed] [Google Scholar]
- Chen M, Wei L, Law CT, Tsang FHC, Shen J, Cheng CLH, Tsang LH, Ho DWH, Chiu DKC, Lee JMF (2018) RNA N6‐methyladenosine methyltransferase‐like 3 promotes liver cancer progression through YTHDF2‐dependent posttranscriptional silencing of SOCS2. Hepatology 67: 2254–2270 [DOI] [PubMed] [Google Scholar]
- Cui Q, Shi H, Ye P, Li L, Qu Q, Sun G, Sun G, Lu Z, Huang Y, Yang C‐G (2017) m6A RNA methylation regulates the self‐renewal and tumorigenesis of glioblastoma stem cells. Cell Rep 18: 2622–2634 [DOI] [PMC free article] [PubMed] [Google Scholar]
- Deng X, Su R, Weng H, Huang H, Li Z, Chen J (2018) RNA N6‐methyladenosine modification in cancers: current status and perspectives. Cell Res 28: 507–517 [DOI] [PMC free article] [PubMed] [Google Scholar]
- Deschoolmeester V, Baay M, Lardon F, Pauwels P, Peeters M (2011) Immune cells in colorectal cancer: prognostic relevance and role of MSI. Cancer Microenviron 4: 377–392 [DOI] [PMC free article] [PubMed] [Google Scholar]
- Dominissini D, Moshitch‐Moshkovitz S, Schwartz S, Salmon‐Divon M, Ungar L, Osenberg S, Cesarkas K, Jacob‐Hirsch J, Amariglio N, Kupiec M et al (2012) Topology of the human and mouse m6A RNA methylomes revealed by m6A‐seq. Nature 485: 201–206 [DOI] [PubMed] [Google Scholar]
- Dunn GP, Bruce AT, Ikeda H, Old LJ, Schreiber RD (2002) Cancer immunoediting: from immunosurveillance to tumor escape. Nat Immunol 3: 991 [DOI] [PubMed] [Google Scholar]
- Ganesh K, Stadler ZK, Cercek A, Mendelsohn RB, Shia J, Segal NH, Diaz LA (2019) Immunotherapy in colorectal cancer: rationale, challenges and potential. Nat Rev Gastroenterol Hepatol 16: 361–375 [DOI] [PMC free article] [PubMed] [Google Scholar]
- Garcia‐Diaz A, Shin DS, Moreno BH, Saco J, Escuin‐Ordinas H, Rodriguez GA, Zaretsky JM, Sun L, Hugo W, Wang X (2017) Interferon receptor signaling pathways regulating PD‐L1 and PD‐L2 expression. Cell Rep 19: 1189–1201 [DOI] [PMC free article] [PubMed] [Google Scholar]
- Gorbachev AV, Kobayashi H, Kudo D, Tannenbaum CS, Finke JH, Shu S, Farber JM, Fairchild RL (2007) CXC chemokine ligand 9/monokine induced by IFN‐γ production by tumor cells is critical for T cell‐mediated suppression of cutaneous tumors. J Immunol 178: 2278–2286 [DOI] [PubMed] [Google Scholar]
- Han D, Liu J, Chen C, Dong L, Liu Y, Chang R, Huang X, Liu Y, Wang J, Dougherty U (2019) Anti‐tumour immunity controlled through mRNA m 6 A methylation and YTHDF1 in dendritic cells. Nature 566: 270 [DOI] [PMC free article] [PubMed] [Google Scholar]
- Honda K, Takaoka A, Taniguchi T (2006) Type I interferon gene induction by the interferon regulatory factor family of transcription factors. Immunity 25: 349–360 [DOI] [PubMed] [Google Scholar]
- Hsu PJ, Zhu Y, Ma H, Guo Y, Shi X, Liu Y, Qi M, Lu Z, Shi H, Wang J (2017) Ythdc2 is an N6‐methyladenosine binding protein that regulates mammalian spermatogenesis. Cell Res 27: 1115 [DOI] [PMC free article] [PubMed] [Google Scholar]
- Jaffrey SR, Kharas MG (2017) Emerging links between m(6)A and misregulated mRNA methylation in cancer. Genome Med 9: 2 [DOI] [PMC free article] [PubMed] [Google Scholar]
- Jenkins RW, Barbie DA, Flaherty KT (2018) Mechanisms of resistance to immune checkpoint inhibitors. Br J Cancer 118: 9 [DOI] [PMC free article] [PubMed] [Google Scholar]
- Jia G, Fu Y, Zhao X, Dai Q, Zheng G, Yang Y, Yi C, Lindahl T, Pan T, Yang Y‐G (2011) N6‐methyladenosine in nuclear RNA is a major substrate of the obesity‐associated FTO. Nat Chem Biol 7: 885 [DOI] [PMC free article] [PubMed] [Google Scholar]
- Khalil DN, Smith EL, Brentjens RJ, Wolchok JD (2016) The future of cancer treatment: immunomodulation, CARs and combination immunotherapy. Nat Rev Clin Oncol 13: 273 [DOI] [PMC free article] [PubMed] [Google Scholar]
- Kim K, Skora AD, Li Z, Liu Q, Tam AJ, Blosser RL, Diaz LA, Papadopoulos N, Kinzler KW, Vogelstein B (2014) Eradication of metastatic mouse cancers resistant to immune checkpoint blockade by suppression of myeloid‐derived cells. Proc Natl Acad Sci USA 111: 11774–11779 [DOI] [PMC free article] [PubMed] [Google Scholar]
- Koh CWQ, Goh YT, Goh WSS (2019) Atlas of quantitative single‐base‐resolution N6‐methyl‐adenine methylomes. Nat Commun 10: 5636 [DOI] [PMC free article] [PubMed] [Google Scholar]
- Kowanetz M, Zou W, Gettinger SN, Koeppen H, Kockx M, Schmid P, Kadel EE III, Wistuba I, Chaft J, Rizvi NA et al (2018) Differential regulation of PD‐L1 expression by immune and tumor cells in NSCLC and the response to treatment with atezolizumab (anti‐PD‐L1). Proc Natl Acad Sci USA 115: E10119–E10126 [DOI] [PMC free article] [PubMed] [Google Scholar]
- Le DT, Durham JN, Smith KN, Wang H, Bartlett BR, Aulakh LK, Lu S, Kemberling H, Wilt C, Luber BS et al (2017) Mismatch repair deficiency predicts response of solid tumors to PD‐1 blockade. Science 357: 409–413 [DOI] [PMC free article] [PubMed] [Google Scholar]
- Li A, Chen Y‐S, Ping X‐L, Yang X, Xiao W, Yang Y, Sun H‐Y, Zhu Q, Baidya P, Wang X (2017) Cytoplasmic m6A reader YTHDF3 promotes mRNA translation. Cell Res 27: 444 [DOI] [PMC free article] [PubMed] [Google Scholar]
- Li N, Kang Y, Wang L, Huff S, Tang R, Hui H, Agrawal K, Gonzalez GM, Wang Y, Patel SP et al (2020) ALKBH5 regulates anti‐PD‐1 therapy response by modulating lactate and suppressive immune cell accumulation in tumor microenvironment. Proc Natl Acad Sci USA 117: 20159–20170 [DOI] [PMC free article] [PubMed] [Google Scholar]
- Lichinchi G, Gao S, Saletore Y, Gonzalez GM, Bansal V, Wang Y, Mason CE, Rana TM (2016a) Dynamics of the human and viral m(6)A RNA methylomes during HIV‐1 infection of T cells. Nat Microbiol 1: 16011 [DOI] [PMC free article] [PubMed] [Google Scholar]
- Lichinchi G, Zhao BS, Wu Y, Lu Z, Qin Y, He C, Rana TM (2016b) Dynamics of human and viral RNA methylation during zika virus infection. Cell Host Microbe 20: 666–673 [DOI] [PMC free article] [PubMed] [Google Scholar]
- Lichinchi G, Rana TM (2019) Profiling of N(6)‐Methyladenosine in Zika Virus RNA and Host Cellular mRNA. Methods Mol Biol 1870: 209–218 [DOI] [PubMed] [Google Scholar]
- Lichterfeld M, Xu GY, Waring MT, Mui SK, Johnston MN, Cohen D, Addo MM, Zaunders J, Alter G, Pae E (2004) HIV‐1–specific cytotoxicity is preferentially mediated by a subset of CD8+ T cells producing both interferon‐γ and tumor necrosis factor–α. Blood 104: 487–494 [DOI] [PubMed] [Google Scholar]
- Lin Y, Zhang H, Liang J, Li K, Zhu W, Fu L, Wang F, Zheng X, Shi H, Wu S (2014) Identification and characterization of alphavirus M1 as a selective oncolytic virus targeting ZAP‐defective human cancers. Proc Natl Acad Sci USA 111: E4504–E4512 [DOI] [PMC free article] [PubMed] [Google Scholar]
- Liu J, Yue Y, Han D, Wang X, Fu Y, Zhang L, Jia G, Yu M, Lu Z, Deng X (2014) A METTL3–METTL14 complex mediates mammalian nuclear RNA N 6‐adenosine methylation. Nat Chem Biol 10: 93 [DOI] [PMC free article] [PubMed] [Google Scholar]
- Liu J, Harada BT, He C (2019) Regulation of gene expression by N(6)‐methyladenosine in cancer. Trends Cell Biol 29: 487–499 [DOI] [PMC free article] [PubMed] [Google Scholar]
- Llosa NJ, Cruise M, Tam A, Wicks EC, Hechenbleikner EM, Taube JM, Blosser RL, Fan H, Wang H, Luber BS (2015) The vigorous immune microenvironment of microsatellite instable colon cancer is balanced by multiple counter‐inhibitory checkpoints. Cancer Discov 5: 43–51 [DOI] [PMC free article] [PubMed] [Google Scholar]
- Ma JZ, Yang F, Zhou CC, Liu F, Yuan JH, Wang F, Wang TT, Xu QG, Zhou WP, Sun SH (2017) METTL14 suppresses the metastatic potential of hepatocellular carcinoma by modulating N6−methyladenosine‐dependent primary MicroRNA processing. Hepatology 65: 529–543 [DOI] [PubMed] [Google Scholar]
- Mandal R, Samstein RM, Lee KW, Havel JJ, Wang H, Krishna C, Sabio EY, Makarov V, Kuo F, Blecua P et al (2019) Genetic diversity of tumors with mismatch repair deficiency influences anti‐PD‐1 immunotherapy response. Science 364: 485–491 [DOI] [PMC free article] [PubMed] [Google Scholar]
- Manguso RT, Pope HW, Zimmer MD, Brown FD, Yates KB, Miller BC, Collins NB, Bi K, LaFleur MW, Juneja V (2017) In vivo CRISPR screening identifies Ptpn2 as a cancer immunotherapy target. Nature 547: 413 [DOI] [PMC free article] [PubMed] [Google Scholar]
- Meyer KD, Saletore Y, Zumbo P, Elemento O, Mason CE, Jaffrey SR (2012) Comprehensive analysis of mRNA methylation reveals enrichment in 3′UTRs and near stop codons. Cell 149: 1635–1646 [DOI] [PMC free article] [PubMed] [Google Scholar]
- Meyer KD, Jaffrey SR (2017) Rethinking m(6)A readers, writers, and erasers. Annu Rev Cell Dev Biol 33: 319–342 [DOI] [PMC free article] [PubMed] [Google Scholar]
- Mu Y, Yan X, Li D, Zhao D, Wang L, Wang X, Gao D, Yang J, Zhang H, Li Y (2018) NUPR1 maintains autolysosomal efflux by activating SNAP25 transcription in cancer cells. Autophagy 14: 654–670 [DOI] [PMC free article] [PubMed] [Google Scholar]
- Nachtergaele S, He C (2018) Chemical modifications in the life of an mRNA transcript. Annu Rev Genet 52: 349–372 [DOI] [PMC free article] [PubMed] [Google Scholar]
- Paliard X, de Waal Malefijt R, de Vries JE, Spits H (1988) Interleukin‐4 mediates CDS induction on human CD4+ T‐cell clones. Nature 335: 642 [DOI] [PubMed] [Google Scholar]
- Pandiyan P, Hegel JKE, Krueger M, Quandt D, Brunner‐Weinzierl MC (2007) High IFN‐γ production of individual CD8 T lymphocytes is controlled by CD152 (CTLA‐4). J Immunol 178: 2132–2140 [DOI] [PubMed] [Google Scholar]
- Panneerdoss S, Eedunuri VK, Yadav P, Timilsina S, Rajamanickam S, Viswanadhapalli S, Abdelfattah N, Onyeagucha BC, Cui X, Lai Z (2018) Cross‐talk among writers, readers, and erasers of m6A regulates cancer growth and progression. Sci Adv 4: eaar8263 [DOI] [PMC free article] [PubMed] [Google Scholar]
- Pautz A, Art J, Hahn S, Nowag S, Voss C, Kleinert H (2010) Regulation of the expression of inducible nitric oxide synthase. Nitric Oxide 23: 75–93 [DOI] [PubMed] [Google Scholar]
- Ping X‐L, Sun B‐F, Wang L, Xiao W, Yang X, Wang W‐J, Adhikari S, Shi Y, Lv Y, Chen Y‐S (2014) Mammalian WTAP is a regulatory subunit of the RNA N6‐methyladenosine methyltransferase. Cell Res 24: 177 [DOI] [PMC free article] [PubMed] [Google Scholar]
- Ramana CV, Chatterjee‐Kishore M, Nguyen H, Stark GR (2000) Complex roles of Stat1 in regulating gene expression. Oncogene 19: 2619 [DOI] [PubMed] [Google Scholar]
- Ribas A, Wolchok JD (2018) Cancer immunotherapy using checkpoint blockade. Science 359: 1350–1355 [DOI] [PMC free article] [PubMed] [Google Scholar]
- Samstein RM, Lee CH, Shoushtari AN, Hellmann MD, Shen R, Janjigian YY, Barron DA, Zehir A, Jordan EJ, Omuro A et al (2019) Tumor mutational load predicts survival after immunotherapy across multiple cancer types. Nat Genet 51: 202–206 [DOI] [PMC free article] [PubMed] [Google Scholar]
- Schreiber RD, Old LJ, Smyth MJ (2011) Cancer immunoediting: integrating immunity's roles in cancer suppression and promotion. Science 331: 1565–1570 [DOI] [PubMed] [Google Scholar]
- Sharma P, Allison JP (2015) The future of immune checkpoint therapy. Science 348: 56–61 [DOI] [PubMed] [Google Scholar]
- Sharma P, Hu‐Lieskovan S, Wargo JA, Ribas A (2017) Primary, adaptive, and acquired resistance to cancer immunotherapy. Cell 168: 707–723 [DOI] [PMC free article] [PubMed] [Google Scholar]
- Sridharan V, Margalit DN, Lynch SA, Severgnini M, Zhou J, Chau NG, Rabinowits G, Lorch JH, Hammerman PS, Hodi FS (2016) Definitive chemoradiation alters the immunologic landscape and immune checkpoints in head and neck cancer. Br J Cancer 115: 252 [DOI] [PMC free article] [PubMed] [Google Scholar]
- Tokunaga R, Zhang W, Naseem M, Puccini A, Berger MD, Soni S, McSkane M, Baba H, Lenz H‐J (2018) CXCL9, CXCL10, CXCL11/CXCR3 axis for immune activation–a target for novel cancer therapy. Cancer Treat Rev 63: 40–47 [DOI] [PMC free article] [PubMed] [Google Scholar]
- Townsend SE, Allison JP (1993) Tumor rejection after direct costimulation of CD8+ T cells by B7‐transfected melanoma cells. Science 259: 368–370 [DOI] [PubMed] [Google Scholar]
- Veinalde R, Grossardt C, Hartmann L, Bourgeois‐Daigneault M‐C, Bell JC, Jäger D, von Kalle C, Ungerechts G, Engeland CE (2017) Oncolytic measles virus encoding interleukin‐12 mediates potent antitumor effects through T cell activation. Oncoimmunology 6: e1285992 [DOI] [PMC free article] [PubMed] [Google Scholar]
- Vu LP, Pickering BF, Cheng Y, Zaccara S, Nguyen D, Minuesa G, Chou T, Chow A, Saletore Y, MacKay M (2017) The N6‐methyladenosine (m6A)‐forming enzyme METTL3 controls myeloid differentiation of normal hematopoietic and leukemia cells. Nat Med 23: 1369 [DOI] [PMC free article] [PubMed] [Google Scholar]
- Wang X, Lu Z, Gomez A, Hon GC, Yue Y, Han D, Fu Y, Parisien M, Dai Q, Jia G (2014) N6‐methyladenosine‐dependent regulation of messenger RNA stability. Nature 505: 117 [DOI] [PMC free article] [PubMed] [Google Scholar]
- Wang X, Zhao BS, Roundtree IA, Lu Z, Han D, Ma H, Weng X, Chen K, Shi H, He C (2015) N6‐methyladenosine modulates messenger RNA translation efficiency. Cell 161: 1388–1399 [DOI] [PMC free article] [PubMed] [Google Scholar]
- Wang H, Hu X, Huang M, Liu J, Gu Y, Ma L, Zhou Q, Cao X (2019) Mettl3‐mediated mRNA m6A methylation promotes dendritic cell activation. Nat Commun 10: 1898 [DOI] [PMC free article] [PubMed] [Google Scholar]
- Wei L‐H, Song P, Wang Y, Lu Z, Tang Q, Yu Q, Xiao Y, Zhang X, Duan H‐C, Jia G (2018a) The m6A reader ECT2 controls trichome morphology by affecting mRNA stability in Arabidopsis . Plant Cell 30: 968–985 [DOI] [PMC free article] [PubMed] [Google Scholar]
- Wei SC, Duffy CR, Allison JP (2018b) Fundamental mechanisms of immune checkpoint blockade therapy. Cancer Discov 8: 1069–1086 [DOI] [PubMed] [Google Scholar]
- Weng H, Huang H, Wu H, Qin X, Zhao BS, Dong L, Shi H, Skibbe J, Shen C, Hu C (2018) METTL14 inhibits hematopoietic stem/progenitor differentiation and promotes leukemogenesis via mRNA m6A modification. Cell Stem Cell 22: 191–205 e199 [DOI] [PMC free article] [PubMed] [Google Scholar]
- Wu F, Cheng W, Zhao F, Tang M, Diao Y, Xu R (2019) Association of N6‐methyladenosine with viruses and related diseases. Virol J 16: 133 [DOI] [PMC free article] [PubMed] [Google Scholar]
- Xiao W, Adhikari S, Dahal U, Chen Y‐S, Hao Y‐J, Sun B‐F, Sun H‐Y, Li A, Ping X‐L, Lai W‐Y (2016) Nuclear m6A reader YTHDC1 regulates mRNA splicing. Mol Cell 61: 507–519 [DOI] [PubMed] [Google Scholar]
- Yang S, Wei J, Cui Y‐H, Park G, Shah P, Deng Y, Aplin AE, Lu Z, Hwang S, He C (2019) m6A mRNA demethylase FTO regulates melanoma tumorigenicity and response to anti‐PD‐1 blockade. Nat Commun 10: 2782 [DOI] [PMC free article] [PubMed] [Google Scholar]
- Yue Y, Liu J, He C (2015) RNA N6‐methyladenosine methylation in post‐transcriptional gene expression regulation. Genes Dev 29: 1343–1355 [DOI] [PMC free article] [PubMed] [Google Scholar]
- Zenke K, Muroi M, Tanamoto KI (2018) IRF1 supports DNA binding of STAT1 by promoting its phosphorylation. Immunol Cell Biol 96: 1095–1103 [DOI] [PubMed] [Google Scholar]
- Zheng G, Dahl JA, Niu Y, Fedorcsak P, Huang C‐M, Li CJ, Vågbø CB, Shi Y, Wang W‐L, Song S‐H (2013) ALKBH5 is a mammalian RNA demethylase that impacts RNA metabolism and mouse fertility. Mol Cell 49: 18–29 [DOI] [PMC free article] [PubMed] [Google Scholar]
Associated Data
This section collects any data citations, data availability statements, or supplementary materials included in this article.
Supplementary Materials
Expanded View Figures PDF
Table EV1
Dataset EV1
Dataset EV2
Dataset EV3
Source Data for Expanded View
Review Process File
Source Data for Figure 1
Source Data for Figure 3
Source Data for Figure 4
Data Availability Statement
The RNA‐seq data and MeRIP‐Seq data in this study were deposited at the Gene Expression Omnibus (GEO, https://www.ncbi.nlm.nih.gov/geo/) database with an accession number GSE142589 (related to Fig 3).