

Abstract
Genetic variation in LRRK2 associates with the susceptibility to Parkinson's disease, Crohn's disease, and mycobacteria infection. High expression of LRRK2 and its substrate Rab10 occurs in phagocytic cells in the immune system. In mouse and human primary macrophages, dendritic cells, and microglia‐like cells, we find that Rab10 specifically regulates a specialized form of endocytosis known as macropinocytosis, without affecting phagocytosis or clathrin‐mediated endocytosis. LRRK2 phosphorylates cytoplasmic PI(3,4,5)P3‐positive GTP‐Rab10, before EEA1 and Rab5 recruitment to early macropinosomes occurs. Macropinosome cargo in macrophages includes CCR5, CD11b, and MHCII, and LRRK2‐phosphorylation of Rab10 potently blocks EHBP1L1‐mediated recycling tubules and cargo turnover. EHBP1L1 overexpression competitively inhibits LRRK2‐phosphorylation of Rab10, mimicking the effects of LRRK2 kinase inhibition in promoting cargo recycling. Both Rab10 knockdown and LRRK2 kinase inhibition potently suppress the maturation of macropinosome‐derived CCR5‐loaded signaling endosomes that are critical for CCL5‐induced immunological responses that include Akt activation and chemotaxis. These data support a novel signaling axis in the endolysosomal system whereby LRRK2‐mediated Rab10 phosphorylation stalls vesicle fast recycling to promote PI3K‐Akt immunological responses.
Keywords: LRRK2, macropinocytosis, phagocytosis, phosphorylation, Rab10
Subject Categories: Immunology, Membrane & Intracellular Transport
Rab10 phosphorylation by Parkinson's disease‐linked LRRK2 blocks macropinosome recycling and boosts CCL5‐induced AKT signalling in primary human and mouse phagocytic cells.
Introduction
Macropinocytosis, a process originally discovered in macrophages isolated from rats (Pratten & Lloyd, 1979), is a clathrin‐independent form of endocytosis with many similarities to the better understood process of phagocytosis (Canton, 2018). Both phagocytosis and macropinocytosis are actin‐dependent, with phagocytosis mediating internalization of large and insoluble cargo and macropinocytosis supporting internalization of small and soluble particles. Constitutive macropinocytosis occurs in monocytes, macrophages, and other phagocytic cells and may be critical for immune surveillance (Canton, 2018), although specific signaling pathways regulated by macropinocytosis are not well understood. Macropinocytosis can occur in non‐phagocytic cells as well, usually in acute response to growth factors. Possible roles include the uptake and turnover of misfolded proteins in Parkinson's disease (PD), Alzheimer's disease (AD), and amyotrophic lateral sclerosis (ALS; Holmes et al, 2013; Zeineddine et al, 2015; Evans et al, 2018). Without knowledge of proteins that specifically regulate macropinocytosis in endocytosis, most studies have explored the process using the small molecule inhibitors EIPA (5‐(N‐Ethyl‐N‐isopropyl)amiloride) and rottlerin (Sarkar et al, 2005; Koivusalo et al, 2010). However, while both molecules efficiently block macropinocytosis, they also may affect other forms of endocytosis under certain conditions (Canton, 2018).
Rab small GTPases can selectively control endocytic processes, vesicle formation, trafficking maturation, and recycling and degradation (Hutagalung & Novick, 2011; Wandinger‐Ness & Zerial, 2014). In phagocytosis, Rab35 drives phagosome formation, whereas Rab20 is critical in phagosome maturation (Shim et al, 2010). Rab proteins specific for macropinocytosis, macropinosome formation, and macropinosome maturation, have not previously been identified. The Rab10 gene is linked to human disease in several ways. Genetic variants in Rab10 associate with resilience to AD, and a phosphorylation site in the Rab10 switch II domain is upregulated by PD‐associated mutations in the LRRK2 protein kinase (Ridge et al, 2017). LRRK2‐mediated phosphorylation of Rab10 also appears upregulated by PD‐risk factor genetic variants like G2385R in LRRK2, with Rab10 phosphorylation changing the affinity of different binding proteins to the Rab10 effector loops (Steger et al, 2016). Our past work suggests LRRK2 phosphorylation of Rab10 may prolong Rab10 in an activated state by inhibiting Rab10 interactions with GAP proteins (Liu et al, 2018). While the specific role of Rab10 in cells linked to neurodegeneration is under investigation, recent work demonstrates Rab10 downregulates ciliogenesis in some types of cells and neurons in the brain (Steger et al, 2017). Further, in other cell lines, Rab10 may regulate ER dynamics and phagocytosis (Cardoso et al, 2010; English & Voeltz, 2013). Finally, Rab10 may facilitate the traffic of toll‐like receptor (TLR) complexes from the Golgi to the plasma membrane in macrophages exposed to lipopolysaccharides (LPS; Wang et al, 2010). This regulation may have relevance for TLRs important in binding protein fibrils associated with neurodegenerative diseases (Dzamko et al, 2017).
Herein, we find Rab10 expression drives the formation and maturation of macropinosomes in primary human and mouse phagocytic cells, without affecting other types of endocytosis or TLR4 signaling pathways. While Rab10‐positive macropinosomes normally rapidly recycle, GTP‐locked Rab10 stalls the vesicles in the cytoplasm that forces vesicle maturation to Lamp1‐positive endosomes. LRRK2‐mediated phosphorylation of membrane bound Rab10 blocks the interactions with EHBP1L1 that drive vesicle recycling. Through immunostaining approaches, we found that nearly all macrophage phospho‐Rab10 vesicles are transports for the GPCR‐chemokine receptor C‐C chemokine receptor type 5 (CCR5). Reducing Rab10 expression, or blocking LRRK2‐mediated Rab10 phosphorylation, strongly inhibits CCR5‐dependent Akt activation and downstream chemotaxis function. Together, these results provide evidence that Rab10 critically and specifically drives macropinocytosis in phagocytes. Manipulation of Rab10 and LRRK2 provides a new avenue to better understand constitutive vesicle internalization via macropinocytosis in controlling different immunological responses.
Results
Rab10 knockdown impairs macropinocytosis without affecting phagocytosis or clathrin‐mediated endocytosis
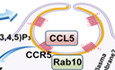
Recent RNA sequencing and single‐cell sequencing approaches have highlighted selective expression of Rab10 in phagocytes, particularly in monocytes and macrophages (Fig EV1). The only known protein kinase to phosphorylate Rab10, LRRK2, shares a similar restricted expression profile in immune cell subtypes. In our recent contributions to the development of validated monoclonal antibodies directed to Rab10 (validated with Rab10 knockdown, Fig EV1), we localized initial recruitment of Rab10 protein to well defined patches in macrophage plasma membrane ruffles (Fig EV1). These ruffles persisted into clear (but short‐lived) detached Rab10‐positive vesicles larger than 200 nm in diameter in the cytoplasm. Image stacks revealed distinct fully closed vesicles co‐labeled with the Akt‐PH domain. This process in macrophages, highlighted by Rab10, appeared structurally reminiscent of constitutive macropinocytosis, a poorly understood endocytosis pathway intrinsic in phagocytic cells.
Figure EV1. Rab10‐positive vesicles emergent from ruffled plasma membrane in macrophages.
-
A, BExpression profiles of Rab10 and LRRK2 in different immune cells. Data are adapted from DICE (Database of Immune Cell Expression, Expression quantitative trait loci eQTLs, and Epigenomics, https://dice-database.org/). Data are collected from immune cells derived from 91 human donors. Boxes indicate the 25–75% interquartile ranges. The vertical black lines in the boxes show the group mean. The whiskers indicate minimum to maximum value.
-
CMouse bone marrow derived macrophages (BMDMs) treated with DMSO, control ASO, or Rab10‐ASO1 were fixed and analyzed with anti‐(total)‐Rab10 antibody (shown in red). Representative confocal images are shown. Scale bar represents 50 μm.
-
DMouse bone marrow‐derived macrophages (BMDMs) were fixed and immunostained with Rab10 antibody (shown in red). Plasma membrane (phase contrast) was overlaid with Rab10‐fluorescent signals. Scale bar represents 2 μm.
-
ERaw264.7 cells were co‐transfected with Flag(N‐term)‐Rab10 or LRRK2, with eGFP(C‐term)‐tagged Akt‐PH domain. Cells were fixed and immunostained with Flag‐tag antibody, LRRK2 (shown in red), with epifluorescence (shown in green). Representative photomicrographs are shown. Scale bar represents 1 μm.
-
FRaw264.7 cells were transfected with eGFP(N‐term)‐Rab10. Representative Z‐stack images of Rab10 transfected cells collected with Airyscan microscopy are shown. Red dashed line is the intersection of y,z and yellow dashed line is x,z. Blue box is the x,y plane, red box is the y,z plane, and yellow box is the x,z plane. Scale bar represents 10 μm.
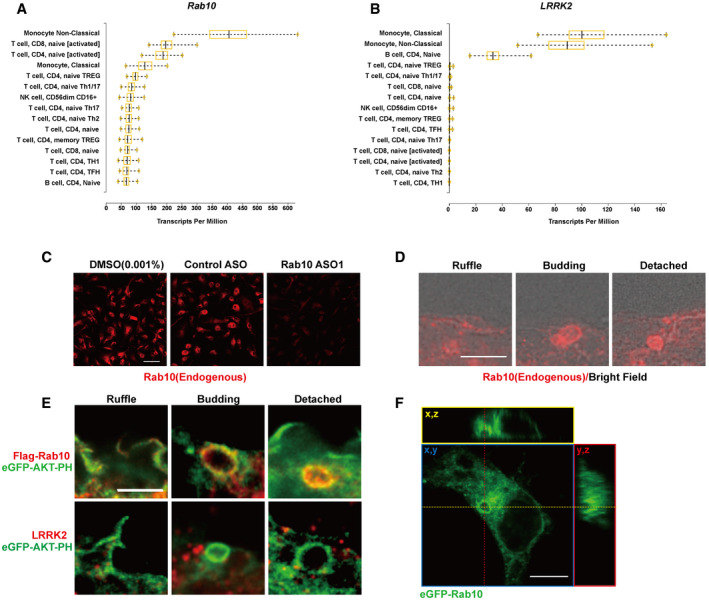
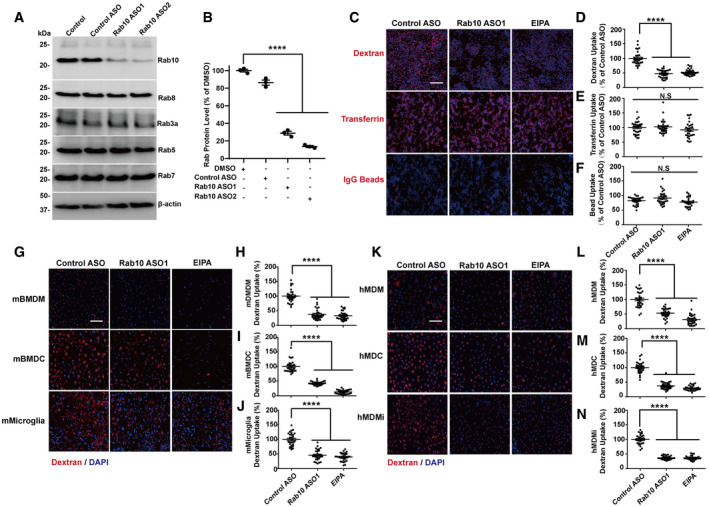
To determine if Rab10 knockdown affects macropinocytosis or other endocytosis processes in phagocytic cells, we first optimized effective knockdown strategies in macrophages that did not activate or induce morphological changes in the cells. Incubation of cells with low micromolar concentrations of 3rd generation stabilized antisense oligonucleotides (ASOs) specific for Rab10 efficiently reduced Rab10 expression in primary cells without macrophage activation (Table 1, Fig 1). Rab10‐directed ASOs reduced expression to ~10% of constitutive levels two days post‐ASO‐exposure without affecting the expression of proteins from the same Rab‐type I family including Rab8a, Rab7, Rab5, or Rab3a (Fig 1A and B). Feeding macrophages 70 kDa fluorescent dextran, a canonical marker often used to highlight macropinosomes, or IgG‐beads (used to highlight phagosomes), or fluorescent transferrin, revealed a severe impairment only in dextran uptake caused by Rab10 knockdown (Fig 1C–F). Other apparent morphological abnormalities in the plasma membrane or endolysosomal system due to Rab10 deficiency were not observed. We applied the same Rab10 knockdown strategy to both human and mouse primary monocyte‐derived cells polarized to macrophages (treated with M‐CSF), dendritic cells (treated with GM‐CSF), or microglia‐like cells (treated with IL‐34, NGF‐β, CCL2 (Ryan et al, 2017)), and in each case, dextran uptake was specifically inhibited, without apparent effect in other cell compartments. The degree of reduction of macropinocytosis caused by Rab10 deficiency was comparable to micromolar exposures of the small molecule macropinocytosis inhibitor EIPA (Fig 1G–N). Results and effect sizes with Rab10 knockdown in impairing macropinocytosis were robustly replicated in several other phagocyte cell lines and primary‐cultured cells from both human and mouse, and with a second independent‐targeting ASO (Fig EV2).
Table 1.
Sequences of antisense oligos
| ASO | Sequence |
|---|---|
| Control ASO “Ionis 676630” (CTRL) | mCmCoToAoTAGGAmCTATmCmCAoGoGoAA |
| Rab10 “Ionis 978453” (ASO1) | TmComCGoAAATATGTGGTAoGoTAmC |
| Rab10 “Ionis 978554” (ASO2) | GToTToCAGGATATGATmCoGoGmCT |
Black: unmodified deoxyribose (2'H); orange: 2’ methoxyethyl (MOE). Unmarked linkages: phosphorothioate (PS); linkages marked with o: normal phosphodiester (PO). mC: 5‐methylcytosine.
Figure 1. Rab10 expression regulates macropinocytosis.
-
ARaw 264.7 macrophage cells were treated with DMSO (0.05%), 1 μM control antisense oligonucleotide (ASO), or Rab10‐directed ASO (1 μM), for four days. Immunoblots are representative of three independent experiments, with similar results obtained.
-
BCalculated reduction of Rab10 (n = 3 biologically independent experiments). Each dot in the plot presents one independent experiment. Group means are shown. Error bars represent ± SEM. Significance was assessed by one‐way ANOVA with Tukey's post hoc test, with **** representing P < 0.0001.
-
CRaw 264.7 cells were treated with the indicated ASO for four days, or 50 μM EIPA (5‐[N-ethyl‐N-isopropyl]amiloride) for 20 min, prior to incubation for 60 min with fluorescent (tetramethylrhodamine, TRITC)‐labeled dextran (70 kDa, shown as red color), transferrin, or IgG‐conjugated agarose beads. Representative photomicrographs (from 30 images analyzed for each condition, from three biologically independent experiments) are shown. Cells were washed, fixed, and stained with DAPI (shown as blue color). Scale bars show 200 μm.
-
D–FRelative fluorescent signals were calculated as a percent of control‐ASO-treated cells to indicate (D) dextran or (E) transferrin uptake level. (F) For quantification of phagocytosis, the average number of IgG‐agarose beads internalized were calculated as a percent of control‐ASO-treated cells. Thirty images across three independent experiments were quantified for each condition, with each dot in the plot representing results from one image. The group means were calculated and shown. Error bars represent ± SEM. Significance was assessed by one‐way ANOVA with Tukey's post hoc test, with *** representing P < 0.0001, N.S P > 0.05.
-
GPrimary mouse bone marrow‐derived macrophage cells (BMDM) from adult male C57BL/6J mice were treated with murine cytokines to polarize cells toward a monocytic lineage (mBMDM), dendritic lineage (mBMDC), or microglia‐like lineage (mMicroglia, see Materials and Methods section). Cells were incubated with TRITC‐dextran for 30 min prior to washing, fixing, and staining with DAPI. Representative photomicrographs from 30 images analyzed for each condition from n = 3 biologically independent experiments are shown. Scale bars show 200 μm.
-
H–JRelative fluorescent signals were calculated as a percent of control‐ASO-treated cells. Thirty images across three independent experiments were quantified for each condition, with each dot in the dotted plot representing one image quantified. The group means were calculated and shown. Error bars represent ± SEM. Significance was assessed by one‐way ANOVA with Tukey's post hoc test, with **** representing P < 0.0001, N.S P > 0.05.
-
KHuman monocytes purified from venous blood draws from healthy adult male volunteers were treated with human cytokines toward a monocytic lineage (hMDM), dendritic lineage (hMDC), or microglia‐like lineage (hMicroglia). Cells were incubated with TRITC‐dextran for 30 min prior to washing, fixing, and staining with DAPI. Representative photomicrographs from 30 images analyzed for each condition from n = 3 biologically independent experiments are shown. Scale bars show 200 μm.
-
L–NRelative fluorescent signals were calculated as a percent of control‐ASO-treated cells. Thirty images across three independent experiments were quantified for each condition, with each dot in the plot representing one image quantified. The group means were calculated and shown. Error bars represent ± SEM. Significance was assessed by one‐way ANOVA with Tukey's post hoc test, with **** representing P < 0.0001.
Figure EV2. Rab10 expression is required for macropinocytosis in human and mouse phagocytic cells.
-
APrimary mouse bone marrow‐derived macrophage cells (BMDMs) from adult male C57BL/6J mice were differentiated to a monocytic lineage (mBMDM), dendritic lineage (mBMDC), or microglia‐like lineage (mMicroglia). Cells were treated with 1 μM control ASO or Rab10 ASO1 for four days before harvesting protein lysates. Representative immunoblots from total lysates from three biologically independent experiments are shown.
-
BRelative Rab10 levels were calculated as % of mBMDM cells treated with control ASO. Each dot represents one independent experiment. Significance was assessed by a two‐tailed t‐test for each cell type, with **** representing P < 0.0001. Error bars represent ± SEM.
-
CHuman monocytes purified from human venous blood from healthy adult males were differentiated to a monocytic lineage (hMDM), dendritic lineage (hMDC), or microglia‐like lineage (hMDMi). Cells were treated with 1 μM control ASO or Rab10 ASO1 for 4 days before harvesting protein lysate and immunoblotting. Representative immunoblots from three biologically independent experiments are shown.
-
DRelative Rab10 levels were calculated as % of hMDM cells treated with control ASO. Each dot represents one independent experiment. Significance was assessed by a two‐tailed t‐test for each cell type, with **** representing P < 0.0001. Error bars represent ± SEM.
-
ERaw264.7 cells and mBMDM cells derived from C57BL/6J mice were treated with Rab10 ASO2 for 4 days (in parallel with the experiments shown in Fig 1C and G), prior to incubation for 60 min with fluorescent (tetramethylrhodamine, TRITC)‐labeled dextran (70 kDa, shown as red signal). Representative photomicrographs (from 30 images analyzed across three experiments) are shown from cells extensively washed, fixed, and stained with DAPI (shown as blue signal). The same representative images for the control‐ASO- and EIPA‐treated cell conditions are shown as in Fig 1C and G for cross‐comparisons. Scale bars show 200 μm.
-
F, GRelative fluorescent signals were calculated as a percent of control‐ASO-treated cells. Thirty images of Rab10 ASO2 treated cells collected across three experiments (performed in parallel with Fig 1C and G) were analyzed, with each dot in the dotted plot representing one image quantified. The same plots of control‐ASO- and EIPA‐treated cells as in Fig 1D and H are shown for cross‐comparisons. The group means are given with error bars representing ± SEM. Significance was assessed by one‐way ANOVA with Tukey's post hoc test. **** represents P < 0.0001.
Rab10 regulates the early trafficking of macropinosome
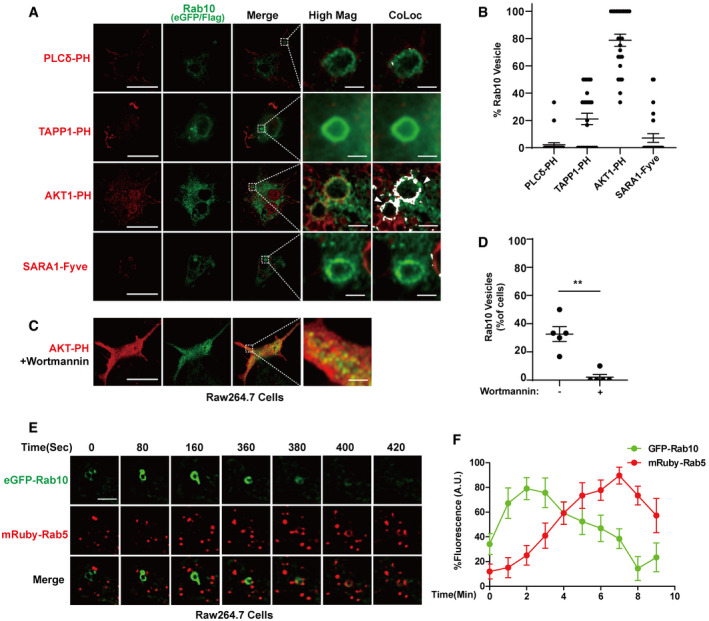
To pinpoint Rab10 initial entry into ruffled membranes, colocalization experiments with the PLCδ‐PH‐domain (PI(4,5)P2 marker) revealed initial exclusion of Rab10 from the beginning of circular cupping processes known to be regulated by ARF and Rac1‐GTPases (Fig 2A and B; Wong & Isberg, 2003). Only sparse Rab10 protein could be localized to dextran‐loaded SARA‐FYVE domain (PI3P marker) vesicles, known to be regulated in part by Rab21 and Rab5‐GTPases in endocytosis (Hu et al, 2002). In contrast, nearly all Rab10‐positive dextran‐loaded vesicles were labeled with the Akt‐PH domain, suggesting Rab10 is specifically and rapidly recruited to PIP3/PI(3,4,)P2 lipids on macropinosomes. A minority (~20%) of Rab10 vesicles near the plasma membrane localized with mRuby(N‐term)‐TAPP1‐PH domain (PI(3,4)P2marker, (Cosio & Grinstein, 2008; Goulden et al, 2019)). These results suggest Rab10 vesicles are predominantly recruited on PI(3,4,5)P3 but not PI(3,4)P2 ‐associated membrane structures. Consistent with PI(3,4,5)P3 dependent recruitment of Rab10, brief application of wortmannin, a phosphatidylinositol 3‐kinase inhibitor, completely ablated the ability of Rab10 to interact with vesicles (Fig 2C and D). In transfected Raw264.7 cells, live cell imaging experiments revealed lifetimes of total Rab10 vesicles of < 10 min, with a subset of macropinosomes dropping eGFP(N‐term)‐Rab10 expression in exchange for mRuby(N‐term)‐Rab5 within 8 min (Fig 2E and F). These results show that Rab10 is recruited to early (but not initial) stages of macropinocytosis, before Rab5 (an early endosome marker) is recruited.
Figure 2. Rab10 is recruited to early plasma membrane PIP3/PI(3,4)P2 macropinosomes.
-
ARaw 264.7 macrophage cells were transfected with FLAG(N‐term)‐Rab10 and eGFP(C‐term)‐Akt-PH domain (PI(3,4,5)P3 marker), or eGFP(C‐term)‐SARA-Fyve domain (PI3P marker), or eGFP(C‐term)‐PLC-PH domain (PI(4,5)P2 marker), or mkate2(N‐term)‐2xTAPP1‐PH domain (PI(3,4)P2 marker). Representative photomicrographs (from 25 images analyzed for each condition from n = 3 biologically independent experiments) are shown from fixed cells immunostained for FLAG‐tag (Rab10, shown as green) together with eGFP or mkate2 epifluorescence (shown as red). White bounding boxes show “High Mag” panels that magnify representative individual vesicles. The colocalization of Rab10 and indicated markers in the bounding boxes were analyzed using Image J as described in the method and shown in the “CoLoc” panels. The colocalized pixels are shown in white with the same intensity. Scale bars are 10 μm, or 1 μm in “Hig Mag” panels and “CoLoc” panels. White arrow heads indicate representative Rab10 vesicles positively colocalized with the indicated marker.
-
BAt least 25 cells across three independent experiments were analyzed for each condition (see Materials and Methods section). % of Rab10 vesicles positive with the indicated marker within each cell was quantified. Each dot represents the mean value from one cell analyzed. Group means are given, with error bars representing ± SEM.
-
CRaw 264.7 macrophage cells were transfected with FLAG(N‐term)‐Rab10 and eGFP(C‐term)‐Akt-PH domain (PI(3,4,5)P3 marker) and treated with wortmannin (1 μM) for 1 h. Representative photomicrographs (from 25 cells analyzed for each condition from n = 3 biologically independent experiments) are shown from fixed cells immunostained for FLAG‐tag (Rab10, shown as green) together with eGFP epifluorescence (shown as red). Scale bars are 10 μm, or 1 μm in “Hig Mag” panel.
-
DPercent of cells treated with or without wortmannin harboring Rab10 vesicles was calculated from > 30 cells across five independent experiments. Each dot on the plot represents mean values from one experiment. Error bars represent ± SEM and significance was assessed by Mann–Whitney test (owing to non‐normal distributions) with ** indicating P < 0.01.
-
ERaw 264.7 cells were co‐transfected with eGFP(N‐term)‐Rab10 and mRuby(N‐term)‐Rab5 for 48 h, with live cell recordings for ˜10 min. A representative vesicle is shown over the presented time‐lapse. Scale bar represents 1 μm.
-
FFluorescence intensities of individual vesicles are calculated over time. Dots show mean values calculated from n = 8 recorded vesicles from cells from n = 3 biologically independent experiments. Error bars show ± SEM.
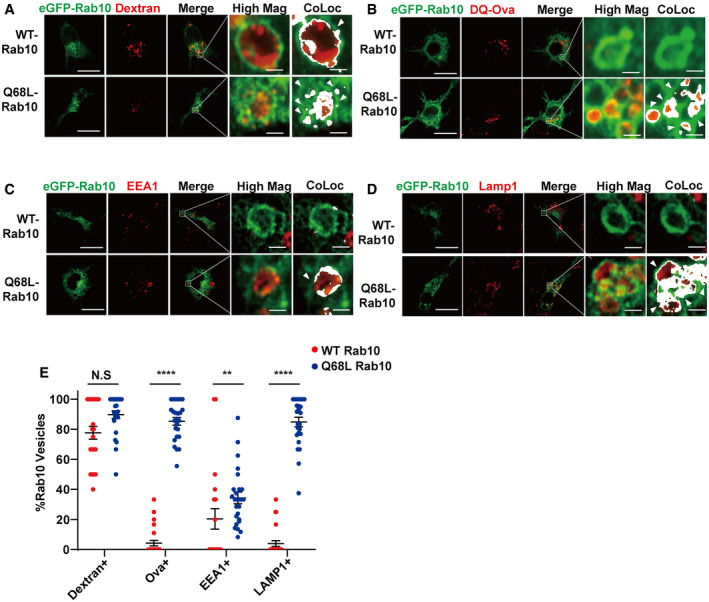
GTP hydrolysis activity of Rab GTPases can control localization. To study how GTP hydrolysis activity affects the localization and function of Rab10, macrophage cells were transfected with WT or GTP‐locked Rab10 (Q68L). Consistent with live cell imaging, WT‐Rab10 predominantly localized to dextran filled vesicles in the absence of EEA1 labeling (another early endosome marker) known to be the effector of Rab5 (Fig 3A, C and E). In contrast, macrophage cells transfected with Q68L‐Rab10 showed increased numbers of enlarged Rab10 positive macropinosomes, all filled with dextran but now stalled in the cytoplasm. These stalled Q68L‐Rab10 loaded macropinosomes were degradative vesicles, evidenced by BODIPY ovalbumin fluorescence with Lamp1 reactivity(Fig 3B, D and E). Noticeably, a subpopulation of WT Rab10 showed diffused pattern throughout the cytoplasm, potentially through interaction with GDP Dissociation Inhibitor GDI1/2 (Pfeffer et al, 1995; Steger et al, 2017). To further investigate how nucleotide binding could affect the subcellular localization of Rab10, we transfected the Raw264.7 cells with T23N mutant Rab10, which was previously shown to be deficient in binding guanosine nucleotides (Liu et al, 2018). Unlike WT and Q68L‐Rab10, T23N‐Rab10 failed to associate with vesicles (Fig EV3). These results show that GTP binding is required for the macropinosome localization of Rab10, while GTP hydrolysis activity is required for the dissociation of Rab10 from macropinosomes.
Figure 3. A GTP‐locking mutation in Rab10 stalls macropinosome recycling.
-
A–DRaw264.7 cells were transfected with plasmids expressing eGFP(N‐term)‐WT-Rab10 or Q68L‐Rab10 (GTP‐locked). 24‐h later, cells were incubated with (A) TRITC‐dextran (70 kDa, shown as red signal), or (B) DQ‐ovalbumin, for 30 min before washing and fixation. (C, D) Cells were further stained for (C) EEA1, or (D) Lamp1, which was detected with Cy5 dye (show as red signal). Representative photomicrographs are from 25 cells each analyzed for each condition from n = 3 biologically independent experiments. White bounding boxes are magnified in “High Mag” panels that show individual vesicles. Positive colocalization signal (see Materials and Methods) is indicated in bounding boxes labeled as “CoLoc”. Colocalized pixels are shown in white. Scale bars are 10 μm, or 1 μm in “Hig Mag” panels and “CoLoc” panels. White arrow heads indicate Rab10 vesicles colocalized with the indicated marker.
-
ETwenty five cells across three independent experiments were analyzed for each condition. % of Rab10 vesicles positive with the indicated marker in each cell were quantified. Each dot represents the mean results from vesicles analyze in one cell. The group means of % Rab10 vesicles positive with the marker are shown, with error bars representing ± SEM. Significance was assessed by Mann–Whitney test for each marker, where ** representing P < 0.01, ****P < 0.0001 and N.S P > 0.05.
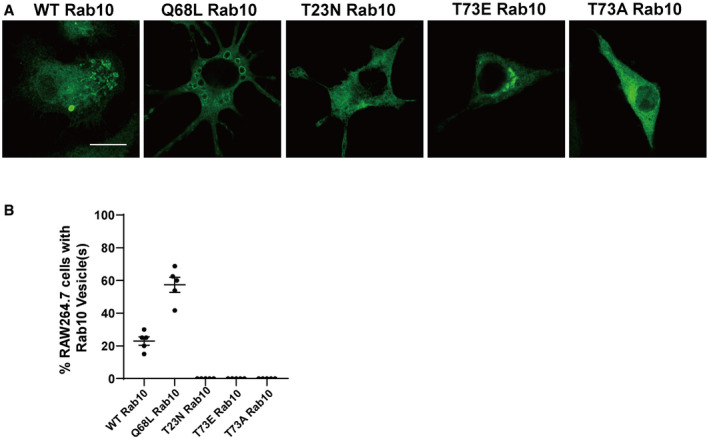
Figure EV3. WT‐ and Q68L‐Rab10, but not T23N‐, T73A‐, or T73E‐Rab10, can be recruited to vesicles.
-
ARaw 264.7 cells were transfected with eGFP(N‐term)‐Rab10 constructs, wild‐type, or harboring the following mutations: Q68L (GTP‐locked), T23N (inactive), T73E (phosphomimetic), or T73A (phospho‐null) mutants. Representative photomicrographs (from > 30 images analyzed for each condition from n = 5 biologically independent experiments) are shown. Scale bars indicate 20 μm.
-
BPercent of cells harboring Rab10 vesicles were calculated from > 30 cells across five independent experiments. Each dot represents one independent experiment. Error bars represent ± SEM.
LRRK2 phosphorylates Rab10 on early immature macropinosomes
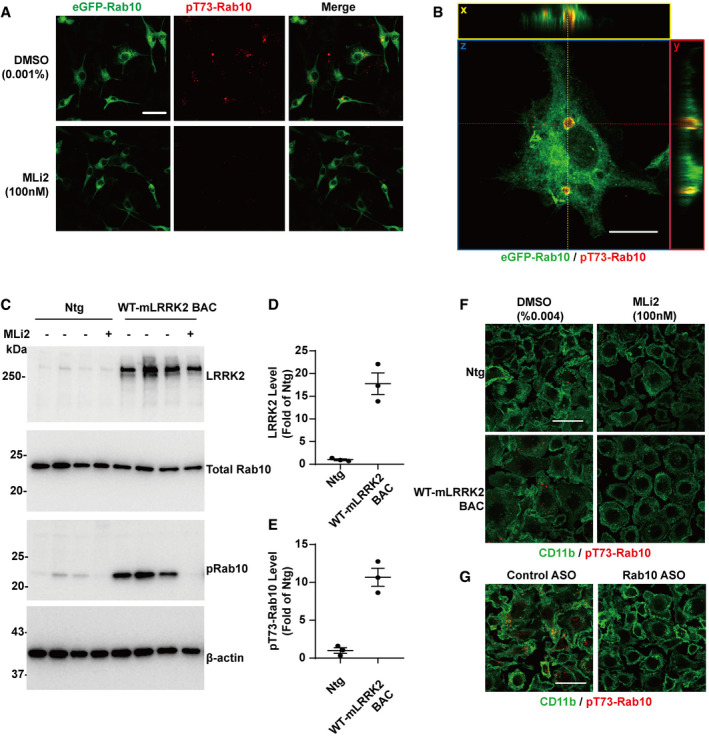
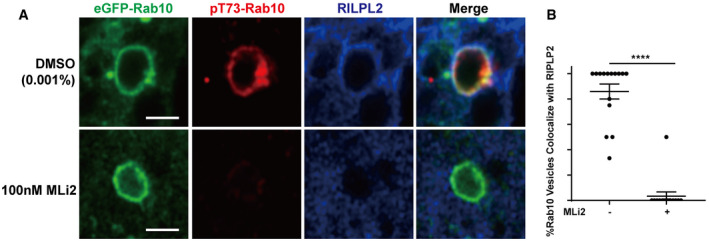
Our previous experiments, consistent with others (Steger et al, 2016, 2017; Liu et al, 2018), reveal that a proportion of membrane associated GTP‐bound Rab10 protein in transfected cell lines is phosphorylated by LRRK2 in the switch II loop at residue T73, exquisitely dependent on LRRK2 kinase activity in these cells. Also consistent with our previous results, immunofluorescence staining using a pT73‐Rab10 specific antibody confirmed that pT73‐Rab10 signal exclusively localized to vesicular structures, as opposed to total Rab10 signal that can be diffuse (cytoplasmic) and only partially localized to vesicles (Fig EV4). Treating the macrophage cells with Rab10 ASO efficiently decreased the pT73‐Rab10 immunofluorescence signal, suggesting that the pT73‐Rab10 signal on the vesicular structures indeed represent a subpopulation of total Rab10. Stacked images further confirmed that the pT73‐Rab10 positive vesicular‐like structures are closed vesicles, distinct from the plasma membrane. The LRRK2‐specific small molecule inhibitor MLi2 eliminated all pT73‐Rab10 signal from these cells, suggesting the phosphorylation of Rab10 is LRRK2‐dependent in macrophages.
Figure EV4. LRRK2 phosphorylates Rab10 on vesicular structures.
-
ARaw264.7 cells were transfected with eGFP(N‐term)‐WT Rab10 (show as green signal) and treated with 0.001% DMSO or 100 nM MLi2 (i.e., ˜IC90 concentration) for 2 h prior to fixation and immunostaining with pT73‐Rab10 antibody (shown as red signal). Representative photomicrographs (from > 20 images analyzed for each condition from n = 3 biologically independent experiments) are shown. Scale bars indicate 20 μm.
-
BRaw264.7 cells were transfected with eGFP(N‐term)‐Rab10 before fixation and analyzed with the pT73‐Rab10 antibody. Z‐stack images of Rab10 transfected cells were collected using Airyscan microscopy. Orthogonal views of representative images are shown. Red dashed line is the intersection of y,z and yellow dashed line is x,z. Blue box is the x,y plane, red box is the y,z plane, and yellow box is the x,z plane. Scale bar represents 10 μm.
-
CPrimary mouse bone marrow‐derived macrophage cells (BMDM) from adult male Ntg or WT‐mLRRK2 BAC transgenic mice were treated with DMSO or 100 nM MLi2 for 2 h. Representative immunoblots of cells derived from three different animals for each genotype are shown.
-
D, ERelative LRRK2 or pT73‐Rab10 levels were calculated as fold changes from Ntg cells (male C57BL/6J) treated with DMSO (0.004% to match DMSO levels with MLi2 treatment). Data are calculated from three independent replicates, with each dot in the column graph represents one independent experiment. Error bars represent ± SEM.
-
FPrimary mouse bone marrow‐derived macrophage cells (BMDM) from adult male Ntg or WT‐mLRRK2 BAC transgenic mice were treated with DMSO or 100 nM MLi2 for 2 h and analyzed with CD11b (shown in green) and pT73‐Rab10 (shown in red). Representative images from N > 10 images are shown. Scale bar represents 50 μm.
-
GPrimary mouse bone marrow‐derived macrophage cells (BMDM) from adult male WT‐mLRRK2 BAC transgenic mice were treated with 1 μM control ASO or Rab10 ASO for four days and analyzed with CD11b (shown in green) and pT73‐Rab10 (shown in red). Representative images from N > 10 images are shown. Scale bar represents 50 μm.
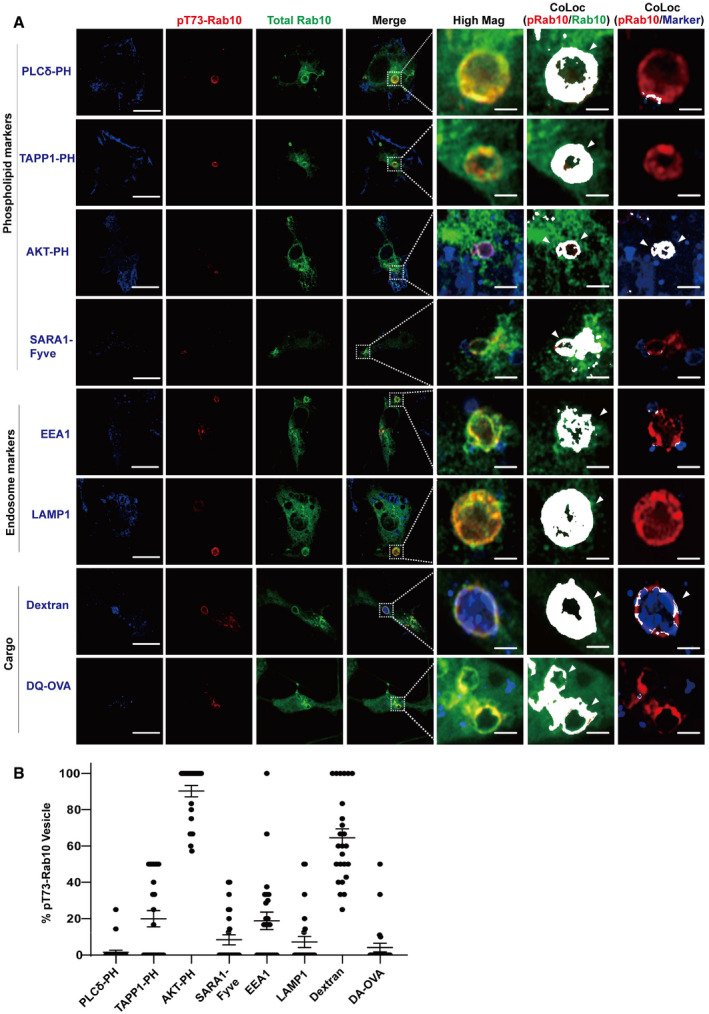
Recent studies suggest chloroquine‐damaged lysosomes may recruit LRRK2 to mediate Rab10 phosphorylation (Eguchi et al, 2018). However, our observed lack of colocalization between WT eGFP(N‐term)‐Rab10 with the lysosomal marker Lamp1 in phagocytic cells indicates that LRRK2 might natively phosphorylate Rab10 at a different stage in phagocytic cells. To pinpoint the specific step LRRK2 phosphorylates Rab10, Raw264.7 cells were co‐transfected with Flag(N‐term) tagged Rab10 with different phosphoinositide marker and co‐labeled with pT73‐Rab10 specific antibody. Similar to total Flag(N‐term) tagged Rab10, > 90% of pT73‐Rab10 vesicles colocalized with transfected eGFP(N‐term) tagged Akt‐PH‐domain PI(3,4,5)P3 marker, while no colocalization could be found between pT73‐Rab10 and the PLCδ‐PH domain (PI(4,5)P2 marker). Less than 90% of the pRab10 vesicles colocalized with total Rab10. Only 10% of pT73‐Rab10 vesicles colocalized with the SARA1‐Fyve‐domain (PI3P marker, Fig 4A and B) and 20% of pT73‐Rab10 vesicles colocalized with the TAPP1‐PH‐domain (PI(3,4)P2 marker). In contrast to a recent study showing Rab10 is predominantly phosphorylated on lysosomes (Eguchi et al, 2018), only ~5% of pT73‐Rab10 vesicles in these cells colocalized with the lysosomal marker Lamp1 (Fig 4A and B). As expected, the majority of pT73‐Rab vesicles were still filled with dextran, consistent with macropinosome origins for these vesicles. In cells incubated with soluble BODIPY‐conjugated ovalbumin, < 5% of pT73‐Rab10 vesicles were acidified, further suggesting these vesicles are non‐degradative (Fig 4A and B). Together, these data suggest LRRK2 phosphorylates Rab10 early on PI(3,4,5)P3 positive macropinosomes before the vesicle might merge or otherwise acquire other early and late endosome markers like EEA1 and Lamp1.
Figure 4. LRRK2 phosphorylates PI(3,4,5)P3‐positive Rab10 macropinosomes in macrophage cells.
-
ARaw 264.7 macrophage cells were transfected with Flag(N‐term)‐Rab10 and eGFP(C‐term)‐Akt-PH domain(PI(3,4,5)P3 marker), or eGFP(C‐term)‐SARA-Fyve domain((PI3P marker), or eGFP(C‐term)‐PLC-PH domain (PI(4,5)P2 marker, epifluorescence, shown in blue) followed by anti‐Flag immunofluorescence (shown in green) and pT73‐Rab10 antibody (shown in red). To evaluate colocalization of phospho‐Rab10 with early endosomes or late endosome/lysosome markers, immunofluorescence detection was performed for endogenous EEA1 or Lamp1 (shown in blue). Raw 264.7 macrophage cells were further fed 0.05 mg ml−1 of 70 kDa TRITC‐conjugated dextran (epifluorescence, shown in blue) or 0.05 mg ml−1 BODIPY‐conjugated ovalbumin for 30 min prior to immunofluorescence analysis. Representative images were selected from 25 cells analyzed for each condition from n = 3 biologically independent experiments. White bounding boxes are “High Mag” panels that show individual vesicles analyzed. Scale bars represent 10 and 1 μm for “High Mag”. Positive colocalization signal (depicted as white) in the “CoLoc (pRab10/Rab10)” and “CoLoc (pRab10/Marker)” columns are indicated. White arrow heads highlight vesicles scored as co‐positive between pT73‐Rab10 and Rab10 or the indicated marker.
-
BTwenty five cells across three independent experiments were analyzed for each condition, with each dot representing the mean of the vesicle analysis across individual cells. The group means of % pT73‐Rab10 vesicles positive for the indicated marker are given, with error bars showing ± SEM.
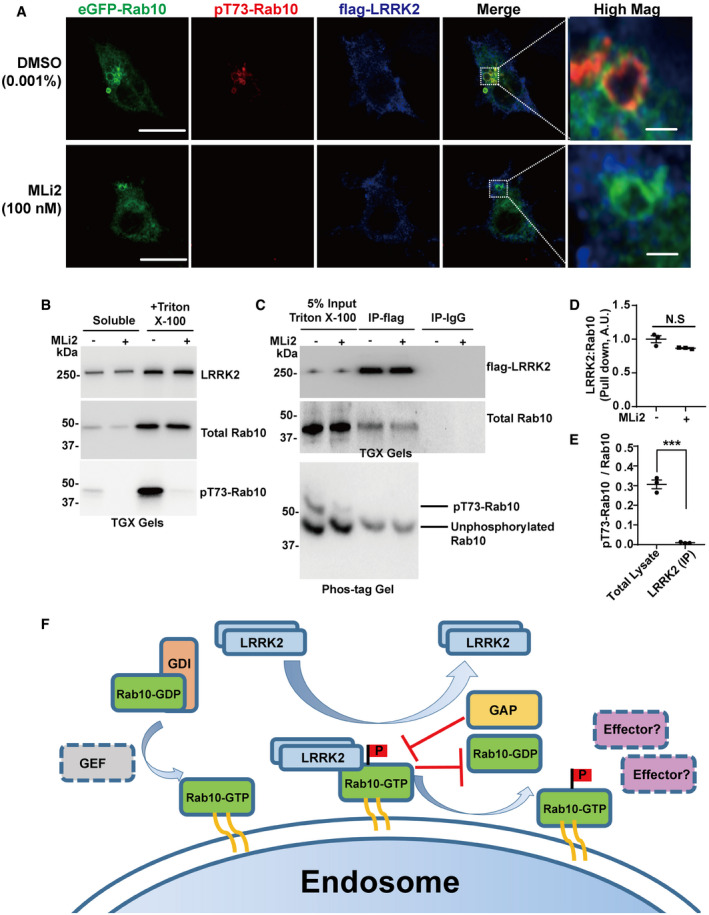
Recent studies suggest that the phosphorylation of Rab10 is dependent on stable membrane association of LRRK2 (Eguchi et al, 2018), consistent with earlier biochemical studies (Berger et al, 2010). Analysis of endogenous LRRK2 subcellular localization in macrophages shows a diffusive distribution through the cytoplasm in typical non‐stimulated cells in culture, with LRRK2 localization largely unaffected by kinase inhibition in these cells (Fig 5A). Endogenous LRRK2 protein in macrophages forms unorganized patches often adjacent to pT73‐Rab10‐positive vesicles (Figs 5A and EV1). Biochemical fractionation experiments revealed pT73‐Rab10 protein primarily localized to triton‐solubilized fractions, with LRRK2 binding to Rab10, as quantified through co‐immunoprecipitation, independent of LRRK2 kinase activity (Fig 5B and C). We next analyzed the stoichiometry of pT73‐Rab10 to total Rab10 protein in membrane‐enriched lysates using a phos‐tagging approach as previously described (Kinoshita et al, 2006; Steger et al, 2017; Liu et al, 2018). Although pT73‐Rab10 levels are dependent on LRRK2 kinase activity, pT73‐Rab10 protein poorly interacts with LRRK2 compared to non‐phospho Rab10 in the same triton‐solubilized membrane‐protein enriched fraction (Fig 5C–E). These results support a model where LRRK2 is recruited to GTP‐bound Rab10 complexes on endosomes, but dissociates from pT73‐Rab10 complexes (Fig 5F). The abundance of the LRRK2‐Rab10 complex thus depends on the proportion of kinase‐active LRRK2 protein.
Figure 5. LRRK2 transiently interacts with Rab10‐positive macropinosomes.
-
ARaw264.7 cells were transfected with Flag(N‐term)‐LRRK2 and eGFP(N‐term)‐Rab10 for 24 h and treated with or without the LRRK2 kinase inhibitor MLi2 (100 nM) for 2 h. Representative photomicrographs (from > 20 images analyzed for each condition from n = 3 biologically independent experiments) are shown from fixed cells with eGFP(N‐term)‐Rab10 epifluorescence (shown as green signal), and immunostained for pT73‐Rab10 (shown as red signal) and LRRK2 (shown as blue signal). White bounding boxes are magnified in “High Mag” panels that show individual vesicles. Scale bars represent 10 or 1 μm in “Hig Mag” panels.
-
BRaw 264.7 macrophage cells transfected with eGFP(N‐term)‐Rab10 and Flag(N‐term)‐LRRK2 were sequentially lysed mechanically into buffer to create a “soluble” protein fraction, and then insoluble material lysed into triton X‐100 buffer to create a “triton X‐100” fraction. The “soluble” and triton X‐100 buffer solubilized fractions were analyzed using SDS–PAGE (TGX gels), and representative immunoblots from n = 3 independent experiments are shown.
-
CThe “triton X‐100” fraction was used as input for LRRK2 immunoprecipitation, with subsequent detection of total Rab10 and pT73‐Rab10 proteins in LRRK2:Rab10 immunocomplexes using SDS–PAGE (TGX gels). To measure the stoichiometry of pT73‐Rab10 to total Rab10, the same immunocomplexes were analyzed using phos‐tag SDS–PAGE method, with unphosphorylated eGFP(N‐term)‐Rab10 migrating below the phospho‐Rab10 protein. Immunoblots are representative of three independent experiments, with similar results obtained.
-
DCalculated levels of total LRRK2:Rab10 protein complex with and without LRRK2 kinase inhibition. Data are from n = 3 biologically independent experiments with error bars showing ± SEM. Significance was assessed by a two‐tailed t‐test with N.S representing P > 0.05.
-
EThe signal intensities from pT73‐Rab10 and unphosphorylated Rab10 in the input lysate co‐immunoprecipitated with LRRK2 antibodies. The stoichiometry of pT73‐Rab10 was calculated by dividing the pT73‐Rab10 signal by total Rab10 signal (total Rab10 signal equivalent to pT73‐Rab10 signal+ unphosphorylated Rab10 signal). Data are from n = 3 biologically independent experiments with error bars showing ± SEM; Significance was assessed by two‐tailed t‐test with *** representing P < 0.0005.
-
FModel for LRRK2 interaction with Rab protein substrates. GDP‐bound Rab10 interacts with a GDI (Guanosine nucleotide dissociation inhibitor) and remain largely cytosolic. GEFs (guanine nucleotide exchange factors) facilitate the exchange of GDP for GTP to promote the endosome localization of Rab10. LRRK2 is temporarily recruited by GTP‐bound active Rab10 on endosomes and dissociates from Rab10 after phosphorylation occurs, thereby facilitating substrate turnover. LRRK2 interaction and phosphorylation may block the interaction of Rab10 GAPs (GTPase‐activating proteins) that would otherwise catalyze GTPase activity of Rab10 and promote Rab10 dissociation from endosomes (Liu et al, 2018). Without GAP interactions, Rab10 remains GTP‐bound and associated with endosomes. Therefore, LRRK2 might prolong the association of Rab10 on endosomes in a GTP‐bound form, but modified with phosphorylation that affects interactions with typical Rab10 effectors.
LRRK2 dependent phosphorylation stalls Rab10 on macropinosomes
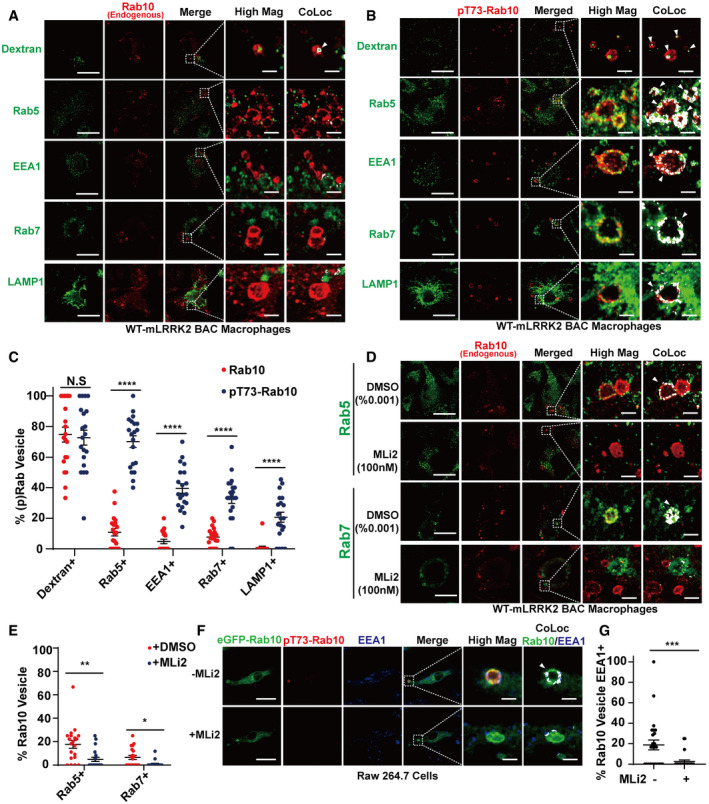
In native primary macrophages from mice, pT73‐Rab10 vesicles represent a proportion of Rab10 positive vesicles in the cytoplasm. To further understand the consequences of LRRK2 dependent phosphorylation of Rab10 on these vesicles, we cultured bone marrow‐derived macrophages from WT‐mLRRK2 BAC mice to increase LRRK2 expression and boost the level of pT73‐Rab10 and the numbers of pT73‐Rab10 positive vesicles (Fig EV4). In these cells, ~80% of pT73‐Rab10‐macropinosomes were positive for early endosomal markers (i.e., Rab5) in contrast to the total Rab10‐positive macropinosome pool (~20%, Fig 6). Similar to Rab5, only < 10% of total Rab10‐macropinosomes colocalized with EEA1, while 40% of pT73‐Rab10‐macropinosomes were positive for EEA1. Furthermore, subsets of pT73‐Rab10‐vesicles were positive for Rab7 or Lamp1 staining (~30% for Rab7 and 25% Lamp1), features rare in the total Rab10‐positive macropinosome pool (~10% for Rab7 and 5% for Lamp1 respectively, Fig 6A–C). We were unable to directly image or predict how phosphorylation affects the half‐life of Rab10 macropinosomes in living cells due to the technical inability to visualize phosphorylation. However, short bath‐application (~20 min) with the LRRK2 kinase inhibitor MLi2 completely ablated the pT73‐Rab10‐positive vesicle pool and decreased both Rab10 and Rab5, or Rab10 and Rab7, double‐positive vesicles to less than ~5% of the total Rab10 vesicle pool (Fig 6D and E). Similarly, in Raw264.7 cells transfected with eGFP(N‐term)‐Rab10, the LRRK2 kinase inhibitor MLi2 completely eliminated pT73‐Rab10 signals and reduced colocalization of eGFP(N‐term)‐Rab10 with the early endosomal marker EEA1 (Fig 6F and G). Our previous work in HEK‐293 cells transfected with LRRK2 and Rab10 suggested LRRK2 phosphorylation of Rab10 may prolong Rab10 in a GTP‐bound state by blocking Rab10‐GAP interactions that occur near the phosphorylation site of the switch II domain (Liu et al, 2018). Together, these results suggest that LRRK2 mediated phosphorylation stalls Rab10 on macropinosomes during vesicle maturation, partly mimicking GTP‐locked Rab10. As expected, only a small percentage of EEA1, Rab5, or Rab7 vesicles colocalized with Rab10 or pT73‐Rab10 vesicles. Overall, these observations are consistent with heterogenous early/late endosome pools with different origins and functions (Harrison et al, 2003; Jager et al, 2004; Lakadamyali et al, 2006; Dolat & Spiliotis, 2016).
Figure 6. LRRK2 dependent phosphorylation stalls Rab10 on macropinosomes.
-
A, BPrimary mouse bone marrow‐derived macrophage cells (BMDM) from adult male WT‐LRRK2 mBAC transgenic mice were pre‐incubated with FITC‐conjugated dextran (70 kDa, green signal) prior to washing, fixing, and immunostaining with total‐Rab10 (shown as red signal), or pT73‐Rab10 antibody (shown as red signal). Alternatively, cells were co‐stained with antibodies to Rab5, Rab7 or Lamp1 (shown as green signal in separate images). Representative photomicrographs (from > 30 images analyzed for each condition from n = 3 biologically independent experiments) are shown. White bounding boxes are “High Mag” panels that show individual vesicles analyzed. Positive colocalization signal (depicted as white) in “CoLoc” panels are given with white arrow heads highlighting vesicles scored as co‐positive between pT73‐Rab10 and the indicated marker. Scale bars are 10 μm, or 1 μm in “Hig Mag” panels and “CoLoc” panels.
-
CAnalysis of 20 cells across three independent experiments are given for each indicated colocalization, where % of Rab10 or pT73‐Rab10 vesicles positive with indicated markers was calculated for each cell (with signal inside of vesicles analyzed for TRITC‐dextran and DQ‐ovalbumin). Each dot represents the mean value of vesicles analyzed inside one cell. The group means of % Rab10 or pT73‐Rab10 vesicles positive with indicated markers were calculated. Error bars represent ± SEM. Significance was assessed by Mann–Whitney tests for each marker with **** representing P < 0.0001 and N.S representing P > 0.05.
-
DPrimary mouse bone marrow‐derived macrophage cells (BMDM) from adult male WT‐LRRK2 mBAC transgenic mice were treated with 0.001% DMSO or 100 nM MLi2 (i.e., IC90 concentration) for 2 h prior to immunostaining with total Rab10 or pT73‐Rab10 antibody (shown as red signal), and anti‐Rab5 or anti‐Rab7 antibody (shown as green signal). Representative photomicrographs (from 20 cells analyzed for each condition from n = 3 biologically independent experiments) are shown. White bounding boxes are “High Mag” panels that show individual vesicles analyzed. Scale bars represent 10 and 1 μm for “High Mag”. Positive colocalization signal (depicted as white) in “CoLoc” panels are given with white arrow heads highlighting vesicles scored as co‐positive between pT73‐Rab10 and the indicated marker.
-
ECalculated percentage of double‐positive vesicles (with > 50% of the vesicle boundary demarcated by white signal in the colocalization analysis) from 20 cells counted from n = 3 biologically independent experiments are shown. Each dot represents one cell in the dotted plot. The group means of % Rab10 or pT73‐Rab10 vesicles positive with indicated markers were calculated and shown. Error bars represent ± SEM. Significance was assessed by Mann–Whitney test for each marker with * representing P < 0.05, **P < 0.01.
-
FRaw 264.7 macrophage cells were transfected with eGFP(N‐term)‐Rab10 for 24 h and treated with or without the LRRK2 kinase inhibitor MLi2 (100 nM) for 2 h. Representative photomicrographs (from 25 images analyzed for each condition across n = 3 biologically independent experiments) are shown with eGFP(N‐term)‐Rab10 epifluorescence (shown as green signal) and pT73‐Rab10 (shown as red signal), with EEA1 (shown as blue signal). White bounding boxes are “High Mag” panels that show individual vesicles analyzed. Scale bars represent 10 and 1 μm for “High Mag”. Positive colocalization signal (depicted as white) in “CoLoc” panels are given with white arrow heads highlighting vesicles scored as co‐positive between pT73‐Rab10 Rab10 and the indicated marker.
-
GCalculated percentage of colocalized vesicles, with each dot representing mean vesicle frequency in each cell analyzed. The group mean of % Rab10 vesicles positive with EEA1 were calculated, and error bars represent ± SEM. Significance was assessed by Mann–Whitney test for each marker with *** representing P < 0.005.
In an attempt to further understand how LRRK2‐dependent Rab10 phosphorylation alters macropinosome recycling machinery, we generated the phosphomimetic mutation T73E‐Rab10 and non‐phosphorylatable mutation T73A‐Rab10. However, neither T73E‐Rab10 or T73A‐Rab10 could associate with any vesicles (Fig EV3). Rather, these mutations shunted the proteins to aberrant perinuclear accumulations, with the T73A‐Rab10 variant slightly more diffused in the cytosol. As mutation of the LRRK2 phosphorylation residue is unlikely to affect Rab10 GTP binding or activity, based on ours and others experiments in other cell lines, the observations here reveal the essential nature of the threonine‐73 amino acid in Rab10 in mediating interactions with vesicles in macrophages.
LRRK2 mediated phosphorylation Rab10 inhibits EHBP1L1‐dependent fast recycling of macropinosomes
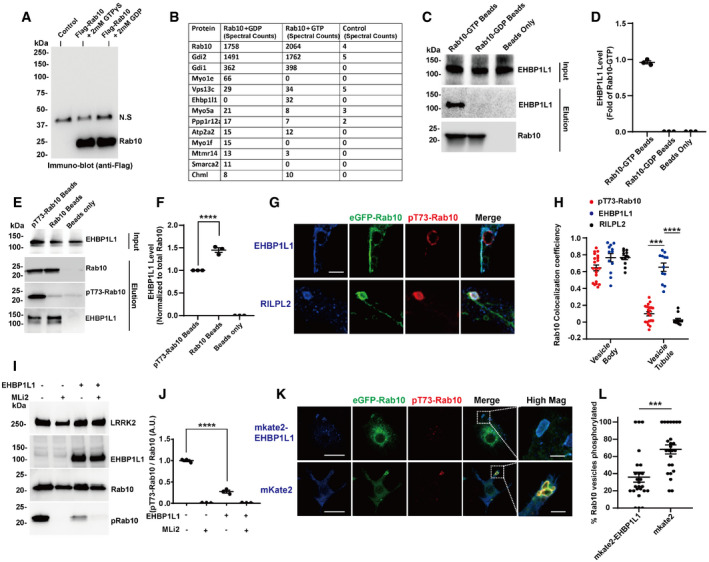
To help identify protein co‐factors that may be responsible for blocking pT73‐Rab10 vesicle recycling, we used a proteomics approach with GTP (vesicle‐bound) or GDP (cytosolic)‐swapped immunoprecipitated Rab10 protein combined with lysates from macrophages (Fig 7A). This approach capitalizes on our evidence that LRRK2 preferentially phosphorylates Rab10 in its GTP‐bound form (Liu et al, 2018). We identified only one Rab10 protein interactor exclusive to GTP‐bound Rab10 that was not present in GDP‐Rab10 pull‐downs, the EH domain‐binding protein 1‐like protein 1 (EHBP1L1, Fig 7B–D). Consistent with previous literature, pull‐down analysis from Raw 264.7 cells transfected with Myc‐mKate2(N‐term)‐EHBP1L1 confirmed the interaction of EHBP1L1 with GTP bound, but not GDP‐bound, Rab10 (Fig 7C). Pull‐down analysis with triton‐solubilized and immobilized pT73‐Rab10 and non‐phospho‐Rab10 bound to beads demonstrated pT73‐Rab10 weakly interacts with EHBP1L1 compared to non‐phospho‐Rab10 (Fig 7E and F). EHBP1L1 is well known to interact with GTP‐bound Rab10 to regulate the formation of tubular recycling endosomes in HeLa cells (Nakajo et al, 2016; Rai et al, 2016). In macrophage cells transfected with eGFP(N‐term)‐Rab10 and Myc‐mKate2(N‐term)‐EHBP1L1, Myc‐mKate2(N‐term)‐EHBP1L1 prominently colocalized with Rab10 on recycling tubules. Noticeably, expression of Q68L‐Rab10 (GTP‐locked) inhibited any tubular vesicles that instead showed enlargement and accumulation in the cytosol although EHBP1L1 can be efficiently recruited by Q68L‐Rab10 (Appendix Fig S1), suggesting other effectors of EHBP1L1 such as Bin1 and F‐actin might further regulate the formation of tubular vesicles. RILPL2, identified as a pT73‐Rab10 specific adaptor that cannot bind non‐phospho Rab10 (Steger et al, 2017), localized exclusively on the body of the Rab10 positive macropinosomes and not on recycling tubules (Fig 7G and H). pT73‐Rab10‐vesicles, enriched with RILPL2 (Fig EV5), failed to form recycling tubules that are characteristic of short‐lived macropinosomes (Jones, 2007; Buckley et al, 2016; Toh et al, 2019), consistent with pT73‐Rab10 demarcating macropinosomes that are stalled in the cytoplasm. Overexpression of EHBP1L1 blocked LRRK2‐phosphorylation of Rab10, presumably through competitive access to the critical threonine‐73 residue that controls vesicle localization, and therefore mimicking the effects of LRRK2 kinase inhibition (Fig 7I and J). In macrophages transfected with eGFP(N‐term)‐Rab10 and Myc‐mKate2(N‐term)‐EHBP1L1, the percent of eGFP(N‐term)‐Rab10 vesicles positive with pT73‐Rab10 was significantly decreased compared to cells co‐transfected with eGFP(N‐term)‐Rab10 and Myc‐mKate2 only (Fig 7K and L). These results favor a model whereby LRRK2 kinase activity and Rab10‐phosphorylation directly compete with EHBP1L1 for complex occupancy that dictates vesicle maturation or fast recycling, respectively.
Figure 7. LRRK2 phosphorylation of Rab10 inhibits vesicle recycling by blocking EHBPL1 binding.
-
ARaw264.7 cells were transfected with Flag‐Rab10 or control empty vector. The transfected cells were lysed in the presence of 2 mM GTPγS or 2 mM GDP. The Flag‐Rab10 complex was immunoprecipitated with Flag‐resin followed by extensive washing and elution of complexes with 200 μg ml−1 3xFlag‐tide. Eluates were analyzed by SDS–PAGE followed by immunoblotting with anti‐Flag-HRP antibody.
-
BPurified complexes were digested with trypsin and peptides identified with an Orbitrap mass analyzer. A representative table of peptides matching proteins with spectral counts > 10 from either the GTPγS or GDP incubations, and < 5 spectral counts in the control elution.
-
CFlag(N‐term)‐Rab10 protein was purified from HEK293‐FT cells transfected with Flag(N‐term)‐Rab10 plasmids and immobilized on Flag‐resin in lysis buffer containing 2 mM GTPγS, or 2 mM GDP, as indicated. Beads were mixed with lysates from cells transfected with Myc‐mkate2(N‐term)‐EHBP1L1 to generate Rab10:EHBP1L1 complexes. Total Rab10 on the beads was detected using anti‐Flag antibody, and EHBP1L1 immobilized to total Rab10 detected with an anti‐Myc antibody. Representative immunoblots from n = 3 biologically independent experiments are shown.
-
DQuantification of relative EHBP1L1 pulled down. Data are from n = 3 biologically independent experiments. Error bars represent ± SEM.
-
EHEK293‐FT cells were transfected with Flag(N‐term)‐Rab10 and Myc(N‐term)‐LRRK2R1441C to induce Rab10 phosphorylation. Membrane bound Flag(N‐term)‐Rab10 protein was extracted with Flag‐resin to generate “pRab10 beads”, or extracted from cells treated with MLi2 (100 nM) to generate “Rab10 beads”. Beads were mixed with lysates from HEK293‐FT cells transfected with Myc‐mkate2(N‐term)‐EHBP1L1 to form on‐bead Rab10:EHBP1L1 complexes. The total Rab10 and pT73‐Rab10 on the beads was detected using anti‐Flag antibody and pT73‐Rab10 antibody. The EHBP1L1 in the lysates and immobilized on the beads was detected using anti‐Myc tag antibody. Representative immunoblots are shown.
-
FThe relative EHBP1L1 pulled down, normalized to total Rab10 protein on‐bead, was determined from n = 3 biologically independent experiments. Error bars represent ± SEM. Each dot represents one experiment, with significance assessed by one‐way ANOVA with **** representing Tukey's post hoc test P < 0.0001.
-
GRaw 264.7 cells were co‐transfected with eGFP(N‐term)‐Rab10 (epifluorescence shown in green) and Myc‐mkate2(N‐term)‐EHBP1L1 (epifluorescence shown in blue), or Flag(C‐term)‐RILPL2 (anti‐Flag signal shown in blue). Cells were stained for pT73‐Rab10 (shown in red). Representative photomicrographs of individual vesicles (from > 10 cells analyzed for each condition from n = 3 biologically independent experiments) are shown. Scale bar represents 1 μm.
-
HPearson's colocalization coefficient for Rab10 and pT73‐Rab10, EHBP1L1 and RILPL2 on vesicle bodies and tubular vesicles. Data are from n = 20 vesicles with tubular structures positive for pT73‐Rab10, and n = 12 vesicles with tubular structures positive for EHBP1L1, or RILPL2, calculated from cells from three independent experiments. Each dot represents one vesicle body or tubular structure, with significance assessed by Kruskal–Wallis test followed by Dunn's multiple comparison test with *** representing P < 0.0005 and **** P < 0.0001. Error bars represent ± SEM.
-
IRaw264.7 cells were co‐transfected with Flag(N‐term)‐Rab10, Flag(N‐term)‐LRRK2R1441C, and Myc(N‐term)‐EHBP1L1, with representative immunoblots shown.
-
JRelative pT73‐Rab10 levels were calculated as fold of cells transfected with Flag(N‐term)‐Rab10 and Flag(N‐term)‐LRRK2 only. Data are from n = 3 biologically independent experiments. Each dot represents one independent experiment. Significance was assessed by one‐way ANOVA with **** representing Tukey's post hoc test P < 0.0001. Error bars represent ± SEM.
-
KRaw264.7 cells were co‐transfected with eGFP(N‐term)‐Rab10 (epifluorescence, shown in green) and Myc‐mkate2(N‐term)‐EHBP1L1 or Myc‐mkate2 control plasmid (epifluorescence, shown in red). Representative photomicrographs are shown. Bounding boxes highlight vesicles in “High Mag” panels. Scale bars represent 10, and 1 μm for “High Mag” images.
-
L% of eGFP(N‐term)‐Rab10 vesicles positive with pT73‐Rab10 were calculated (from 25 cells analyzed for each condition from n = 3 biologically independent experiments). Each dot represents the mean frequency observed in one cell. Error bars show ± SEM with significance assessed by Mann–Whitney test. *** represents P < 0.0005.
Figure EV5. LRRK2 kinase activity is required for RILPL2‐binding to Rab10 vesicles.
-
ARaw 264.7 cells were co‐transfected with eGFP(N‐term)‐Rab10 and Flag(C‐term)‐RILPL2. Cells were immunostained with anti‐Flag antibody for RILPL2 (shown in blue), and anti‐pThr73 for pT73‐Rab10 (shown in red). Representative photomicrographs (from 15 images analyzed for each condition across n = 3 biologically independent experiments) are shown. Scale bar represents 1 μm.
-
BCalculated percentage of eGFP(N‐term)‐Rab10 and Flag(C‐term)‐RILPL2 double‐positive vesicles, with or without MLi2 treatment, from 15 cells analyzed for each condition across n = 3 biologically independent experiments. Each dot represents the mean analysis of a single cell. Error bars represent ± SEM. Significance was assessed by Mann–Whitney test, with **** representing P < 0.0001.
LRRK2 and Rab10 potentiate CCL5‐stimulated Akt signaling and macrophage chemotaxis
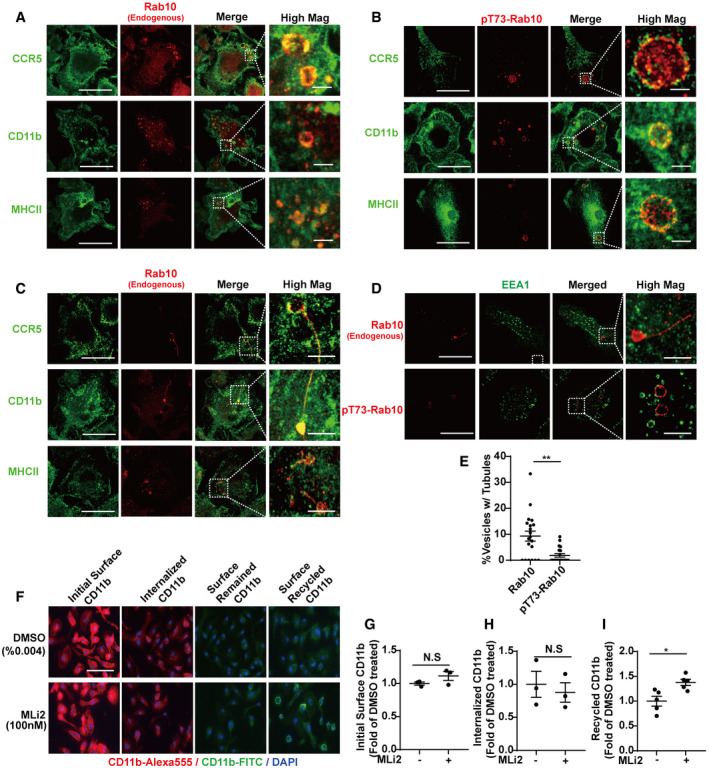
Macropinocytosis is a process hypothesized as critical for some immunological responses in phagocytes (Canton, 2018). Rab10 knockdown has been previously shown to regulate TLR4 trafficking to affect LPS‐stimulated pro‐inflammatory signaling (Wang et al, 2010). However, in primary mouse bone marrow‐derived macrophages, neither our Rab10 knockdown constructs nor LRRK2 inhibitor treatment that ablates pT73‐Rab10 altered LPS‐stimulated TLR4‐Myd88‐dependent phosphorylation of p38 or LPS‐induced phosphorylation of Akt (Appendix Fig S2). Previous studies have shown that surface receptors such as G protein‐coupled receptors (GPCRs), integrins, and major histocompatibility complex (MHC) molecules, can be internalized through macropinocytosis in phagocytes (Sallusto et al, 1995; Scarselli & Donaldson, 2009; Gu et al, 2011). Indeed, subcellular staining in mouse bone marrow‐derived macrophages revealed nearly all Rab10 and pT73‐Rab10 vesicles were loaded with CCR5 (GPCR), CD11b(integrin) and MHC II (Fig 8A and B). A subset of Rab10 vesicles were tubulated, with CCR5, CD11b or MHC II colocalizing with Rab10 on the tubular structures pointing toward the surface of the cells (Fig 8C). Consistent with results in transfected cells, pT73‐Rab10 localized to vesicle bodies but not on the tubular structures in primary macrophages (Fig 8D and E). Blocking LRRK2 kinase activity in primary macrophages promoted the fast recycling of CD11b (Fig 8F–I). These data further support a model whereby LRRK2‐mediated Rab10 phosphorylation inhibits the fast recycling of macropinosome membrane. In contrast, we did not observe differences caused by LRRK2 inhibition in overall bulk fluid uptake via measures of dextran or ovalbumin uptake or degradation (Appendix Fig S3). These results together showed that LRRK2 dependent phosphorylation of Rab10 does not directly regulate fluid cargo uptake but affects the trafficking of some membranes endocytosed through macropinocytosis.
Figure 8. LRRK2 inhibits the fast recycling of receptors internalized through macropinocytosis.
-
A–DPrimary mouse bone marrow‐derived macrophage cells (BMDM) from adult male WT‐mLRRK2 BAC transgenic mice were immunostained with anti‐mouse CCR5, or CD11b, or MHC II antibody (shown as green signal) and (A) total Rab10 antibody (red signal), or (B) pT73‐Rab10 antibody (red signal) as indicated. Representative photomicrographs (from > 20 images analyzed for each condition from n = 3 biologically independent experiments) are shown. (C) Photomicrographs showing the different cargo with respect to Rab10 tubular structures. (D) EEA1 (shown as green signal) with total Rab10 or pT73‐Rab10 (shown as red signals) as indicated. Bounding boxes in panels A‐D are magnified in “High Mag” panels that show individual vesicles. Scale bars represent 10 and 2 μm for “High Mag” images.
-
ECalculated percentage of vesicles positive with tubular structures (n > 30 vesicles analyzed from cells from n = 3 biologically independent experiments) are shown. Each dot represents one vesicle, with significance assessed by Mann–Whitney test. ** represents P < 0.01. Error bars represent ± SEM.
-
FBMDM cells were treated with 0.004% DMSO or 100 nM MLi2 prior to live cell surface staining with Alexa‐594 conjugated rat anti‐mouse CD11b antibody on ice for 10 min. Three wells of cells from each condition were fixed and imaged for initial surface CD11b binding (shown in red as indicated). Six wells of cells from each condition were further incubated at 37°C to allow rapid internalization of CD11b‐antibody complexes for 10 min prior to striping of surface CD11b antibody using 0.5% acetic acid on ice for one min. Three of the six wells were fixed and surface‐stained with Alexa‐488 conjugated goat anti‐rat antibody to show CD11b‐antibody complexes remaining on the cell surface (shown in green as indicated). Internalized CD11b‐antibody complexes are shown in red. The other three wells of cells were further incubated at 37°C again for ten min to allow recycling of internalized CD11b‐antibody complex followed by surface staining with Alexa‐488 conjugated goat anti‐rat antibody to show CD11b‐antibody complexes recycled back to the surface. Representative images from n = 3 biologically independent experiments are shown. Scale bars represent 30 μm.
-
G–I(G) The initial surface CD11b, or (H) internalized CD11b, or (I) recycled CD11b were calculated from > 20 images analyzed for each condition from n = 3 biologically independent experiments. Each dot represents the mean value from one experiment. Error bars show ± SEM with significance assessed by Mann–Whitney test. * represents P < 0.05.
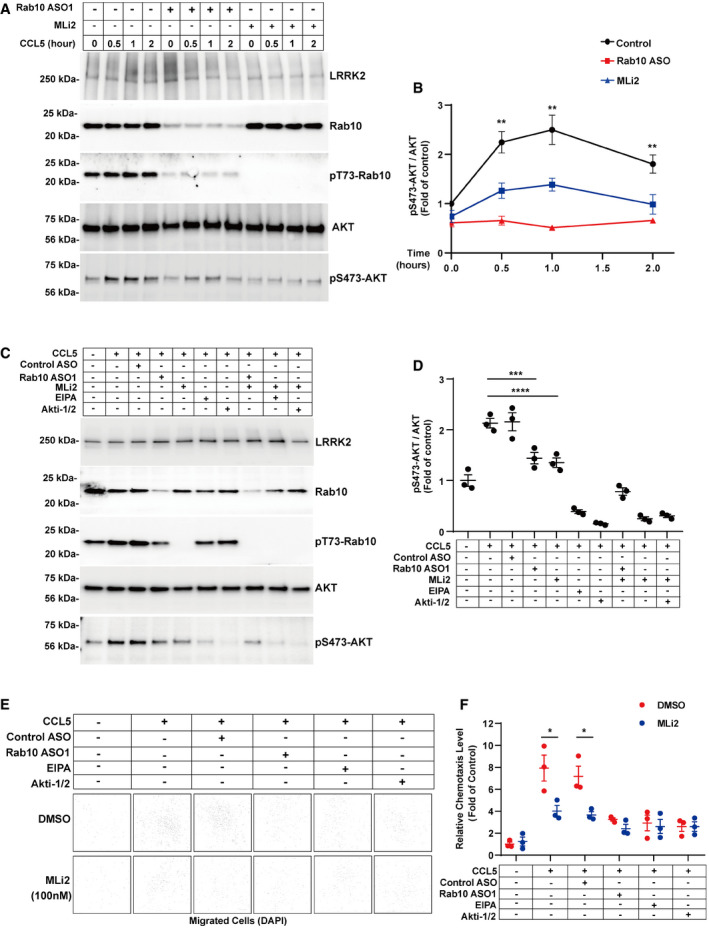
Recent studies suggest that mature macropinosomes, enriched with PI(3,4,5)P3, can serve as critical signaling platforms used by GPCRs to induce Akt phosphorylation and subsequent signal transduction (Erami et al, 2017; Pacitto et al, 2017). Consistent with those studies, knocking down Rab10 or blocking pT73‐Rab10 vesicles with LRRK2 kinase inhibition potently decreased CCL5‐induction of Akt phosphorylation (Fig 9A and B). In contrast, treating the cells with control oligonucleotides did not affect Akt phosphorylation induced by CCL5 (Fig 9C and D). In line with the role of macropinocytosis in CCL5 induced Akt signaling, treating the macrophage cells with the macropinocytosis inhibitor EIPA ablated Akt phosphorylation, comparable to inhibition achieved with the direct Akt inhibitor Akti‐1/2.
Figure 9. LRRK2 phosphorylation of Rab10 promotes CCL5‐induced Akt activation and chemotaxis.
-
APrimary mouse bone marrow‐derived macrophage cells (BMDM) from adult male WT‐mLRRK2 BAC transgenic mice were treated with DMSO, 1 μM Rab10 antisense oligonucleotide for 4 days, 100 nM MLi2 for 12 h, as indicated, before stimulation with 100 nM CCL5 for the indicated time (hours). Representative immunoblots from n = 3 biologically independent experiments are shown.
-
BRelative pSer473‐Akt levels were normalized to total Akt and calculated as fold of naïve cells (without CCL5 stimulation). Data shown are group means ± SEM from n = 3 biologically independent replicates, with significance assessed by one‐way ANOVA with Tukey's post hoc test with treated groups compared to matched control groups, with ** representing P < 0.01.
-
CBMDM cells, as described in panel (A), were additionally treated with DMSO (control), EIPA, or Akti‐1/2 (Akt1/2 inhibitor) as indicated, for 1 h after CCL5 stimulation. Representative immunoblots from n = 3 biologically independent experiments are shown.
-
DRelative pSer473‐Akt levels were normalized to total Akt and calculated as fold of naïve cells (without CCL5 stimulation). Each dot represents one experiment, with error bars showing ± SEM. Significance was assessed by one‐way ANOVA with Tukey's post hoc test, with *** representing P < 0.0005, ****P < 0.0001.
-
EBMDM cells, as described in panels (A and C), were seeded in Transwell (Sigma) chemotaxis assays using CCL5 as a chemoattractant in bottom chambers. After 2 h, the cells failing to migrate through the matrices were removed with a cotton swab. Migrated cells were counted with DAPI images, with representative images shown at low magnification. Representative images from n = 3 biologically independent experiments are shown.
-
FRelative chemotaxis activity was calculated as fold of naïve cells that migrated without any added CCL5. Each dot represents the mean of images collected from one experiment. Data are group means ± SEM, with significance assessed by multiple t‐test., with* representing P < 0.05.
LRRK2 kinase activity promotes macrophage chemotaxis both in vivo and in vitro, whereas LRRK2 inhibition attenuates chemotaxis (Moehle et al, 2015; Shutinoski et al, 2019). To test whether LRRK2 dependent increases in chemotaxis responses are caused by phosphorylation of Rab10 on macropinosomes, primary mouse macrophages were treated with or without the LRRK2 kinase inhibitor MLi2 in combination with Rab10 knockdown, EIPA, or Akti‐1/2, prior to stimulation with CCL5 in transwell chemotaxis assays. Macrophage cells with Rab10 expression knockdown, or LRRK2 kinase inhibition, caused a migration failure across a transwell based CCL5‐chemotaxis assay (Fig 9E and F). Together, these data suggest that LRRK2‐mediated Rab10 phosphorylation on macropinosomes potentiates CCL5 induced chemotaxis responses by promoting Akt activation. Consistent with these results, EIPA or Akti‐1/2 treatment also significantly inhibited CCL5‐induced chemotaxis, further supporting our hypothesis that LRRK2 dependent phosphorylation of Rab10 might regulate chemotaxis through macropinosome dependent Akt activation (Fig 10).
Figure 10. Model of Rab10 and LRRK2 interaction in the maturation of macropinosome‐derived vesicles.
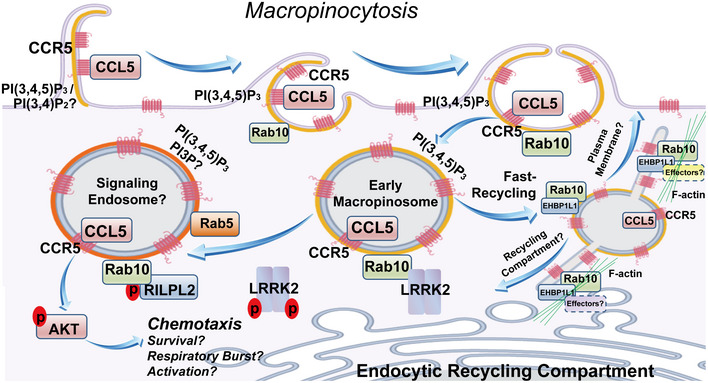
In our hypothetical model, Rab10 is initially recruited to PI(3,4)P2 /PI(3,4,5)P3 positive membrane ruffles at the early stage of macropinosome formation. The factors that underlie Rab10‐patched recruitment to these initial membranes are not known. During the process of full ruffle closure, PI(3,4,5)P3 is concentrated on macropinosomes, with Rab10 now recruited at much higher levels to facilitate early trafficking of macropinosomes. Now distinct from the plasma membrane, without LRRK2 phosphorylation, Rab10 binds EHBP1L1 to facilitate the formation of tubular endosomes which mediate fast recycling of surface receptors. Our antibody staining demonstrates that virtually all macropinosomes (defined by 70 kDa dextran positivity) in the cells studied here included the GPCR CCR5 and integrins (CD11b). The fate of recycling tubular endosomes is likely dictated by EHBP1L1 effectors and the local microcytoskeleton network. On the other hand, if LRRK2 phosphorylation of Rab10 occurs on Thr73, EHBP1L1 interaction is weakened and instead RILPL2 interaction is promoted. The net effect may be to inhibit EHBP1L1‐mediated fast recycling of CCR5 to retain an endosome‐localized activated receptor complex. In vesicle maturation, the former macropinosomes assume early and then late endosome markers. These endosomes, if loaded with CCL5‐bound CCR5, appear to potently activate Akt signaling pathways using these PI(3,4,5)P3 enriched vesicles as a platform. Through this signaling axis, critical pathways that mediate chemotaxis, as well as other possible pathways not studied here including cell survival in tissues and respiratory bursts, may be promoted (through LRRK2 phosphorylation of Rab10).
Discussion
Phagocytic cells (e.g., macrophages) constantly survey extracellular fluid through macropinocytosis. Early studies demonstrated ~30% of cell volume can be internalized every hour through this process, with the majority of endocytosed membrane returned to the cell surface within minutes (Steinman et al, 1976, 1983; Besterman & Low, 1983). Mechanistic insights into macropinocytosis, a process difficult to discern from phagocytosis in practice, have been considered largely through studies of viral‐entry into host cells and small molecule inhibitors (Sarkar et al, 2005). Using newly developed monoclonal antibodies to Rab10 together with live cell imaging approaches, we initially observed Rab10 localization characteristics and dynamics that suggested possible novel function in macropinocytosis. Our observations in this study identify Rab10 as one of the first proteins with high specificity for the control and maintenance of macropinocytosis, with LRRK2 interacting in this pathway through novel phosphorylation that fundamentally alters Rab10 function.
In the construction of a new model for macropinocytosis in phagocytic cells (Fig 10), Rab10 is initially recruited prior to full plasma membrane budding. Knockdown of Rab10 in a variety of phagocytic cells with constitutive macropinocytosis, including both human and mouse primary cells, resulted in profoundly impaired macropinocytosis without perturbation of phagocytosis or clathrin‐dependent endocytosis of transferrin. Macrophage maturation, polarization, or pro‐inflammatory responses to TLR4 activation likewise did not appear affected by Rab10 knockdown. Our results are difficult to reconcile with a past publication implicating Rab10 function more broadly in phagocytosis (Cardoso et al, 2010). In our study, we were able to achieve robust Rab10 knockdown without viral‐vector treatment of the immune cells, with validated knockdown of Rab10 that did not affect the expression of closely related Rab proteins like Rab8a. Our data would suggest that macrophage polarization or function was largely unimpaired through Rab10 knockdown in measures of responses to pro‐inflammatory stimuli like LPS. However, in consideration of past reports, we acknowledge that other Rab proteins may eventually compensate for the loss of Rab10 with probable broader effects on endocytosis and vesicle traffic (Schuck et al, 2007).
Several recently published reports have localized Rab10 recruitment to late endolysosomes (Eguchi et al, 2018; Lee et al, 2020). In contrast to these studies, we localized Rab10 recruitment on early macropinosomes loaded with soluble dextran in macrophage cells. Unfortunately, we were not able to resolve the exact timing of LRRK2 dependent phosphorylation of Rab10 in macropinocytosis. Macropinosomes are short‐lived vesicles that undergo fast maturation or recycling (Jones, 2007; Buckley et al, 2016; Toh et al, 2019). Our attempts in synchronizing macropinocytosis in different types of cells in culture were not successful, and we were not able to visualize dynamic phosphorylation in live cell imaging approaches. However, using various phospholipid markers as indirect indicators, we showed that LRRK2 dependent phosphorylation of Rab10 can happen on early macropinosomes demarcated with PI(3,4,5)P3 after the vesicle is fully closed and internalized into the cytoplasm. Our results thus pinpoint LRRK2 dependent phosphorylation of Rab10 at early stages of endocytic trafficking in phagocytic cells, but not during vesicle formation near the plasma membrane.
As opposed to most Rab10‐positive vesicles, pT73‐Rab10 vesicles often colocalized with Rab5, EEA1, Rab7 and Lamp1 in cells overexpressing LRRK2. Blocking LRRK2 kinase activity eliminated the pT73‐Rab10 vesicle pool, with Rab10 vesicles not able to restore the subpopulation of Rab10‐vesicles associated with these endosome markers. Based on these observations, we hypothesized that LRRK2 might be required for retaining a proportion of the macropinosomes in the cytoplasm toward endosome‐like phenotypes. In line with this finding, LRRK2 dependent phosphorylation of Rab10 blocked the interaction with EHBP1L1, a critical Rab10 effector known to drive the formation fast recycling tubular endosomes (Nakajo et al, 2016). Moreover, consistent with recent reports, phosphorylated Rab10 recruited RILPL2 on the vesicles that apparently were stalled in the cytoplasm. Noticeably, overexpression of the Q68L mutant Rab10 (GTP‐locked) showed accumulated vesicles with enlarged morphology. Although the Q68L‐Rab10 colocalized intensively with EHBP1L1, the turnover of these vesicles appeared blocked. We hypothesize that the Q68L‐Rab10 vesicles fail to interact with EHBP1L1 effector proteins such as Bin1 and the F‐actin network, although future studies would be required (Nakajo et al, 2016).
A wealth of literature supports the enrichment of the GPCR CCR5 in macropinosomes that can bind HIV‐1 virus for entry (Marechal et al, 2001; Gobeil et al, 2013). Consistent with these studies, we visualized nearly all Rab10‐positive macropinosomes as loaded with CCR5. We hypothesized that stalled macropinosomes in the cytoplasm caused by LRRK2 phosphorylation may provide an important signal transduction platform for chemokines and cytokines in the presence of CCL5‐bound CCR5. CCR5 is considered a critical receptor for CCL5 (RANTES) in chemotactic responses for monocytes and T cells (Schall et al, 1990, 1993). While T cells lack substantial Rab10 expression, knockdown of either total Rab10 protein or pT73‐Rab10 protein in macrophages blocked phospho‐Akt induction with CCL5 exposure. We propose that macropinocytosis critically complements traditional clathrin‐mediated endocytosis of some GPCRs in responding to chemokines in the extracellular space through amplification of signal transduction cascades. Consistent with this model, the macropinocytosis inhibitor EIPA, known to potently block macropinocytosis, efficiently blocked Akt activation induced by CCL5. Our initial experiments evaluating other GPCRs like CCR2 have so‐far yielded ambiguous localization to macropinosomes, suggesting some specificity in this pathway that requires further study. Our results may begin to clarify how macropinocytosis associated with phagocytes in the immune system use constitutive bulk fluid uptake for surveillance and initial response to chemokines.
Both Rab10 and the protein kinase that phosphorylates Rab10, LRRK2, demonstrate selective high expression in professional phagocytic cells. In other cell types, LRRK2 phosphorylates Rab8a in mediating ciliogenesis, with Rab10 opposing this function (Dhekne et al, 2018). However, macrophages and other leukocytes are not ciliated, consistent with refined cell‐type‐specific functions for different Rab proteins in different cells. Our previous studies in primary macrophages from mice suggest that LRRK2 kinase activity influences chemotaxis phenotypes of phagocytes in different tissues responding to a variety of immunological stimulants. These include thioglycollate‐induced peritonitis in the gut, overexpression of α‐synuclein via rAAV2 viral transduction in the brain, or intracranial injection of LPS (Daher et al, 2014, 2015; Moehle et al, 2015). Our results here suggest that a possible mechanism underlying these observations may involve trafficking of chemokine receptors, particularly CCR5 known to be important in the tissue extravasation of monocytes. Our results suggest LRRK2 kinase activity may serve to stabilize a fraction of macropinosome‐originating signaling endosomes to bolster chemokine‐receptor signaling. Other than the role in chemotaxis, recent studies have shown the CCR5/CCL5 axis affects a wide range of immune‐response including monocyte differentiation, integrin activation, protease secretion, glucose uptake, and (critically) macrophage survival during periods of intense inflammation (Aliberti et al, 2000; Zou et al, 2000; Locati et al, 2002; Lopez‐Cotarelo et al, 2017). Besides chemokine receptors, other surface receptors known to be internalized through macropinocytosis include both CD11b and MHC II. These candidates will require further study to understand possible intersection with LRRK2 kinase activity in disease‐linked pathways. With both Rab10 and LRRK2 genetically linked to proteinopathies that include AD and PD, respectively, and clear roles for phagocytic immune cells in the uptake and clearance of misfolded proteins, we further speculate that the pathway discovered here may explain in part how LRRK2 and Rab10 contribute to neurodegeneration mediated by immune cells.
Materials and Methods
Plasmids and constructs
pCDNA3.1‐eGFP‐Rab10 and pCDNA3.1‐Flag‐Rab10 were generated by insertion of synthesized Rab10 cDNA into pCDNA3.1+N‐eGFP plasmid or pCDNA3.1+/N‐DYK plasmid from Genscript as described (Liu et al, 2018). mRuby(N‐term)‐Rab5 was kindly provided by Dr. Laura Volpicelli‐Daley. The eGFP‐Fyve construct was generated by insertion of synthesized SARA1 Fyve domain into pCDNA3.1+N‐eGFP plasmid (Hayakawa et al, 2004). eGFP‐Akt‐PH (Addgene plasmid# 21218) and eGFP‐PLC δ –PH (Addgene plasmid # 51407) have been described. The pCDNA3.1‐Flag‐LRRK2R1441C construct was generated as previously described (Smith et al, 2006). The pCDNA3.1‐ RILPL2‐Flag construct was purchased from Genscript (OHu17095). The pCDNA3.1‐Myc‐mKate2‐EHBP1L1 construct was generated by insertion of synthesized mKate2 into EHBP1L1constructs (OMu05300C, Genscript) and pcDNA3.1+N‐MYC plasmid. The pCDNA3.1‐mKate2‐2xTAPP1‐PH‐doamin construct was generated by insertion of synthesized mKate2 and 2xTAPP1 PH domain (Goulden et al, 2019) into the pcDNA3.1+ plasmid.
Cell culture
Mouse bone marrow‐derived macrophages were generated by culturing the mouse bone marrow cells collected from 3‐ to 5‐month‐old mice into 10% fetal bovine serum and DMEM supplemented with M‐CSF or GM‐CSF. Mouse primary microglia cells were collected from newborn mice and cultured as previously described (Lian et al, 2016). Human monocytes were acquired from frozen PBMCs with the EasySep Human Monocyte (CD14+) negative selection kit (Stemcell Technologies, Inc.). Purified monocytes were cultured in RPMI‐1640+Glutamax media (Invitrogen) supplemented with 10% fetal bovine serum (Atlanta Biological), penicillin/streptomycin (Lonza), and Fungizone (2.5 U ml−1, Life Technologies). MDMi cells were induced as previous protocol described (Ryan et al, 2017). Briefly, monocytes were cultured in serum free RPMI‐1640 Glutamax media (Invitrogen) for 10 days before supplementation with GM‐CSF, M‐CSF, NFG‐β, CCL2, and IL‐34. Raw 264.7 cells (lineTIB‐71, ATCC) were cultured in 10% fetal bovine serum and DMEM. Transfection was performed using Neon nucleofection (Thermo Fisher Scientific) following the manufacturer's suggested protocol.
Mice
All the mice (3–5 months of age, males and females) used in this study were bred at Duke University with approval from the Institutional Animal Care and Use Committee. Mouse FLAG‐WT‐mLRRK2 BAC mice (B6.Cg‐Tg(Lrrk2)6Yue/J) and non‐transgenic (nTg) littermate controls (C57BL/6J) were included in the study, with quantitative PCR used to monitor BAC copy number. Hemizygous mice with 20–30 copies of the mouse LRRK2 BAC transgene were used in this study.
Oligonucleotide synthesis, screening and lead identification
Synthesis and purification of all chemically purified antisense oligonucleotides (ASOs) were performed as previously described (Seth et al, 2010). Approximately 500 ASOs were designed against the full‐length mouse Rab10 gene. ASOs were screened for activity in primary mixed cortical neurons derived from embryonic day 16 C67BL/6N mice at 7 μM starting concentrations. ASOs were applied to culture media for 24 h, after which cells were harvested for mRNA extraction and mouse Rab10 mRNA was quantified by quantitative RT–PCR. Rab10 ASO 1 and 2 (Table 1) were identified among the most potent dose‐responsive oligonucleotides selected for this study.
Immunoblotting
Protein lysates were analyzed using SDS–PAGE followed by transfer to PVDF membranes for immunoblotting with the indicated primary antibodies and HRP‐conjugated secondary antibodies. Signals were developed with Classico ECL reagent (Millipore) on a Chemidoc MP platform (BioRad). Saturated signals on immunoblots were not detected in any experiment used for analysis (ImageLab 6.1), and representative signals used for analysis are shown in figures. For phos‐tag analysis, SDS–PAGE gels were supplemented with 100 μM MnCl2 and 50 μM of Phos‐Tag reagent (Wako Chemicals) as previously described (Kinoshita et al, 2006; Steger et al, 2017; Liu et al, 2018). Gels were run at 100 V for 1.5 h in 25 mM Tris–HCl, 192 mM glycine, 0.1% SDS running buffer, followed by 2x washing in running buffer supplemented with 5 mM EDTA before transfer to PVDF (Immobilon‐FL) membranes at 35 V (constant) for 10 h. Intensities of the indicated bands were calculated with ImageLab software. The following antibodies were used for blotting: N241A/34 anti‐LRRK2 (Antibodies Inc), phospho‐T73‐Rab10(MJF‐R21, Abcam), anti‐eGFP antibody (ab6673, Abcam), total Rab10 antibody (D36C4, Cell signaling), anti‐FLAG M2 (Sigma), anti‐Myc antibody (ab32, Abcam), p38 antibody (8690, cell signaling), phospho‐p38 antibody (4511, Cell Signaling), IRF3 antibody(4302, Cell Signaling), phospho‐IRF3 antibody (4947, Cell Signaling), total Akt antibody (4691, Cell Signaling), phospho‐Akt antibody(4060, Cell Signaling), and β‐actin (sc‐47778 HRP, Santa Cruz).
Immunoprecipitation
Cells were lysed in buffers containing 150 mM NaCl, 50 mM Tris–HCl, pH 7.4, 10 mM MgCl2, 0.5% Triton‐100, 1× PhosSTOP and Protease inhibitor cocktails (Roche) followed by ultracentrifugation at 150,000 g for 20 min. Supernatants were collected and mixed with anti‐Flag resin (M8823, Sigma) for 12 h in 4°C. The beads were washed five times with lysis buffer and eluted with lysis buffer supplemented with 100 μg ml−1 3X FLAG peptide (F4799, Sigma). The eluted lysates were analyzed using SDS–PAGE or by mass spectrometry.
Mass spectrometry
Samples were reduced with 10 mM dithiothreitol for 30 min at 80°C and alkylated with 20 mM iodoacetamide for 30 min at room temperature. Next, samples were supplemented to a final concentration of 1.2% phosphoric acid with S‐Trap (Protifi) binding buffer (90% MeOH/100 mM TEAB). Proteins were trapped, digested using 20 ng μl−1 sequencing grade trypsin (Promega) for 1 h at 47°C, and eluted using 50 mM TEAB, followed by 0.2% FA, and lastly using 50% ACN/0.2% FA. All samples were then lyophilized to dryness and resuspended in 12 μl 1%TFA/2% acetonitrile containing 12.5 fmol μl−1 yeast alcohol dehydrogenase (Sigma). Quantitative LC/MS/MS was performed using a nanoAcquity UPLC system (Waters Corp) coupled to a Thermo Orbitrap Fusion Lumos high‐resolution accurate mass tandem mass spectrometer (Thermo) via a nanoelectrospray ionization source. Briefly, the sample was first trapped on a Symmetry C18 20 mm × 180 μm trapping column (5 μl min−1 at 99.9/0.1 v/v water/acetonitrile), after which the analytical separation was performed using a 1.8 μm Acquity HSS T3 C18 75 μm × 250 mm column (Waters Corp.) with a 90‐min linear gradient of 5–30% acetonitrile with 0.1% formic acid at a flow rate of 400 nl min−1 with a column temperature of 55°C. Data collection on the Fusion Lumos mass spectrometer was performed in a data‐dependent acquisition mode of r = 120,000 (@ m/z 200) full MS scan from m/z 375–1,500 with a target AGC value of 2 × 10⁵ ions. MS/MS scans were acquired at Rapid scan rate (Ion Trap) with an AGC target of 5 × 10³ ions and a max injection time of 100 ms. The total cycle time for MS and MS/MS scans was 2 s. A 20 sec dynamic exclusion was employed to increase depth of coverage. The total analysis cycle time for each sample injection was approximately 2 h. The MS/MS data was searched against the SwissProt M. musculus database (downloaded in Apr 2017) and an equal number of reversed‐sequence “decoys” for false discovery rate determination. Mascot Distiller and Mascot Server were utilized to produce fragment ion spectra and to perform the database searches. Database search parameters included fixed modification on Cys (carbamidomethyl) and variable modifications on Meth (oxidation) and Asn and Gln (deamidation).
Endocytosis assays
Dextran uptake assays included 0.1 mg ml−1 of fluorescein labeled 70 kDa Dextran (D1822, Invitrogen) or tetramethylrhodamine labeled 70 kDa dextran (D1818, Invitrogen) in 24‐well dishes for 30 min. Phagocytosis assays included mixing of 0.1 mg ml−1 of mouse IgG labeled Fluoresbrite‐641 Carboxylate Microspheres (17797‐1, Polysciences Inc.) with indicated cells for 30 min. Transferrin uptake assays included mixing of 0.1 mg ml−1 of Alexa‐488 labeled transferrin (T13342, Invitrogen) for 30 min. Macropinosome maturation assays included mixing 0.1 mg ml−1 of DQ‐conjugated ovalbumin (D12053, Invitrogen) for the indicated amount of time. Cells were washed at least three times with phosphate‐buffered saline and then fixed with 4% paraformaldehyde for 20 min before imaging. For pHrodo labeled dextran (P10361, Invitrogen) uptake, cells were imaged at indicated time points without washing or fixation. For CD11b recycling assays, cells were treated with 0.004% DMSO or 100 nM MLi2 prior to live cell surface staining with Alexa594 conjugated rat anti‐mouse CD11b antibody on ice for 10 min. MLi2 compound was synthesized in house as described (Kelly et al, 2018). CD11b‐antibody complexes on the cell surface were visualized with Alexa‐488 conjugated goat anti‐rat antibody (Invitrogen).
Chemotaxis assays
Primary mouse bone marrow‐derived macrophage cells (BMDM) were lifted off culture plates with 2 mM EDTA and then applied to the upper chamber of Transwell dishes (Corning Costar, CLS3464). Non‐mobile cells were removed from the upper surface of the Transwell membrane using a cotton swab. The migrated cells at the bottom surface of the Transwell membrane were fixed with 4% paraformaldehyde and stained with DAPI for imaging.
Imaging
As indicated, cells were fixed with 4% paraformaldehyde, washed three times with PBS, permeabilized with 0.1% saponin, and blocked with 5% normal goat serum (Invitrogen) and immunostained with the following primary antibodies: N241A/34 anti‐LRRK2 (Antibodies Inc), phospho‐T73‐Rab10(MJF‐R21‐22‐5, Abcam), total RAB10 antibody (MJF‐R23, Abcam), anti‐eGFP antibody (ab6673, Abcam), anti‐FLAG M2 (Sigma), anti‐Myc antibody (ab32, Abcam), EEA1(sc‐365652, Santa Cruz), Lamp1 (1D4B, Santa Cruz), Rab5 (46449T, Cell Signaling), Rab7 (sc‐271608, Santa Cruz), CD11b(14‐0112‐82, Thermo Fisher), CCR5(17‐1951‐80 Thermo Fisher Scientific), MHC II (107615, BioLegend). DAPI or Hoechst dyes were used for nuclear staining. Cell culture coverslips were mounted onto glass slides with ProLong Gold antifade reagent (Invitrogen). For endocytosis assays, cells in 24 well dishes were imaged using a Keyence bz‐x700 microscope with a 20× objective lens. For single‐cell live cell imaging, cells were cultured in 35 mm glass bottom plates and imaged with a 63× oil‐immersion objective. Objective lens in live cell imaging chambers were maintained at 37°C and chambers supplied with 5% CO2. For high‐resolution imaging, cells mounted on glass slides were imaged by Airyscan on a Zeiss 880 Inverted confocal microscope. Airyscan images and optimal Z‐stacks were processed using Zen Black 3.0 software (Carl Zeiss).
Vesicle and image quantification
Rab10‐positive (or pT73‐Rab10‐positive) vesicles were selected in cells based on the following criteria: (i) The diameter of the putative vesicle was larger than 200 nm in diameter (the range of macropinosomes are defined as 0.2–5 μm, (Wang et al, 2014)), (ii) The morphology of the putative vesicle is circular in our image frame, (iii) The intensity of the vesicle boundary is higher than the fluorescence intensity of the surrounding cytoplasm or nearby plasma membrane, (iv) The putative vesicle is fully closed in Z‐stack analysis. Dextran or DQ‐ovalbumin signals localized inside Rab10/pT73‐Rab10 vesicles were recorded as colocalized. Vesicular structures passing these criteria and loaded with dextran were defined herein as macropinosomes. Vesicular structures co‐positive with DQ fluorescence were defined as degradative macropinosomes. For colocalization quantification between Rab10/pT73‐Rab10 and different markers, > 50% of the circular boundary was required to consist of colocalized pixels (ImageJ). Of note, structures within ~100 nm distance would not be distinguished from one another in the XY or Z planes due to the resolution limit of Airyscan microscopy. For uptake experiments, fluorescence intensities of the images collected were measured using ImageJ. Background intensities were determined with incubation of dyes at 4°C and subtracted from images. Field intensities were normalized to the number of cells in the image (i.e., distinct nuclei). All images were processed, and final data curated, before assignment to groups.
Statistical analyses
GraphPad Prism 8 was used to perform all statistical analyses: data distributions were estimated by Shapiro–Wilk tests. Significance was assessed by one‐way ANOVA (with Tukey's group mean comparison post hoc test) or a two‐tailed t‐test for group comparisons. For non‐normal distributions, significance was assessed with Mann–Whitney tests. P values < 0.05 were considered significant.
Author contributions
Z.L. and A.B.W. designed the study. Z.L. performed the majority of experiments. E.X. assisted with primary human cell cultures. Z.L and E.X. quantified and analyzed the images. T.C. and H.T.Z. carried out ASO design, screening, and assay conditions. Z.L. and A.B.W. wrote the manuscript with input from E.X., T.C., and H.T.Z.
Conflict of interest
T.C. and H.T.Z. were employees of Ionis Pharmaceuticals during the period when the data were generated and interpreted. The remaining authors declare no competing financial interests.
Supporting information
Appendix
Expanded View Figures PDF
Dataset S1
Source Data for Expanded View and Appendix
Review Process File
Source Data for Figure 1
Source Data for Figure 5
Source Data for Figure 7
Source Data for Figure 9
Acknowledgements
We thank Dr. Laura Volpicelli‐Daley for the generous gift of mRuby(N‐term)‐Rab5 plasmid. We thank Greg Waitt, Erik Soderblom, and the Duke University School of Medicine for the use of the Proteomics and Metabolomics Shared Resource for Mass Spectrometry analysis. We thank Lisa Cameron and Duke Light Microscopy Core Facility for support of fluorescence microscopy image collection and analysis. This work was supported by NINDS R01 NS064934, P50 NS108675, and R33 NS097643 (A.B.W.).
The EMBO Journal (2020) 39: e104862
Data availability
The mass spectrometry data are deposited on PRIDE (Proteomics Identification Database) with identifier PXD019723. All primary data are available upon request.
References
- Aliberti J, Reis e Sousa C, Schito M, Hieny S, Wells T, Huffnagle GB, Sher A (2000) CCR5 provides a signal for microbial induced production of IL‐12 by CD8 alpha+ dendritic cells. Nat Immunol 1: 83–87 [DOI] [PubMed] [Google Scholar]
- Berger Z, Smith KA, Lavoie MJ (2010) Membrane localization of LRRK2 is associated with increased formation of the highly active LRRK2 dimer and changes in its phosphorylation. Biochemistry 49: 5511–5523 [DOI] [PMC free article] [PubMed] [Google Scholar]
- Besterman JM, Low RB (1983) Endocytosis: a review of mechanisms and plasma membrane dynamics. Biochem J 210: 1–13 [DOI] [PMC free article] [PubMed] [Google Scholar]
- Buckley CM, Gopaldass N, Bosmani C, Johnston SA, Soldati T, Insall RH, King JS (2016) WASH drives early recycling from macropinosomes and phagosomes to maintain surface phagocytic receptors. Proc Natl Acad Sci USA 113: E5906–E5915 [DOI] [PMC free article] [PubMed] [Google Scholar]
- Canton J (2018) Macropinocytosis: new insights into its underappreciated role in innate immune cell surveillance. Front Immunol 9: 2286 [DOI] [PMC free article] [PubMed] [Google Scholar]
- Cardoso CM, Jordao L, Vieira OV (2010) Rab10 regulates phagosome maturation and its overexpression rescues Mycobacterium‐containing phagosomes maturation. Traffic 11: 221–235 [DOI] [PubMed] [Google Scholar]
- Cosio G, Grinstein S (2008) Analysis of phosphoinositide dynamics during phagocytosis using genetically encoded fluorescent biosensors. Methods Mol Biol 445: 287–300 [DOI] [PubMed] [Google Scholar]
- Daher JP, Volpicelli‐Daley LA, Blackburn JP, Moehle MS, West AB (2014) Abrogation of alpha‐synuclein‐mediated dopaminergic neurodegeneration in LRRK2‐deficient rats. Proc Natl Acad Sci USA 111: 9289–9294 [DOI] [PMC free article] [PubMed] [Google Scholar]
- Daher JP, Abdelmotilib HA, Hu X, Volpicelli‐Daley LA, Moehle MS, Fraser KB, Needle E, Chen Y, Steyn SJ, Galatsis P et al (2015) Leucine‐rich repeat kinase 2 (LRRK2) pharmacological inhibition abates alpha‐synuclein gene‐induced neurodegeneration. J Biol Chem 290: 19433–19444 [DOI] [PMC free article] [PubMed] [Google Scholar]
- Dhekne HS, Yanatori I, Gomez RC, Tonelli F, Diez F, Schule B, Steger M, Alessi DR, Pfeffer SR (2018) A pathway for Parkinson's Disease LRRK2 kinase to block primary cilia and Sonic hedgehog signaling in the brain. eLife 7: e40202 [DOI] [PMC free article] [PubMed] [Google Scholar]
- Dolat L, Spiliotis ET (2016) Septins promote macropinosome maturation and traffic to the lysosome by facilitating membrane fusion. J Cell Biol 214: 517–527 [DOI] [PMC free article] [PubMed] [Google Scholar]
- Dzamko N, Gysbers A, Perera G, Bahar A, Shankar A, Gao J, Fu Y, Halliday GM (2017) Toll‐like receptor 2 is increased in neurons in Parkinson's disease brain and may contribute to alpha‐synuclein pathology. Acta Neuropathol 133: 303–319 [DOI] [PMC free article] [PubMed] [Google Scholar]
- Eguchi T, Kuwahara T, Sakurai M, Komori T, Fujimoto T, Ito G, Yoshimura SI, Harada A, Fukuda M, Koike M et al (2018) LRRK2 and its substrate Rab GTPases are sequentially targeted onto stressed lysosomes and maintain their homeostasis. Proc Natl Acad Sci USA 115: E9115–E9124 [DOI] [PMC free article] [PubMed] [Google Scholar]
- English AR, Voeltz GK (2013) Rab10 GTPase regulates ER dynamics and morphology. Nat Cell Biol 15: 169–178 [DOI] [PMC free article] [PubMed] [Google Scholar]
- Erami Z, Khalil BD, Salloum G, Yao Y, LoPiccolo J, Shymanets A, Nurnberg B, Bresnick AR, Backer JM (2017) Rac1‐stimulated macropinocytosis enhances Gbetagamma activation of PI3Kbeta. Biochem J 474: 3903–3914 [DOI] [PMC free article] [PubMed] [Google Scholar]
- Evans LD, Wassmer T, Fraser G, Smith J, Perkinton M, Billinton A, Livesey FJ (2018) Extracellular monomeric and aggregated tau efficiently enter human neurons through overlapping but distinct pathways. Cell Rep 22: 3612–3624 [DOI] [PMC free article] [PubMed] [Google Scholar]
- Gobeil LA, Lodge R, Tremblay MJ (2013) Macropinocytosis‐like HIV‐1 internalization in macrophages is CCR5 dependent and leads to efficient but delayed degradation in endosomal compartments. J Virol 87: 735–745 [DOI] [PMC free article] [PubMed] [Google Scholar]
- Goulden BD, Pacheco J, Dull A, Zewe JP, Deiters A, Hammond GRV (2019) A high‐avidity biosensor reveals plasma membrane PI(3,4)P2 is predominantly a class I PI3K signaling product. J Cell Biol 218: 1066–1079 [DOI] [PMC free article] [PubMed] [Google Scholar]
- Gu Z, Noss EH, Hsu VW, Brenner MB (2011) Integrins traffic rapidly via circular dorsal ruffles and macropinocytosis during stimulated cell migration. J Cell Biol 193: 61–70 [DOI] [PMC free article] [PubMed] [Google Scholar]
- Harrison RE, Bucci C, Vieira OV, Schroer TA, Grinstein S (2003) Phagosomes fuse with late endosomes and/or lysosomes by extension of membrane protrusions along microtubules: role of Rab7 and RILP. Mol Cell Biol 23: 6494–6506 [DOI] [PMC free article] [PubMed] [Google Scholar]
- Hayakawa A, Hayes SJ, Lawe DC, Sudharshan E, Tuft R, Fogarty K, Lambright D, Corvera S (2004) Structural basis for endosomal targeting by FYVE domains. J Biol Chem 279: 5958–5966 [DOI] [PubMed] [Google Scholar]
- Holmes BB, DeVos SL, Kfoury N, Li M, Jacks R, Yanamandra K, Ouidja MO, Brodsky FM, Marasa J, Bagchi DP et al (2013) Heparan sulfate proteoglycans mediate internalization and propagation of specific proteopathic seeds. Proc Natl Acad Sci USA 110: E3138–E3147 [DOI] [PMC free article] [PubMed] [Google Scholar]
- Hu Y, Chuang JZ, Xu K, McGraw TG, Sung CH (2002) SARA, a FYVE domain protein, affects Rab5‐mediated endocytosis. J Cell Sci 115: 4755–4763 [DOI] [PMC free article] [PubMed] [Google Scholar]
- Hutagalung AH, Novick PJ (2011) Role of Rab GTPases in membrane traffic and cell physiology. Physiol Rev 91: 119–149 [DOI] [PMC free article] [PubMed] [Google Scholar]
- Jager S, Bucci C, Tanida I, Ueno T, Kominami E, Saftig P, Eskelinen EL (2004) Role for Rab7 in maturation of late autophagic vacuoles. J Cell Sci 117: 4837–4848 [DOI] [PubMed] [Google Scholar]
- Jones AT (2007) Macropinocytosis: searching for an endocytic identity and role in the uptake of cell penetrating peptides. J Cell Mol Med 11: 670–684 [DOI] [PMC free article] [PubMed] [Google Scholar]
- Kelly K, Wang S, Boddu R, Liu Z, Moukha‐Chafiq O, Augelli‐Szafran C, West AB (2018) The G2019S mutation in LRRK2 imparts resiliency to kinase inhibition. Exp Neurol 309: 1–13 [DOI] [PMC free article] [PubMed] [Google Scholar]
- Kinoshita E, Kinoshita‐Kikuta E, Takiyama K, Koike T (2006) Phosphate‐binding tag, a new tool to visualize phosphorylated proteins. Mol Cell Proteomics 5: 749–757 [DOI] [PubMed] [Google Scholar]
- Koivusalo M, Welch C, Hayashi H, Scott CC, Kim M, Alexander T, Touret N, Hahn KM, Grinstein S (2010) Amiloride inhibits macropinocytosis by lowering submembranous pH and preventing Rac1 and Cdc42 signaling. J Cell Biol 188: 547–563 [DOI] [PMC free article] [PubMed] [Google Scholar]
- Lakadamyali M, Rust MJ, Zhuang X (2006) Ligands for clathrin‐mediated endocytosis are differentially sorted into distinct populations of early endosomes. Cell 124: 997–1009 [DOI] [PMC free article] [PubMed] [Google Scholar]
- Lee H, Flynn R, Sharma I, Haberman E, Carling PJ, Nicholls FJ, Stegmann M, Vowles J, Haenseler W, Wade‐Martins R et al (2020) LRRK2 is recruited to phagosomes and co‐recruits RAB8 and RAB10 in human pluripotent stem cell‐derived macrophages. Stem Cell Reports 14: 940–955 [DOI] [PMC free article] [PubMed] [Google Scholar]
- Lian H, Roy E, Zheng H (2016) Protocol for primary microglial culture preparation. Bio Protoc 6: e1989 [DOI] [PMC free article] [PubMed] [Google Scholar]
- Liu Z, Bryant N, Kumaran R, Beilina A, Abeliovich A, Cookson MR, West AB (2018) LRRK2 phosphorylates membrane‐bound Rabs and is activated by GTP‐bound Rab7L1 to promote recruitment to the trans‐Golgi network. Hum Mol Genet 27: 385–395 [DOI] [PMC free article] [PubMed] [Google Scholar]
- Locati M, Deuschle U, Massardi ML, Martinez FO, Sironi M, Sozzani S, Bartfai T, Mantovani A (2002) Analysis of the gene expression profile activated by the CC chemokine ligand 5/RANTES and by lipopolysaccharide in human monocytes. J Immunol 168: 3557–3562 [DOI] [PubMed] [Google Scholar]
- Lopez‐Cotarelo P, Gomez‐Moreira C, Criado‐Garcia O, Sanchez L, Rodriguez‐Fernandez JL (2017) Beyond chemoattraction: multifunctionality of chemokine receptors in leukocytes. Trends Immunol 38: 927–941 [DOI] [PubMed] [Google Scholar]
- Marechal V, Prevost MC, Petit C, Perret E, Heard JM, Schwartz O (2001) Human immunodeficiency virus type 1 entry into macrophages mediated by macropinocytosis. J Virol 75: 11166–11177 [DOI] [PMC free article] [PubMed] [Google Scholar]
- Moehle MS, Daher JP, Hull TD, Boddu R, Abdelmotilib HA, Mobley J, Kannarkat GT, Tansey MG, West AB (2015) The G2019S LRRK2 mutation increases myeloid cell chemotactic responses and enhances LRRK2 binding to actin‐regulatory proteins. Hum Mol Genet 24: 4250–4267 [DOI] [PMC free article] [PubMed] [Google Scholar]
- Nakajo A, Yoshimura S, Togawa H, Kunii M, Iwano T, Izumi A, Noguchi Y, Watanabe A, Goto A, Sato T et al (2016) EHBP1L1 coordinates Rab8 and Bin1 to regulate apical‐directed transport in polarized epithelial cells. J Cell Biol 212: 297–306 [DOI] [PMC free article] [PubMed] [Google Scholar]
- Pacitto R, Gaeta I, Swanson JA, Yoshida S (2017) CXCL12‐induced macropinocytosis modulates two distinct pathways to activate mTORC1 in macrophages. J Leukoc Biol 101: 683–692 [DOI] [PMC free article] [PubMed] [Google Scholar]
- Pfeffer SR, Dirac‐Svejstrup AB, Soldati T (1995) Rab GDP dissociation inhibitor: putting rab GTPases in the right place. J Biol Chem 270: 17057–17059 [DOI] [PubMed] [Google Scholar]
- Pratten MK, Lloyd JB (1979) Effects of temperature, metabolic inhibitors and some other factors on fluid‐phase and adsorptive pinocytosis by rat peritoneal macrophages. Biochem J 180: 567–571 [DOI] [PMC free article] [PubMed] [Google Scholar]
- Rai A, Oprisko A, Campos J, Fu Y, Friese T, Itzen A, Goody RS, Gazdag EM, Muller MP (2016) bMERB domains are bivalent Rab8 family effectors evolved by gene duplication. eLife 5: e18675 [DOI] [PMC free article] [PubMed] [Google Scholar]
- Ridge PG, Karch CM, Hsu S, Arano I, Teerlink CC, Ebbert MTW, Gonzalez Murcia JD, Farnham JM, Damato AR, Allen M et al (2017) Linkage, whole genome sequence, and biological data implicate variants in RAB10 in Alzheimer's disease resilience. Genome Med 9: 100 [DOI] [PMC free article] [PubMed] [Google Scholar]
- Ryan KJ, White CC, Patel K, Xu J, Olah M, Replogle JM, Frangieh M, Cimpean M, Winn P, McHenry A et al (2017) A human microglia‐like cellular model for assessing the effects of neurodegenerative disease gene variants. Sci Transl Med 9: eaai7635 [DOI] [PMC free article] [PubMed] [Google Scholar]
- Sallusto F, Cella M, Danieli C, Lanzavecchia A (1995) Dendritic cells use macropinocytosis and the mannose receptor to concentrate macromolecules in the major histocompatibility complex class II compartment: downregulation by cytokines and bacterial products. J Exp Med 182: 389–400 [DOI] [PMC free article] [PubMed] [Google Scholar]
- Sarkar K, Kruhlak MJ, Erlandsen SL, Shaw S (2005) Selective inhibition by rottlerin of macropinocytosis in monocyte‐derived dendritic cells. Immunology 116: 513–524 [DOI] [PMC free article] [PubMed] [Google Scholar]
- Scarselli M, Donaldson JG (2009) Constitutive internalization of G protein‐coupled receptors and G proteins via clathrin‐independent endocytosis. J Biol Chem 284: 3577–3585 [DOI] [PMC free article] [PubMed] [Google Scholar]
- Schall TJ, Bacon K, Toy KJ, Goeddel DV (1990) Selective attraction of monocytes and T lymphocytes of the memory phenotype by cytokine RANTES. Nature 347: 669–671 [DOI] [PubMed] [Google Scholar]
- Schall TJ, Bacon K, Camp RD, Kaspari JW, Goeddel DV (1993) Human macrophage inflammatory protein alpha (MIP‐1 alpha) and MIP‐1 beta chemokines attract distinct populations of lymphocytes. J Exp Med 177: 1821–1826 [DOI] [PMC free article] [PubMed] [Google Scholar]
- Schuck S, Gerl MJ, Ang A, Manninen A, Keller P, Mellman I, Simons K (2007) Rab10 is involved in basolateral transport in polarized Madin‐Darby canine kidney cells. Traffic 8: 47–60 [DOI] [PubMed] [Google Scholar]
- Seth PP, Vasquez G, Allerson CA, Berdeja A, Gaus H, Kinberger GA, Prakash TP, Migawa MT, Bhat B, Swayze EE (2010) Synthesis and biophysical evaluation of 2’,4’‐constrained 2'O‐methoxyethyl and 2’,4’‐constrained 2'O‐ethyl nucleic acid analogues. J Org Chem 75: 1569–1581 [DOI] [PubMed] [Google Scholar]
- Shim J, Lee SM, Lee MS, Yoon J, Kweon HS, Kim YJ (2010) Rab35 mediates transport of Cdc42 and Rac1 to the plasma membrane during phagocytosis. Mol Cell Biol 30: 1421–1433 [DOI] [PMC free article] [PubMed] [Google Scholar]
- Shutinoski B, Hakimi M, Harmsen IE, Lunn M, Rocha J, Lengacher N, Zhou YY, Khan J, Nguyen A, Hake‐Volling Q et al (2019) Lrrk2 alleles modulate inflammation during microbial infection of mice in a sex‐dependent manner. Sci Transl Med 11: eaas9292 [DOI] [PubMed] [Google Scholar]
- Smith WW, Pei Z, Jiang H, Dawson VL, Dawson TM, Ross CA (2006) Kinase activity of mutant LRRK2 mediates neuronal toxicity. Nat Neurosci 9: 1231–1233 [DOI] [PubMed] [Google Scholar]
- Steger M, Tonelli F, Ito G, Davies P, Trost M, Vetter M, Wachter S, Lorentzen E, Duddy G, Wilson S et al (2016) Phosphoproteomics reveals that Parkinson's disease kinase LRRK2 regulates a subset of Rab GTPases. eLife 5: e12813 [DOI] [PMC free article] [PubMed] [Google Scholar]
- Steger M, Diez F, Dhekne HS, Lis P, Nirujogi RS, Karayel O, Tonelli F, Martinez TN, Lorentzen E, Pfeffer SR et al (2017) Systematic proteomic analysis of LRRK2‐mediated Rab GTPase phosphorylation establishes a connection to ciliogenesis. eLife 6: e31012 [DOI] [PMC free article] [PubMed] [Google Scholar]
- Steinman RM, Brodie SE, Cohn ZA (1976) Membrane flow during pinocytosis. A stereologic analysis. J Cell Biol 68: 665–687 [DOI] [PMC free article] [PubMed] [Google Scholar]
- Steinman RM, Mellman IS, Muller WA, Cohn ZA (1983) Endocytosis and the recycling of plasma membrane. J Cell Biol 96: 1–27 [DOI] [PMC free article] [PubMed] [Google Scholar]
- Toh WH, Louber J, Mahmoud IS, Chia J, Bass GT, Dower SK, Verhagen AM, Gleeson PA (2019) FcRn mediates fast recycling of endocytosed albumin and IgG from early macropinosomes in primary macrophages. J Cell Sci 133: jcs235416 [DOI] [PubMed] [Google Scholar]
- Wandinger‐Ness A, Zerial M (2014) Rab proteins and the compartmentalization of the endosomal system. Cold Spring Harb Perspect Biol 6: a022616 [DOI] [PMC free article] [PubMed] [Google Scholar]
- Wang D, Lou J, Ouyang C, Chen W, Liu Y, Liu X, Cao X, Wang J, Lu L (2010) Ras‐related protein Rab10 facilitates TLR4 signaling by promoting replenishment of TLR4 onto the plasma membrane. Proc Natl Acad Sci USA 107: 13806–13811 [DOI] [PMC free article] [PubMed] [Google Scholar]
- Wang JT, Teasdale RD, Liebl D (2014) Macropinosome quantitation assay. MethodsX 1: 36–41 [DOI] [PMC free article] [PubMed] [Google Scholar]
- Wong KW, Isberg RR (2003) Arf6 and phosphoinositol‐4‐phosphate‐5‐kinase activities permit bypass of the Rac1 requirement for beta1 integrin‐mediated bacterial uptake. J Exp Med 198: 603–614 [DOI] [PMC free article] [PubMed] [Google Scholar]
- Zeineddine R, Pundavela JF, Corcoran L, Stewart EM, Do‐Ha D, Bax M, Guillemin G, Vine KL, Hatters DM, Ecroyd H et al (2015) SOD1 protein aggregates stimulate macropinocytosis in neurons to facilitate their propagation. Mol Neurodegener 10: 57 [DOI] [PMC free article] [PubMed] [Google Scholar]
- Zou W, Borvak J, Marches F, Wei S, Galanaud P, Emilie D, Curiel TJ (2000) Macrophage‐derived dendritic cells have strong Th1‐polarizing potential mediated by beta‐chemokines rather than IL‐12. J Immunol 165: 4388–4396 [DOI] [PubMed] [Google Scholar]
Associated Data
This section collects any data citations, data availability statements, or supplementary materials included in this article.
Supplementary Materials
Appendix
Expanded View Figures PDF
Dataset S1
Source Data for Expanded View and Appendix
Review Process File
Source Data for Figure 1
Source Data for Figure 5
Source Data for Figure 7
Source Data for Figure 9
Data Availability Statement
The mass spectrometry data are deposited on PRIDE (Proteomics Identification Database) with identifier PXD019723. All primary data are available upon request.