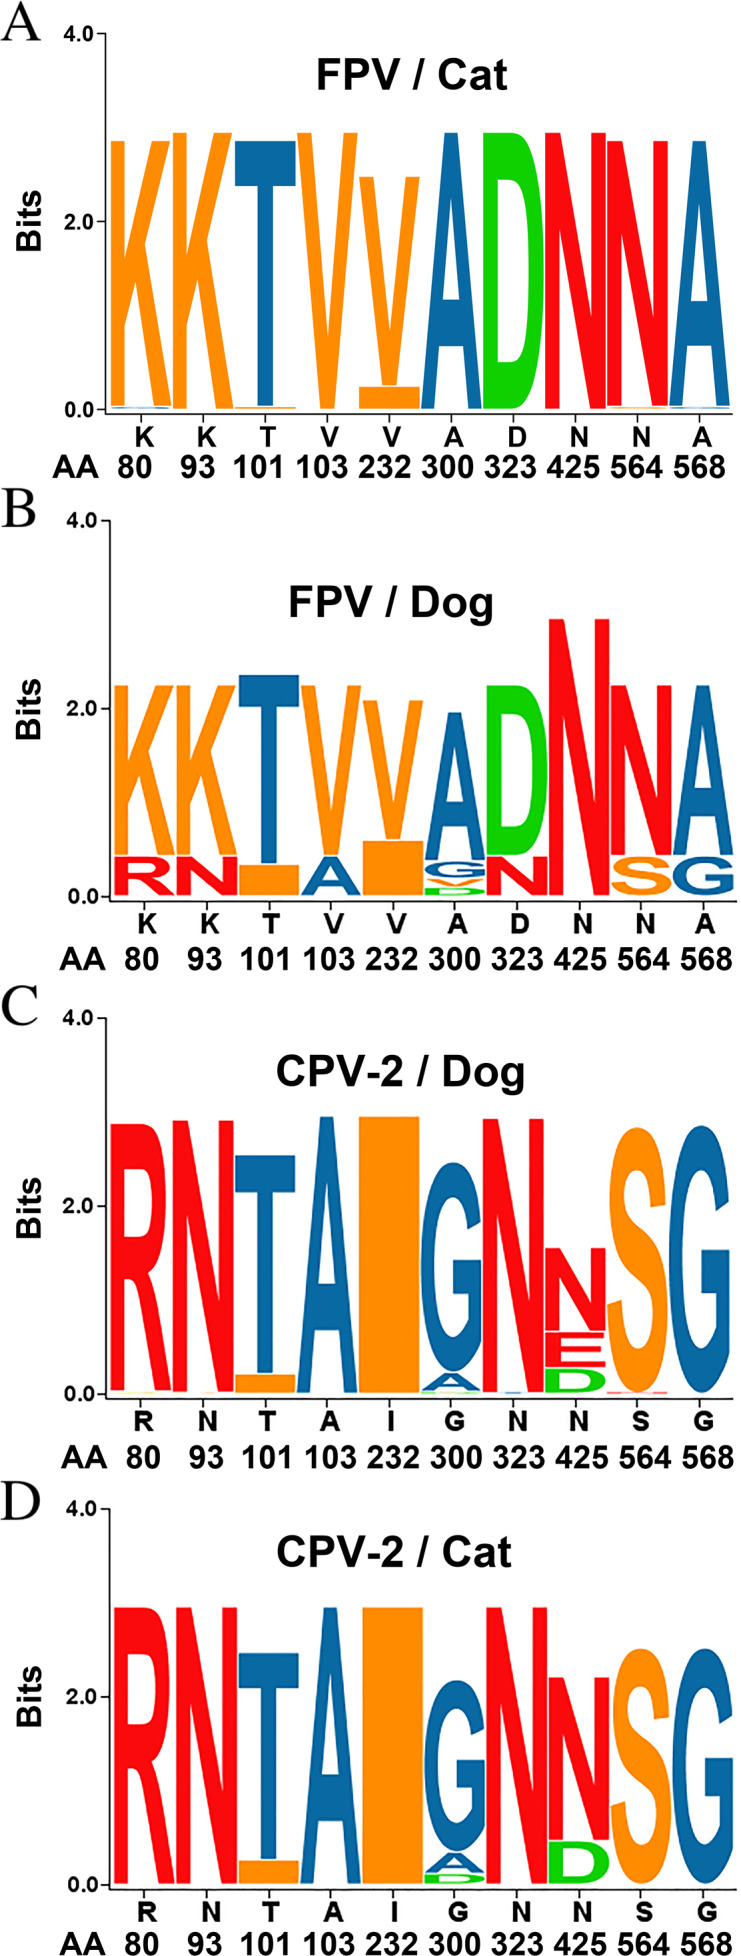
Figure 2. Sequence logos showing the amino acid usage in the VP2 of Carnivore protoparvoviruses.

Sequence logos showing the amino acid usage in the VP2 of Carnivore protoparvoviruses (n = 600). (A) FPV in cat, (B) FPV in dog, (C) CPV-2 in dog and (D) CPV-2 in cat. The relative sizes of the letters in each stack represent their relative frequencies at each amino acid position. The height of the entire stack of residues is the information measured in bits (Y-axis): from minimum (0) to maximum conservation (3).
