

Abstract
Purpose
This study aimed to construct a database of the effective doses (ED) from F-18 fluorodeoxyglucose (FDG) torso positron emission tomography/computed tomography (PET/CT) in Korea to provide data that supports the reduction of the CT dose of PET/CT and optimization of PET/CT protocols in Korea.
Methods
We investigated data of ED and CT parameters of FDG PET/CT. The data were analyzed by body weight groups.
Results
A total of 31 hospitals participated in the survey (99 adults). The mean total EDs (± SD) were 8.77 ± 2.76, 10.93 ± 3.14, and 12.57 ± 3.79 mSv for the 55-, 70-, and 85-kg groups, respectively. The FDG EDs were 4.80 ± 0.98, 6.05 ± 1.15, and 6.89 ± 1.52 mSv, and the CT EDs were 4.00 ± 2.12, 4.88 ± 2.51, and 5.68 ± 2.89 mSv, respectively. Of the enrolled hospitals, 54.5% used ultra-low-dose CT protocols, and their CT ED was significantly lower than low-dose CT group in all groups (2.9 ± 1.0, 3.2 ± 1.1, and 3.3 ± 1.0 mSv vs. 6.6 ± 1.6, 7.2 ± 2.1, and 7.9 ± 2.2 mSv, all p < 0.001, respectively). In the ultra-low-dose CT group, the CT ED with the iterative reconstruction was significantly lower than that of CT without iterative reconstruction in the 55-kg group (2.4 ± 0.9 vs. 3.3 ± 0.9, p = 0.04).
Conclusions
These results and current recommendations can be helpful for optimizing PET/CT diagnostic reference level (DRL) and reducing unnecessary PET/CT radiation exposure.
Keywords: PET/CT, CT, Effective dose, 18F-FDG, Guidelines
Introduction
F-18 Fluorodeoxyglucose (FDG) positron emission tomography/computed tomography (PET/CT) is widely used for evaluating malignancies. Recently, the image quality of PET/CT has sufficiently improved to allow clinicians to reduce radiation exposure and still make accurate diagnoses. This recent shift of paradigm means that clinicians should consider “adequate” image quality instead of “the best” image quality for CT and PET/CT, in order to avoid unnecessary radiation exposure during imaging studies.
Currently, there is no standard protocol for CT and PET/CT studies in terms of a patient’s radiation dose; thus, we need to know the current status for which we use torso PET/CT and the method to reduce the CT dose according to specific clinical conditions, such as attenuation correction or exact localization.
Effective doses (ED) are commonly used when evaluating and comparing relative biologic risk of ionizing radiation during PET and CT examination [1]. The ED of torso FDG PET/CT (total ED) is estimated by the summation of the ED of the FDG PET portion (FDG ED) and the ED of the CT portion (CT ED). Based on the as low as reasonably achievable (ALARA) principle, efforts to optimize the ED for daily PET/CT procedures have been made [2–8]. Using lower activity of FDG, lower tube current or tube potential might result in the reduction of total ED. However, these might produce low image quality that is not suitable for image interpretation. Recently, specific image reconstruction methods such as ASIR (GE) and SAFIRE (Siemens) have been used for the improvement of image quality. These image reconstruction techniques may help reduce CT ED. However, scanner type, CT acquisition parameters, and the level of injected activity of FDG differ among institutions [9–11], resulting in a wide range of total EDs from FDG PET/CT examinations in Korea.
Diagnostic reference levels (DRL) are recommended by the International Commission on Radiological Protection (ICRP) [10, 12, 13]. DRL are defined as dose levels in diagnostic radiological practices or typical levels of radiopharmaceutical activity for groups of standard-sized patients or phantoms [10, 14]. DRL are neither an absolute line between good and bad practice, nor the upper limit of daily practice [15]. However, setting up and implementing DRL are important for optimizing and reducing the dose range [15].
To construct a database of PET/CT DRL, we surveyed data on ED and CT acquisition parameters of torso FDG PET/CT acquisitions in Korea to provide data that supports the reduction of CT dose during PET/CT examinations and protocol optimization.
Materials and Methods
Enrolled Hospitals and Survey
In September 2018, we emailed PET/CT centers where members of the Korean Society of Nuclear Medicine (KSNM) and/or the Korean Society of Nuclear Medicine Technology (KSNMT) are currently employed (as one of the annual projects of the Quality Assure Committee of KSNM with the cooperation of KSNMT). Each institution was asked to provide PET/CT dose data for adult patients according to their body weight range (55 kg, 70 kg, and 85 kg, ± 2 kg) as CT tube current modulation depends on body weight and size.
For the purpose of database construction, the PET/CT protocol was limited to “FDG PET” scans. PET/CT variables collected were as follows: age, sex, body weight, scanner name, FDG dosage, and CT acquisition parameters, including kVp, CT dose index volume (CTDIvol), and CT slice locations dividing torso into each body part (details were shown as the “estimation of ED”). In addition, each institution was asked whether they were using any additional CT dose reduction protocol in their PET/CT examinations such as automatic exposure control (AEC) systems, the details of how they used CT and FDG dose setting, and whether they use newer iterative reconstruction program (for example, SAFIRE for Siemens; ASIR for GE; iterative model reconstruction for Philips).
Of the 49 tertiary referral or university hospitals among 133 total institutions that had PET/CT scanners in Korea (as of 2018), 30 tertiary referral or university hospitals and 1 national cancer center with 35 PET/CT scanners participated in this survey. Each hospital replied with data of adults of three different body weights (55 kg, 70 kg, and 85 kg, ± 2 kg). Among them, 26 hospitals with one scanner replied with data of each of the three body weights (78 scans). Three hospitals had two scanners which were from the different manufacturers; thus, they replied with data of both scanners (18 scans). One hospital with two scanners only replied for one group (1 scan). Two hospitals replied only one body weight group (2 scans). In total, the PET/CT scans of 99 adults (M:F, 37:62) were enrolled with 33 adult PET/CT scans for each of 55-, 70-, and 85-kg groups, respectively.
Estimation of ED
The ED from FDG was calculated according to the ICRP 80 as follows: 0.019 mSv/MBq for adults [16]. The CT ED was calculated according to the ICRP 60. We divided the CT portion into six body parts, including the head (skull base to C1), neck, chest (T1 to hepatic dome), abdomen (hepatic dome to iliac crest), pelvis (below iliac crest), and thigh; the length of each body part was calculated using CT slice locations, and each conversion factor was applied to its part. The conversion factors (mSv mGy−1 cm−1) used in this study for the head, neck, chest, abdomen, pelvis, and thigh were 0.0016, 0.0058, 0.0137, 0.0155, 0.0167, and 0.0106 respectively [17, 18]. The CT ED was calculated by multiplying the dose length product (DLP) and the conversion factor of each body part [17, 18]. DLP was defined as the product of CTDIvol multiplied by the scan length of each body part. The CT ED was obtained by the summation of the EDs of all the six body parts. Finally, the total ED was calculated by the sum of the EDs from FDG and CT.
Statistics
The total ED, FDG ED, and CT ED were analyzed for all adult patients of subgroups of three different body weights. The Shapiro-Wilk test was used for normal distributions. The Mann-Whitney U test was used for comparison of the EDs between two groups. The Kruskal-Wallis test, chi-squared test, and Mann-Whitney U test were used for comparison of CT protocols between groups.
We used Mann-Whitney U test for comparisons of CT Ed and FDG ED according to CT acquisition and reconstruction protocols in tube voltage groups and in tube current groups. We analyzed the percentage of CT protocols in the 70-kg group.
Medcalc statistical software (v18.5, MedCalc Software Ltd., Ostend, Belgium) was used for all statistical tests. p < 0.05 was considered as statistically significant.
Results
Part I: Results of the Survey
ED According to Body Weight
Table 1 describes the results of the FDG ED, CT ED, and total ED estimation of the enrolled scans according to body weight. The average FDG injected dosage was 4.50 ± 1.24 MBq/kg (95% CI: 4.25–4.75). As FDG injected dose was decided by the body weight, the FDG ED was significantly different across the body weight groups. The CT ED, FDG ED, and total ED values were 4.88 ± 2.51 mSv, 6.05 ± 1.15 mSv, and 10.93 ± 3.14 mSv in the 70-kg group, respectively. The CT ED accounted for 43.0% of the total ED. The range of the CT ED was wider than that of the FDG ED (Fig. 1). The CT ED of the abdomen and pelvis sections contributed 61.0% of the total CT ED.
Table 1.
Radiation dose of FDG torso PET/CT and CT acquisition parameters according to body weight
| Variables | Body weight | p valuea | ||
|---|---|---|---|---|
| n = 33 for each group | 55 kg | 70 kg | 85 kg | |
| Tube potential (kVp) | 100 (n = 4) | 100 (n = 4) | 100 (n = 2) | 0.979 |
| 120b (n = 22) | 120b (n = 22) | 120b (n = 22) | ||
| 140 (n = 7) | 140 (n = 7) | 140 (n = 9) | ||
| CTDIvol (mGy, mean ± SD) | 3.72 ± 1.99 | 4.26 ± 2.16 | 4.82 ± 2.43 | 0.243c |
| 0.457d | ||||
| 0.075e | ||||
| Total length (cm, mean ± SD) | 89.36 ± 0.83 | 94.40 ± 7.07 | 97.20 ± 6.79 | 0.002c* |
| 0.064d | ||||
| < 0.0001e* | ||||
| DLP (mGy·cm, mean ± SD) | 342.60 ± 174.88 | 416.28 ± 206.12 | 482.80 ± 234.14 | 0.102c |
| 0.228d | ||||
| 0.008e* | ||||
| CT ED (mean ± SD) | 4.00 ± 2.12 | 4.88 ± 2.51 | 5.68 ± 2.89 | 0.129c |
| (median) | 3.24 | 4.27 | 5.28 | 0.279d |
| 0.010e* | ||||
| FDG ED (mean ± SD) | 4.80 ± 0.98 | 6.05 ± 1.15 | 6.89 ± 1.52 | < 0.0001c* |
| (median) | 4.79 | 6.12 | 7.05 | 0.008d* |
| < 0.0001e* | ||||
| Total ED (mean ± SD) | 8.77 ± 2.76 | 10.93 ± 3.14 | 12.57 ± 3.79 | 0.005c* |
| (median) | 8.79 | 10.68 | 12.17 | 0.072d |
| 0.0001e* | ||||
aChi-squared test for tube potential and Mann-Whitney U test for the others
bThere is 110 kVp (n = 1) included
cComparison between 70 and 55 kg
dComparison between 70 and 85 kg
eComparison between 85 and 55 kg
*Statistically significant
ED, effective dose; total ED = CT ED plus FDG ED; CTDIvol, volume of CT dose index; DLP, dose length product; SD, standard deviation.
Fig. 1.
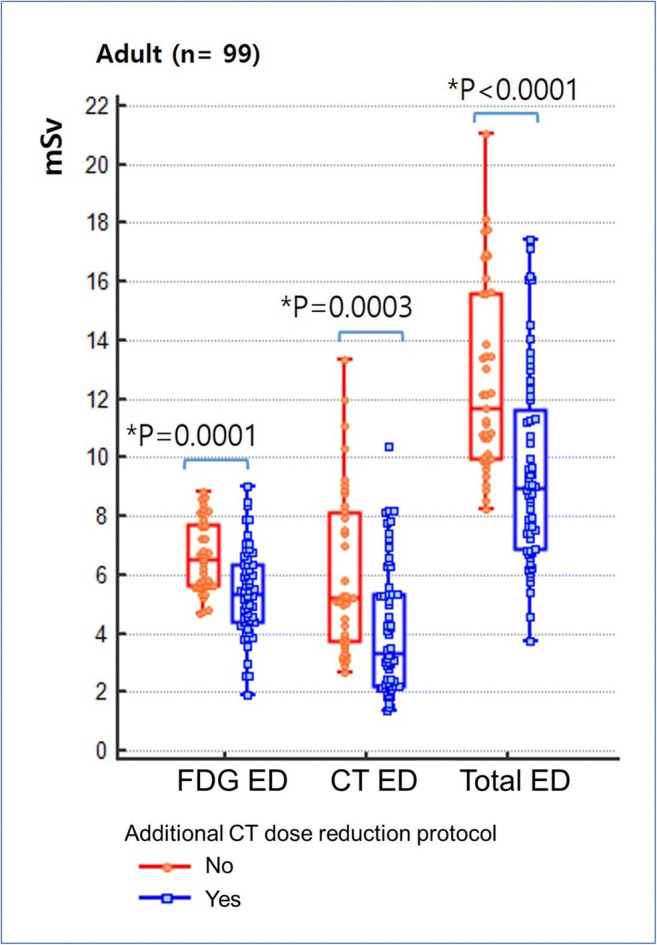
Effective doses for FDG torso PET/CT applied with/without additional CT dose reduction
The CT ED, FDG ED, and total ED values in 55-kg group were 4.00 ± 2.12 mSv, 4.88 ± 0.98 mSv, and 8.77 ± 2.76 mSv, respectively. Meanwhile, the CT ED, FDG ED, and total ED values in 85-kg group were 5.68 ± 2.89 mSv, 6.89 ± 1.52 mSv, and 12.57 ± 3.79 mSv, respectively. The CT ED demonstrated significant difference only between the 55- and 85-kg groups. The CT ED did not show significant difference between the 70- and 85-kg groups. Thus, there was no significant difference of total ED between the 70- and 85-kg groups. The total EDs of the 55-kg and 70-kg groups, as well as the 55-kg and 85-kg groups, were found to be significantly different.
CT Acquisition Parameters According to Body Weight
Table 1 describes the choice of CT acquisition parameters in the enrolled hospitals. A majority of the enrolled institutions (85.8%) used a low-dose CT protocol of ≤ 120 kVp; 120 kVp (n = 21), 110 kVp (n = 1), and 100 kVp (n = 4). The remaining institutions (21.2%) used 140 kVp (n = 7). In the 70-kg group, the average CTDIvol, scan length, and DLP were 4.26 ± 2.16 mGy, 94.40 ± 7.07 cm, and 416.28 ± 206.12 mGy cm, respectively. DLP and scan length were significantly different only between the 55- and 85-kg groups. Table 2 shows that the CT ED with lower tube potential setting (≤ 120 kVp) was significantly lower than that with high tube potential setting (140 kVp) in each body weight group; 3.5 ± 1.7 vs. 5.9 ± 2.7 in the 55-kg group (p > 0.05.), 4.2 ± 2.0 vs. 7.6 ± 2.7 in the 70-kg group (p = 0.015), and 4.9 ± 2.3 vs. 7.9 ± 3.3 in the 85-kg group (p = 0.029), respectively. When the cut-off value of 5 mSv was applied, there was an ultra-low-dose CT group (n = 18, 54.5%) in our survey data among the 70-kg adults (Table 3). The CT ED with ultra-low-dose tube current setting was significantly lower than those with low-dose tube current setting in all body weight groups (2.9 ± 1.0 mSv vs. 6.6 ± 1.6 mSv, 3.2 ± 1.1 mSv vs. 7.2 ± 2.1 mSv, and 3.3 ± 1.0 mSv vs. 7.9 ± 2.2 mSv in 55-kg, 70-kg, and 85-kg groups, respectively, all p < 0.001). In the ultra-low-dose CT group, the CT ED with iterative reconstruction (n = 9) was significantly lower than that without iterative reconstruction (n = 9) in the 55-kg group (2.4 ± 0.9 vs. 3.3 ± 0.9, p = 0.04).
Table 2.
Comparisons of CT ED and FDG ED according to CT protocols
| Tube voltage settings | Tube current settings | |||||||
|---|---|---|---|---|---|---|---|---|
| 140-kVp group | ≤ 120-kVp group | Reduction % | p value | Low-dose group | Ultra-low-dose group | Reduction (%) | p value | |
| 55 kg (n = 33) | ||||||||
| N | 7 | 26 | 10 | 23 | ||||
| CTDIvol (mGy) | 5.4 ± 2.6 | 3.3 ± 1.6 | 38.9 | 0.354 | 6.2 ± 1.6 | 2.6 ± 0.8 | 58.1 | < 0.001 |
| DLP (mGy cm) | 49.4 ± 22.8 | 30.2 ± 13.6 | 38.9 | 0.137 | 55.9 ± 12.7 | 24.8 ± 8.52 | 55.6 | < 0.001 |
| CT ED | 5.9 ± 2.7 | 3.5 ± 1.7 | 40.0 | 0.191 | 6.6 ± 1.6 | 2.9 ± 1.0 | 56.1 | < 0.001 |
| FDG ED | 5.4 ± 0.7 | 4.6 ± 1.0 | 14.8 | 0.127 | 5.2 ± 0.7 | 4.5 ± 1.0 | 19.6 | 0.098 |
| Total ED | 11.3 ± 3.0 | 8.1 ± 2.3 | 28.3 | 0.107 | 11.8 ± 2.0 | 7.4 ± 1.8 | 37.2 | < 0.001 |
| 70 kg (n = 33) | ||||||||
| N | 7 | 26 | 15 | 18 | ||||
| CTDIvol (mGy) | 6.7 ± 2.2 | 3.6 ± 1.7 | 46.1 | 0.010 | 6.2 ± 1.8 | 2.8 ± 1.0 | 54.8 | < 0.001 |
| DLP (mGy cm) | 36.0 ± 16.9 | 62.6 ± 20.7 | 42.4 | 0.015 | 60.3 ± 16.0 | 27.8 ± 9.8 | 53.8 | < 0.001 |
| CT ED | 7.6 ± 2.7 | 4.2 ± 2.0 | 45.0 | 0.015 | 7.2 ± 2.1 | 3.2 ± 1.1 | 55.6 | < 0.001 |
| FDG ED | 6.5 ± 0.7 | 5.9 ± 1.2 | 9.2 | 0.080 | 6.6 ± 0.9 | 5.6 ± 1.2 | 15.2 | 0.057 |
| Total ED | 14.1 ± 2.8 | 10.1 ± 2.7 | 28.4 | 0.010 | 13.7 ± 2.5 | 8.9 ± 1.6 | 35.0 | < 0.001 |
| 85 kg (n = 33) | ||||||||
| N | 9 | 24 | 17 | 16 | ||||
| CTDIvol (mGy) | 6.6 ± 2.6 | 4.2 ± 2.1 | 36.4 | 0.029 | 6.7 ± 1.8 | 2.8 ± 0.8 | 58.2 | < 0.001 |
| DLP (mGy cm) | 65.7 ± 25.1 | 41.7 ± 19.5 | 36.5 | 0.029 | 66.9 ± 16.2 | 28.5 ± 9.0 | 57.4 | < 0.001 |
| CT ED | 7.9 ± 3.3 | 4.9 ± 2.3 | 38.2 | 0.029 | 7.9 ± 2.2 | 3.3 ± 1.0 | 58.2 | < 0.001 |
| FDG ED | 7.6 ± 1.5 | 6.6 ± 1.5 | 13.2 | 0.151 | 7.7 ± 0.9 | 6.1 ± 1.6 | 13.4 | 0.003 |
| Total ED | 15.5 ± 4.2 | 11.5 ± 3.1 | 25.8 | 0.015 | 15.6 ± 2.4 | 9.4 ± 1.8 | 39.7 | < 0.001 |
Statistically significant by Mann-Whitney U test
ED, effective dose; FDG ED, ED from PET portion of FDG torso PET/CT; CT ED, ED from CT portion of FDG torso PET/CT; total ED, total ED from FDG torso PET/CT
Table 3.
Current CT protocols of PET/CT in 70-kg group
| Low-dose group | Ultra-low-dose group | ||
|---|---|---|---|
| CT ED 7.2 ± 2.1 mSv | % (n) | CT ED 3.2 ± 1.1 mSv | % (n) |
| 120/140 kVp, max. current 120 mA | 26.7% (4) | 120/140 kVp, max. current ≤ 100 mA | 5.5% (1) |
| 120/140 kVp, max. current 210 mA | 20.0% (3) | 120/140 kVp, fixed current ≤ 60 mA | 61.1% (11) |
| 120/140 kVp, fixed current 100/110 mA | 13.3% (2) | 100/120 kVp, reference 60–80 mA | 33.3% (6) |
| 100/120/140 kVp, reference 100 mA | 40.0% (6) | ||
| Total | 15 | 18 | |
When the cut-off value of 5 mSv was applied, there was an ultra-low-dose CT group (n = 18, 54.5%) in our survey data of 70-kg adults
Figure 2 revealed that additional CT dose reduction protocol was more beneficial in the body parts in the 55-kg group (CT EDs of the head, neck, chest, abdomen, and pelvis) compared with those of in the 70- and 85-kg groups. Also, in all adult patients, the FDG dosage was significantly lower among the institutions in which additional CT dose reduction protocol was 4.3 MBq/kg vs. 5.6 MBq/kg, p < 0.001.
Fig. 2.

Effective doses of CT portion of FDG torso PET/CT in each body part
Part II: Current Guidelines
To date, five published documents have mentioned recommendations for the CT portion of PET/CT (Table 3) [2–5, 7]. Several of these guidelines mentioned the specific CT settings that can be used. One document recommended using 120 kVp with automated mA adjustment for adult PET/CT [2]. However, they also declared that these recommendations are not inflexible rules. In addition, all of them agreed that the ALARA principle should be adhered to in order to achieve the goals of PET/CT dose optimization [2–5, 7] (Table 4).
Table 4.
Current recommendations for CT protocol of PET/CT
| Year | Organization/title |
|---|---|
| 2012 | American College of Radiology/ Image Wisely: CT Protocol Selection in PET/CT Imaging [4] |
|
“CT related methods to reduce the dose -Minimize z-axis coverage whenever possible -Decrease tube voltage (kVp) -Decrease tube current and exposure time (mAs) -Increase pitch (spiral data overlap is decreased in the Z distribution as the pitch is increased) -Use automatic tube current modulation” |
|
| 2013 | International Atomic Energy Agency/Standard Operating Procedures for PET/CT: A Practical Approach for Use in Adult Oncology: Protocol for CT imaging during the acquisition of PET/CT [2] |
|
“Specific numbers of CT parameters for tube potential and current are recommended for 3 different 3D-PET/CT purposes (1) for attenuation correction (AC) and anatomical localization (AL); (2) for AC and AL for patients with head and neck tumors and; (3) for AC and diagnostic parameters]. Tube potential with 120 kV and smart mA (auto mA) are recommended in all three purposes.” |
|
| 2014 | RSNA/Quantitative Imaging Biomarkers Alliance/UPICT of FDG PET/CT version 2.0 [3] |
| “The CT technique used should result in as low as reasonably achievable (ALARA) exposure needed to achieve the intended goal of imaging working with the scanner manufacturer to achieve this objective.” | |
| 2015 | SNMMI & EANM/Procedure guidelines for tumor imaging of FDG PET/CT: version 2.0 [5] |
| “CT scan parameters should be chosen such that patient exposure is minimized, yet dose is adequate to obtain the necessary diagnostic information.” | |
| 2016 | American College of Radiology & Society of Pediatric Radiology/ ACR–SPR Practice Parameter for Performing FDG PET/CT in Oncology [7] |
|
“For the CT scanner, a. spiral scan time: <5 seconds (<2 seconds is preferable) b. Slice thickness and collimation: <5 mm (<2 mm is preferable) c. Limiting spatial resolution: >8 lp)/cm for >32-cm display field of view (DFOV) and >10 lp/cm for <24-cm DFOV” |
|
| 2017 | Optimization of Pediatric PET/CT [22] |
| “Child-size CT protocols: Decrease mAs, reduce kVp, Increase pitch, use appropriate positioning using anatomic centering, use dose modulation, choose the most appropriate CT methodology for their clinical situation, and to reduce the extent of areas imaged.” |
These 5 recommendations are based on the ALARA principle. Parameters of these recommendations are not inflexible rules nor are they to establish a legal standard of care [7]
Discussion
The ED of FDG PET/CT varied among different institutions in this survey. As the distribution of CT ED was broader than that of the FDG ED, we believe that the changes in the CT settings have a major impact on radiation reduction in FDG PET/CT. When a CT ED cut-off of 5 mSv was applied in our survey data, we found that there was an ultra-low-dose CT group (n = 18, 54.5%) and a low-dose CT group (n = 15). The CT setting protocols are summarized in Table 3. We did not evaluate the CT image qualities according to the different CT protocols in this survey. In addition, scans with additional CT dose reduction programs or tube potential of ≤ 120 kVp showed significantly lower total ED than scans without. The survey result suggests that low-dose (≤ 120 kVp) CT protocols are widely accepted in Korea by maintaining a balance between its low achievable radiation exposure and adequate image quality for attenuation correction and localization. There was significant difference in ED in the 55-kg groups between those with or without tube potential ≤ 120 kVp or additional CT dose reduction program. In terms of radiation exposure, we can assume that adults, especially those with lower body weight, may benefit more from additional CT dose reduction programs and tube potential ≤ 120 kVp. FDG ED differed between institutions, although the range was not extreme. The choice of X-ray tube potential also differed among institutions. Guidelines recommended low-dose CT protocols by using a tube potential 120 kVp with automatic current adjustment [2]. Based on this survey, there was only a few institutions adopted a higher tube potential, such as 140 kVp.
Various protocol options are available depending on the PET/CT scanner, the image quality required, and the clinical purpose of the study. Most guidelines recommend that the choice of CT settings should be decided by each institution. Although each recommending body mentions specific recommendations for CT settings in their literature are not inflexible [7], most institutions generally provide multiple PET/CT scanner models with varying upgrade statuses are available in these institutions, and their level of function can differ among them. Clinicians and nuclear physicians should consider procedures to prevent unnecessary radiation exposure and obtain optimal image quality for their clinical needs. Based on ALARA principle, we should set a particular PET/CT setting with considering radiation doses and the image quality necessary for the clinical purpose of the study. The recent recommendations for low-dose CT protocols of PET/CT can be helpful in the optimization of CT protocols based on the institution preference.
In CT portion, lowering the tube potential or tube current leads to an increase in noise that can decrease the image quality. There are different current settings with AEC controls for each manufacturer. For the example, GE uses the noise index setting and current range, while Siemens uses the reference milliampere; these settings can lower the radiation dose. More than half of the institutions which participated in this survey used ultra-low-dose CT protocols, with tube potential of 100–120 kVp, current ≤ 100 mA with AEC controls, or low current (≤ 60 mA, fixed for the entire body). In addition to control of acquisition parameters, recent scanners have specific reconstruction CT algorithms (GE, ASIR; Siemens, Safire) for improvement of image quality. It has been reported that these new iterative reconstruction techniques reduce radiation dose up to 30–50% compared with the conventional method (filtered back projection reconstruction) [19, 20]. Therefore, using scanners with new iterative reconstruction technique can lower radiation exposure to the patient. The recently installed scanners with this reconstruction technique [10] can also provide better PET imaging quality. In our survey, this technique provided lower CT ED in the 55-kg group.
The FDG ED also differed between institutions, although the range was not extreme. Interestingly, not only the CT ED but the FDG ED was also lower in scans with additional CT dose reduction protocol in all weight groups (Fig. 1). In addition, the FDG ED was also lower in scans with lower CT tube potential (≤ 120 kVp vs. 140 kVp). That means that even within the same body weight group, lower FDG injection dose was used in scans with tube potential ≤ 120 kVp than in scans with tube potential 140 kVp. There are two possible reasons for this. Some institutions use lower tube potential an effort to reduce the radiation dose from FDG injection as well. In addition, PET/CT scanners using lower tube potential are relatively newer, thus requiring less FDG injection dose for scanning.
The CT ED proportion of PET/CT in adult patients was 43.0% in our study. This was much lower than that in a recent report by Paiva et al. They reported that 78.2% of the PET/CT ED came from CT when using an FDG dosage of 3.33 MBq (0.09 mCi)/kg [21]. We believe this difference was achieved through the constant and unrelenting efforts by KSNM to reduce unnecessarily excessive CT doses in FDG PET/CT. However, even recently, they argued that the radiation exposure from FDG PET/CT was more than 20 mSv. This figure was two to three times higher than the value obtained from our survey results.
This study was carried out as one of the quality improvement projects of KSNM and aimed to conduct a DRL survey of FDG PET/CT data to inform our members of the current recommendation. A similar survey for whole-body PET/CT, instead of torso PET/CT, was completed in July 2015 in Korea [10]. Their data was obtained from 105 PET/CT scanners in 73 institutions (body weight 61.4 ± 11.4 kg). However, although their title was “whole-body PET/CT,” the scans surveyed in their study were in the “torso” scope (from the skull base to the upper thigh) which is the same with our study. In their study, the average FDG ED, CT ED, and total ED were 5.9 ± 1.5 mSv, 6.3 ± 3.1 mSv, and 12.2 mSv, respectively. Their subject body weights were smaller in compared with our present survey results; thus, those were lower FDG ED. However, in their results, it was found to be higher CT ED and total ED in compared with our study results. As the CT ED is highly affected by body size, a simple comparison of ED between studies without consideration of body weight subgroups is not appropriate. Our study also provides the information on EDs based on body weight as well as CTDIvol, DLP for the PET/CT, and CT dose, depending on CT acquisition, reconstruction protocols, and each body weight. We thus believe that our survey results support the optimal setting of low-dose PET/CT protocol in each institution. Some institutions have been conducting FDG PET/CT without optimizing the CT or FDG dosage, in spite of KSNM’s effort and recent technical updates in PET/CT systems. We believe that an accreditation program by peer review can be an effective policy for the quality improvement and radiation exposure control of PET/CT.
Our study has several limitations. First, we did not enroll all PET/CT centers in Korea. Although previous data from whole-body PET/CT survey that enrolled more centers already exists, they did not analyze the difference between different body weight groups. Therefore, we aimed to construct a radiation dose database in three different body weight groups with FDG PET/CT, which is mostly commonly performed in Korea. The recruitment of institutions was one of the greatest difficulties in this survey. Second, regarding the three institutions that had more than two PET/CT scanners, in some cases, we could obtain the data from only one scanner, which may have resulted in sampling bias.
The institutions had a chance to review their own PET/CT acquisition programs during the beginning of this survey. The DRL surveys play an essential role in the voluntary reduction of unnecessary radiation dose exposure by encouraging the review of data among peers. Planning and participating in this KSNM project itself can result in a positive effect on dose reduction for PET/CT and can provide information on the optimization of PET/CT protocols for quality improvement in KSNM.
Conclusion
The ED of torso FDG PET/CT varied in Korea. KSNM strives to promote the use of CT dose reduction programs and reduce FDG injected doses, with the goal of optimizing PET/CT DRL and reducing unnecessary radiation exposure. Using DRL and implementing current recommendations may decrease the ED for PET/CT.
Acknowledgments
This study was completed as one of the 2018 Quality Control Committee activities of the Korean Society of Nuclear Medicine (KSNM) with the cooperation of the Korean Society of Nuclear Medicine Technology (KSNMT).
We give special thanks to the members of the KSNMT for participating in this survey, Keun Bae Choe from Hanyang University Hospital, Kyung Jae Lee from Bundang National Seoul University Hospital, Gyoo Seul Shin from Gangdong Kyung Hee University Hospital, Min Ki Jung from Dong Kuk University Medical Center, Hoon Bin Lim from Daejin Medical Center, Hyo Sung Ryu from Kangbuk Samsung Hospital, and Soo Young Park from the Catholic University of Korea, Seoul St. Mary’s Hospital.
Authors’ Contribution
All authors contributed to the study conception and design. Material preparation, data collection, and analysis were performed by Ari Chong, Yong-il Kim, Kyoungjune Pak, Jae Sun Eo, Tae-Sung Kim, Ji Young Kim, Hyun Woo Kwon, Ki Pyo Nam, Hong Jae Lee, Ho-Young Lee, and Eun Seong Lee. The first draft of the manuscript was written by Ari Chong and Jung Mi Park. Jung Mi Park, Joon-Kee Yoon, Seong Min Kim, and Kyeong Min Kim commented on previous versions of the manuscript. All authors read and approved the final manuscript.
Compliance with Ethical Standards
Conflict of Interest
Ari Chong, Jung Mi Park, Kyoungjune Pak, Yong-il Kim, Hyun Woo Kwon, Eun Seong Lee, Ki Pyo Nam, Ho-Young Lee, Hong Jae Lee, Ik Dong Yoo, Jae Sun Eo, Ji Young Kim, Joon-Kee Yoon, Kyeong Min Kim, Seong Min Kim, and Tae-Sung Kim declare that they have no conflict of interest.
Ethics Approval
All procedures performed in studies involving human participants were in accordance with the ethical standards of the institutional and national research committee and with the 1964 Helsinki declaration and its later amendments or comparable ethical standards.
Informed Consent
The requirement to obtain informed consent was waived.
Footnotes
Publisher’s Note
Springer Nature remains neutral with regard to jurisdictional claims in published maps and institutional affiliations.
References
- 1.Radiological protection and safety in medicine A report of the International Commission on Radiological Protection. Ann ICRP. 1996;26:1–47. [PubMed] [Google Scholar]
- 2.International Atomic Energy Agency. Standard operating procedures for PET/CT: A practical approach for use in adult oncology, IAEA Human Health Series No. 26, IAEA, Vienna; 2013.
- 3.Quantitative Imaging Biomarkers Alliance. Quantitative FDG-PET technical committee. UPICT oncology FDG-PET CT protocol. http://qibawiki.rsna.org/index.php?title=FDG-PET_tech_ctte. Accessed 23 Nov 2014.
- 4.Alessio AM, Kinahan PE. CT protocol selection in PET-CT imaging. 2012. https://www.imagewisely.org/~/media/ImageWisely%20Files/NucMed/CT%20Protocol%20Selection%20in%20PETCT%20Imaging.pdf. Accessed 25 Oct 2019.
- 5.Boellaard R, Delgado-Bolton R, Oyen WJ, Giammarile F, Tatsch K, Eschner W, et al. FDG PET/CT: EANM procedure guidelines for tumour imaging: version 2.0. Eur J Nucl Med Mol Imaging. 2015;42:328–354. doi: 10.1007/s00259-014-2961-x. [DOI] [PMC free article] [PubMed] [Google Scholar]
- 6.Jafari M, Daus A. SU-E-I-89: applying image gently and image wisely in nuclear medicine. Med Phys. 2012;39:3645. doi: 10.1118/1.4734806. [DOI] [PubMed] [Google Scholar]
- 7.American College of Radiology. ACR-SPR practice parameter for performing FDG PET/CT in oncology. 2016. https://www.acr.org/-/media/ACR/Files/Practice-Parameters/FDG-PET-CT.pdf. Accessed 25 Oct 2019.
- 8.Song HC. Current global and Korean issues in radiation safety of nuclear medicine procedures. Ann ICRP. 2016;45:122–137. doi: 10.1177/0146645315624048. [DOI] [PubMed] [Google Scholar]
- 9.Boellaard R. The engagement of FDG PET/CT image quality and harmonized quantification: from competitive to complementary. Eur J Nucl Med Mol Imaging. 2016;43:1–4. doi: 10.1007/s00259-015-3182-7. [DOI] [PubMed] [Google Scholar]
- 10.Kwon HW, Kim JP, Lee HJ, Paeng JC, Lee JS, Cheon GJ, et al. Radiation dose from whole-body F-18 fluorodeoxyglucose positron emission tomography/computed tomography: nationwide survey in Korea. J Korean Med Sci. 2016;31(Suppl 1):S69–S74. doi: 10.3346/jkms.2016.31.S1.S69. [DOI] [PMC free article] [PubMed] [Google Scholar]
- 11.Rausch I, Bergmann H, Geist B, Schaffarich M, Hirtl A, Hacker M, et al. Variation of system performance, quality control standards and adherence to international FDG-PET/CT imaging guidelines. A national survey of PET/CT operations in Austria. Nuklearmedizin. 2014;53:242–248. doi: 10.3413/Nukmed-0665-14-05. [DOI] [PubMed] [Google Scholar]
- 12.International Commission on Radiological Protection, Committee I The evaluation of risks from radiation. Health Phys. 1966;12:239–302. [PubMed] [Google Scholar]
- 13.ICRP. 1990 recommendations of the International Commission on Radiological Protection. ICRP Publication 60. Ann ICRP. 2019;21:1-3. [PubMed]
- 14.European Commission Group of Advisers on the Ethical Implications of B. Report to the European Commission: ethical aspects of cloning techniques. Politics Life Sci. 1997;16:309–312. doi: 10.1017/S0730938400024886. [DOI] [PubMed] [Google Scholar]
- 15.McCollough CH. Diagnostic reference levels. In. 2010. https://www.imagewisely.org/-/media/Image-Wisely/Files/CT/IW-McCollough-Diagnostic-Reference-Levels.pdf. Accessed 02 Jan 2020.
- 16.ICRP. Radiation dose to patients from radiopharmaceuticals. Addendum 3 to ICRP Publication 53. ICRP Publication 106. Approved by the Commission in October 2007. Ann ICRP. 2008;38:1–197. [DOI] [PubMed]
- 17.Deak PD, Smal Y, Kalender WA. Multisection CT protocols: sex- and age-specific conversion factors used to determine effective dose from dose-length product. Radiology. 2010;257:158–166. doi: 10.1148/radiol.10100047. [DOI] [PubMed] [Google Scholar]
- 18.Saltybaeva N, Jafari ME, Hupfer M, Kalender WA. Estimates of effective dose for CT scans of the lower extremities. Radiology. 2014;273:153–159. doi: 10.1148/radiol.14132903. [DOI] [PubMed] [Google Scholar]
- 19.Martinsen AC, Saether HK, Hol PK, Olsen DR, Skaane P. Iterative reconstruction reduces abdominal CT dose. Eur J Radiol. 2012;81:1483–1487. doi: 10.1016/j.ejrad.2011.04.021. [DOI] [PubMed] [Google Scholar]
- 20.Pontana F, Duhamel A, Pagniez J, Flohr T, Faivre JB, Hachulla AL, et al. Chest computed tomography using iterative reconstruction vs filtered back projection (part 2): image quality of low-dose CT examinations in 80 patients. Eur Radiol. 2011;21:636–643. doi: 10.1007/s00330-010-1991-4. [DOI] [PubMed] [Google Scholar]
- 21.Paiva FG, do Carmo Santana P, Mourao AP. Evaluation of patient effective dose in a PET/CT test. Appl Radiat Isot. 2019;145:137–141. doi: 10.1016/j.apradiso.2018.12.024. [DOI] [PubMed] [Google Scholar]
- 22.Parisi MT, Bermo MS, Alessio AM, Sharp SE, Gelfand MJ, Shulkin BL. Optimization of pediatric PET/CT. Semin Nucl Med. 2017;47:258–274. doi: 10.1053/j.semnuclmed.2017.01.002. [DOI] [PubMed] [Google Scholar]