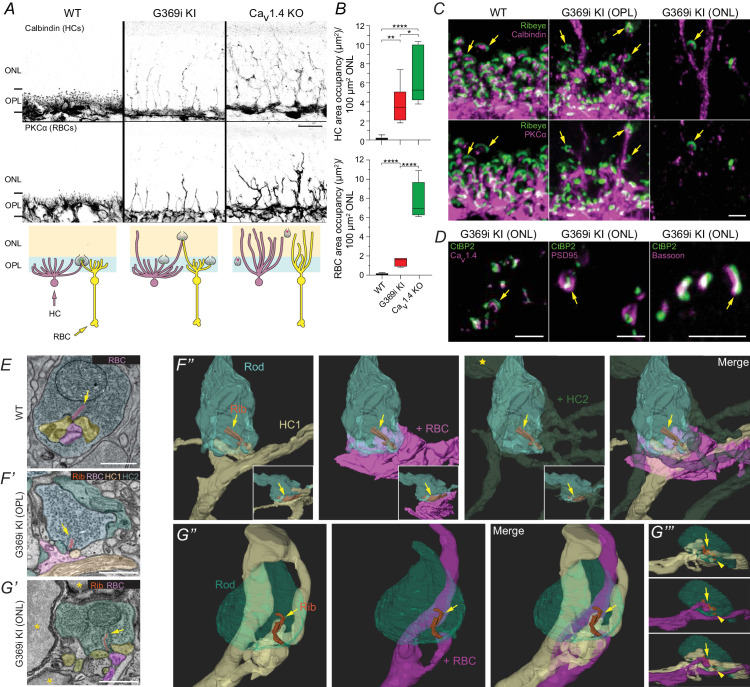
Figure 4. Rod synapses lack invaginating HC and RBC neurites in the absence of Cav1.4 Ca2+ signals.
(A), confocal micrographs of the ONL and OPL of WT, G369i KI and Cav1.4 KO retinas immunolabeled for calbindin and PKCα. The schematic below illustrates neurite sprouting in each genotype. (B), quantification of the area in the ONL occupied by HCs (calbindin) or RBCs (PKCα). One-way ANOVA with Fishers least significant difference post-hoc test. ****p<0.0001, **p<0.01, *p<0.05. n = 6 mice for each genotype. (C), confocal micrographs of the OPL of WT and the ONL and OPL of G369i KI retinas immunolabeled for Ribeye and Calbindin (upper panels) or PKCα (lower panels). (D), confocal micrographs of the ONL of G369i KI retinas that were immunolabeled for CtBP2 and Cav1.4 (left), PSD95 (middle) or Bassoon (right). (E), TEM image of a rod terminal in a WT retina. (F,G), serial block-face scanning electron microscopy images (F’,G’) and 3D reconstructions (F’’–G’’’) of rod terminals in a G369i KI retina. Rod terminals located within the OPL (F) and ONL (G). The yellow star F’’ indicates a neurite from HC2 sprouting into the ONL. Insets in F’’ are a rotated view. G’’’ is a side view of G’’. Arrows depict anchored ribbons. Arrowheads in G’’’ depict additional ribbon. Asterisks in G’ indicate rod somas. Scale bars, 10 μm in A, 2 μm in C-D, 1 μm in E,F’,G’. Rib, ribbon. RBC, rod bipolar cell. HC, horizontal cell.


