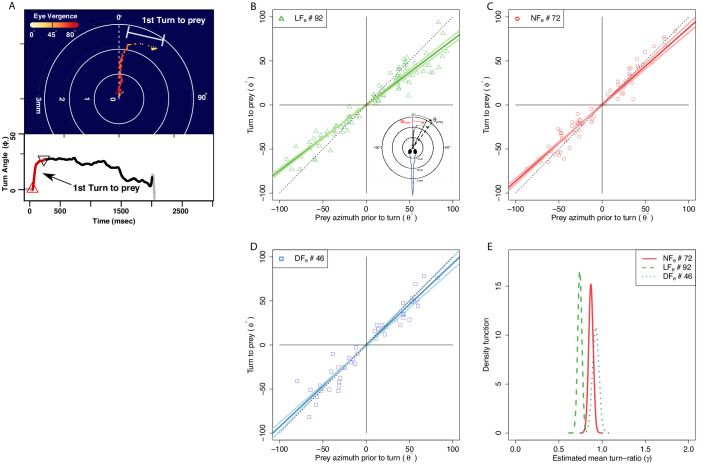
Figure 5. The angle of first turn-to-prey is experience-dependent.
(A) Hunting sequences begin with eye-vergence and a turn bout that re-orients larvae toward prey. We isolate the initial re-orientation toward prey as shown in an example hunting trajectory, which is drawn relative to the larva’s heading and mouth position (center), and color coded corresponding to eye-vergence. A large amplitude turn that re-orients it toward prey coincides with an increase in eye-vergence angle. Inset shows turning over time, with red highlighting the extracted first-turn behavior and light grey indicating post-capture turn. (B–D) Prey azimuth vs magnitude of re-orienting first-turn data points along with regression lines (dark), and 5–95% confidence intervals (light), according to a linear fit. Hunt events from the LF group show the highest deviation from dotted line, which indicate the slope of turn angles that would precisely align larvae with prey. (E) The inferred slope density from the linear statistical regression model reveals that the mean first-turn behavior (γ) of hunt events pooled from the LF group have a lower slope than NF (), and DF (), while DF shows the least undershooting (). The ranking in mean turn-ratios according to pooled data across individuals goes LF>NF>DF, but this can be biased toward more active individuals within each group, see Figure 7 where group behavior is estimated without this bias.


