Abstract
The self-control ability and self-control resources have a different influence on deception, but the cognition mechanism of this different influence has not been described yet. In this study, the event-related potentials (ERPs) technique was utilized to conduct two experiments exploring the effects of self-control ability and self-control resources on deception from two approaches. In Experiment 1, participants with different levels of self-control ability performed a visual perception task to measure deception and deception tendencies. The results revealed that individuals with low self-control ability exhibited more deceptive behaviors than did individuals with high self-control ability. Furthermore, individuals with high self-control ability evoked larger N2 and smaller P3 amplitudes than did individuals with low self-control ability. Experiment 2 involved selecting individuals with medium self-control ability. The Stroop task and a visual perception task were employed to investigate the influence of self-control resources on deception. The results showed that the depletion of self-control resources facilitated smaller N2 and larger P3 amplitudes than did non-depletion of self-control resources. In conclusion, these results suggest that individuals with high self-control ability are less likely to deceive others in order to obtain more benefits. When individuals have sufficient self-control resources, they resist temptation and reduce deception behaviors. Deception and deception tendencies may be more likely in people with low of self-control and whose self-control resources are depleted. In people with moderate self-control, deception was still regulated by self-depletion.
Keywords: deception, self-control ability, self-control resources, visual perception task, event-related potential
Introduction
Self-control is an ability that helps people maintain composure, facilitate cooperation, and restrain unnecessary inclination toward automatic behaviors. Moreover, self-control is considered a supervisory mechanism between internal biological impulses and external cultural requirements (Hofmann et al., 2009). Self-control, a vital motivator for deception recognition, can be widely applied in real life. For instance, self-control can be applied to individuals addicted to gambling or drugs because they are considered to indulge in deceptive behaviors (Christiansen et al., 2012). Research on the role of self-control in deceptive behaviors is extremely crucial (Fan et al., 2016). This is because even without any direct evidence proving that individuals with low self-control exhibit deceptive behaviors, they can be unfairly judged in scenarios such as criminal interrogations and trials. Research has indicated that exercising self-control requires using cognitive resources that may become temporarily exhausted, causing an individual to underperform in an irrelevant follow-up task involving exercising self-control (Shmueli & Prochaska, 2009). Schmeichel et al. (2015) claimed that processing negative emotional events rationally appears to consume and deplete self-regulatory resources, leaving individuals temporarily prone to self-control failure. Self-control ability and self-control resources are distinct concepts regarding self-control (Ren et al., 2018). Self-control ability is a trait, which remains stable over time and rarely changes with the surrounding environment, whereas self-control resources are variable, which change with the surrounding environment (Tangney et al., 2004). However, whether self-control ability and self-control resources differently influence the occurrence of deceitful behavior remains unclear.
Humans must maintain self-control to inhibit traits such as hedonism, selfishness, and vested interests; this inhibition enables a group to benefit by focusing more on long-term interests (Righetti & Finkenauer, 2011). Individuals with high self-control ability are more successful in restraining selfish motives and behaving prosocially compared with individuals with low self-control (Martinsson et al., 2012). In a cooperative environment, individuals may expect a greater benefit from cooperation if relatively high self-control is exercised. In addition, studies have revealed a series of positive behaviors related to the ability to master oneself. For instance, individuals with high self-control perform better (Duckworth & Kern, 2011) and exhibit fewer impulsive behaviors (Peluso et al., 1999) and more health-conscious behaviors (Kuijer et al., 2008) than do individuals with low self-control. Similarly, individuals with high self-control may be more trustworthy and behave more responsibly than those with low self-control. Furthermore, researchers have observed that individuals with high self-control score better on goal attainment than do those with low self-control (Tangney et al., 2004). Therefore, self-control is key in restraining impulsive behavior, satisfying external needs, and fulfilling long-term interests (Hofmann et al., 2009; Righetti & Finkenauer, 2011).
According to the theory of limited self-control resources, such resources are used when individuals practice intentional and deliberate self-control; consequently, such consumption may reduce the quality of intentional and deliberate self-control behaviors as the individual enters the ego-depletion state (Muraven & Baumeister, 2000). Baumeister et al. (1998) proposed the ego-depletion model suggesting that self-control could enable individuals to refrain from instantaneous inappropriate responses and select more appropriate responses. When more cognitive resources are used in a certain activity, the cognitive resources used for self-control may be lowered, potentially leading to a decline or depletion of self-control (Baumeister et al., 1998). Recent research has indicated that individuals are more likely to behave unethically at night after working the entire morning, when a substantial amount of self-control resources have already been consumed (Gunia et al., 2014; Kouchaki & Smith, 2014; Roeser et al., 2016). Selfish deception may be more likely when individuals are in the state of ego depletion (Gino et al., 2011). For example, when an individual is in a state of ego-depletion and has less control over their egoistic impulses, they are more likely to emerge (Mead et al., 2009). Exposure to monetary rewards may result in failure of self-control and more unethical intentions and behaviors (Vohs, 2015). Studies have indicated that compared with those who are not experiencing egodepletion, participants experiencing ego-depletion are more prone to select previous answer cards, but are less resistant to temptation and more likely to indulge in deceptive behaviors (Gino et al., 2011).
Exploring the cognitive mechanism of self-control provides insights into ways in which individuals adjust and control their thoughts, behaviors, and emotions. Studies have noted that effective self-control depends on the activation level of the prefrontal cortex (PFC, Hofmann et al., 2009). The N2 and P3 are endogenous amplitudes of event-related potentials (ERPs) related to people’s perceptual or cognitive-psychological processes and cognitive control. The activation of these amplitudes depends on the psychological state and cognitive efforts induced through tasks, instructions, or experimental settings. The N2 and P3 amplitudes in the cognitive control paradigm have been a topic of research interest. The N2 amplitude typically peaks approximately 200 ms after stimulus onset and is mainly distributed in the central region of the forehead. The amplitude of this component is linked to cognitive control and response adjustment consistent with the target. In the reaction inhibition task, the more negative the N2 amplitude, the greater the degree of cognitive monitoring required by the response; the individual perceives the reaction buttons and adjusts the response strategy to suppress the response not fit with the target (Folstein & Van Petten, 2008). In addition, evidence from ERP studies supports the mandatory involvement of cognitive control processes in deception. Furthermore, some studies have indicated that compared with honesty responses, more negative N2 components are induced by hiding behaviors, deceiving self-preferences, and concealing of true memories (Johnson et al., 2008; Johnson et al., 2004; Tu et al., 2009; Wu et al., 2009).
A prominent ERP is the parietal P3 amplitude, which typically occurs between 300 and 800 ms post-stimulus and which has been related to different psychological concepts (Beauducel et al., 2006; Mecklinger et al., 2010). Results of several studies (Ambach et al., 2010; Gamer & Berti, 2010) indicate that larger P3 amplitudes occur for deceptive responses, which have been related to the salience of deceptive stimuli. Leue et al. (2012) found individual differences in a deception task for the early P3 amplitude and for the late P3 amplitude, suggesting that both amplitudes are relevant during deception. Therefore, the aim of the present study was to further explore the impact of unusual self-control on the P3 effect in the deception task. Deception requires more executive control than honesty, and an ERP study found that P3 amplitude will decrease when the demand for executive control increases (Debey et al., 2012). Meanwhile, ego depletion limits executive control (Debey et al., 2012). Therefore, we hypothesized that the P3 amplitude will increase when people are in the ego depletion state. In a word, deception is related to cognitive control. Self-control requires executive control, and ego depletion can weaken executive control. Therefore, ego depletion can produce more deceptive behaviors and induce a larger P3 amplitude. The P3 amplitude takes into account the meaning of information and P3 is the main indicator of lie detection (Chen et al., 2011). Accordingly, the current study explored whether the influence of self-control ability or self-control resources on deception can induce the N2 and P3 amplitudes.
People with high self-control sometimes behave unethically. Is it possible that the failure of self-control is due to ego-depletion? Past results of a behavioral experiment concerning the influence of self-control ability on deception indicate that individuals with high self-control ability can better control selfish motivation and consider long-term interests (Fan et al., 2016). The current study, a continuation of our previous research (Fan et al., 2016), explored the influence of self-control resources on deception and sought to determine whether the results are consistent with of the results for self-control ability. The research question posed was whether people with high self-control actively suppress selfish motives and reduce profit-oriented deceptive behavior. Accordingly, the current study improves our understanding of how self-control inhibits impulsive behavior, exploring the neural basis of the self-control regulatory mechanism. In line with previous studies, we assumed that self-control ability plays a role as a regulatory mechanism and that people with high self-control exhibit fewer deceptive behaviors than those with low self-control. The cognitive mechanism and the neural basis of the self-control regulatory mechanism in the process of deception remain unclear. Self-control ability and self-control resources influence deception differently; however, the neural basis of these effects is not yet clear. The question we posed was whether self-control ability and self-control resources influence the occurrence of deception directly or indirectly. To answer this question, we used ERPs to examine the impact of self-control on deception and its neural basis. The research hypotheses were as follows: (a) individuals with low self-control will be more likely to engage in deceptive behaviors compared with individuals with high self-control; (b) indi-viduals who have exhausted their self-control resources will exhibit a stronger tendency to engage in deceptive behaviors compared with individuals who have not exhausted their self-control resources. The visual perception task is the most widely used experiment paradigm in studies of deception behavior (Kouchaki & Smith, 2014) because it can not only determine deception tendency, bur also identify deception. Kouchaki and Smith (2014) interpret self-interest bias in this task as a condition where the participants indicate more dots on the right side in an ambiguous condition. In contrast, we interpret this as the deceptive tendency.
Experiment 1: Traits of Deceptive Behavior in Individuals with Different Levels of Self-Control Ability
Research Method
Participants. The Ethics Committee of the Institute of Psychology, Hunan Normal University granted ethical approval for the experimental procedure. By using a self-control scale administered to 300 undergraduates (Tangney et al., 2004), we selected the top 10% of the undergraduates exhibiting high self-control ability (30 undergraduates: 50% women, 50% men) and 10% of the undergraduates exhibiting low self-control ability (30 undergraduates: 50% women, 50% men). By using G*Power (version 3.1; Faul et al., 2009), we calculated a sample size of 26 for a small-to-large effect size of |p| = .5, a significance level of α = .05, and a power of 0.8 (within-subject design, two-tailed). However, we aimed to recruit as large a sample as we could to maximize the statistical power, totaling 60 participants (Mage = 18.8±0.75 years). All participants were right-handed, were healthy without neurological diseases, had no history of brain injury, and possessed normal or corrected to normal vision. The participants signed their informed consent for the experiment and were given appropriate remuneration after the experiment. The scores of all 60 participants in each dimension are presented subsequently.
Experimental design. The experiment used a single-factor, between-subject design. The independent variable was the level of self-control ability (low vs. high), the dependent variables were the results of behavior (the number of deceptions and the extent of the tendency to deceive) and the ERP results (N1, P2, N2 and P3 amplitudes).
Experimental materials and procedure. All participants completed experiments in separate small rooms; the instructions and experimental procedures were presented on computers. The visual perception task examined the participants’ deceptive behavior (Kouchaki & Smith, 2014). In the visual perception task, the participants were shown 200 squares with red dots. Each square was divided into a right half and a left half by a diagonal line, and 20 red dots were unevenly distributed on both sides of the diagonal line. The participants were required to decide which half contained more red dots. The participants received ¥0.2 and ¥0.01 when they indicated more red dots on the right and left side, respectively. Finally, the reward was calculated according to the number of judgments instead of the number of correct judgments. For every 100 trials, 25 instances of having more red dots on the left side occurred. The test results indicated deception if the number of red dots on the right was greater. There were 25 instances of clearly having more red dots on the right side. The participants were considered to be honest if the number of red dots on the right side was greater. In the other 50 trials, the numbers of red dots on the left and right sides were almost equal. If the participants judged that the right side contained more red dots, the results were considered to indicate a deceptive tendency.
In the formal experiment, a cross was first presented at the center of the screen for 300 ms. The 300 ms fixation point was to remind the participants to be ready to start the experiment. Next, an empty screen of 800 to 1200 ms was shown, and then the participants responded to the target stimulus with a key press within 500 ms. There were three kinds of target stimuli. The last was an empty screen of 1 s. This was a trial process. If the participants observed more red dots on the left side, they were to press the “F” key; if they observed more red dots on the right side, then they were to press the “J” key. After a practice session in the experimental environment, the formal experiment of 200 trials begun.
Figure 1.
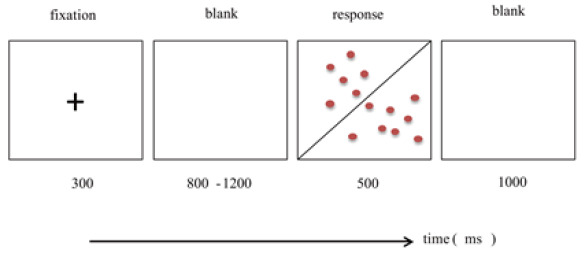
Schematic representation of the visual perception task in Experiment 1. The red frame records the subject's EEG response.
Electroencephalography recording. Online recording was performed using the NeuroScan ERP recording and analysis system, which recorded electroencephalography (EEG) at a 64-electrode cap extended by the International 10–20 system. When recording online, the reference electrode was placed at the position of the left mastoid. When offline, the bilateral mastoid was used as the reference electrode. The external electrode was placed on the outside of the eyes to record the horizontal electrooculogram, and the upper and lower electrodes were placed on the left eye to record the vertical electrooculogram (VEOG). The filter bandpass was 0.05–70 Hz, the sampling frequency was 500 Hz/conductance, and the scalp impedance was <5 KΩ. After continual EEG recording was completed, the data were processed offline and NeuroScan was used to correct the VEOG and sufficiently discharged other artifacts. Amplitudes greater than ±80μV were automatically rejected as artifacts. The time course (epoch) analysis was 1 s after the stimulation, and the baseline was 200 ms before the stimulation.
In the offline analysis, the EEGLab software was used to convert the data from the unilateral mastoid recording to the bilateral mastoid, and the filtering parameter was 0.1–30 Hz. Independent component analysis was used to eliminate blinks and motion artifacts. Simultaneously, we examined the entire EEG data and eliminated high-noise trials such as larger EMG, blinking, and ECG artifacts. The rejection of extreme values was ±80 μV. The segmentation time was 200 ms before the occurrence of the target stimulus and 1 s after the occurrence of the stimulus. The baseline correction was performed for the data of −200 to 0 ms. Based on the existing research (Suchotzki et al., 2015; Yeung et al., 2005) and the purpose of this study, 15 electrode positions (F3, FC3, C3, CP3, P3, Fz, FCz, Cz, CPz, Pz, F4, FC4, C4, CP4, and P4) were selected. Statistical analysis included the average amplitude of N1 (170–210 ms), P2 (240–280 ms), N2 (280–320 ms), and P300 (380–480 ms). Accordingly, the average amplitude of the ERP components was analyzed through three-factor repeated-measures analysis of variance (ANOVA). Each factor was set as 2 (the high self-control ability vs. the low self-control ability group) × 3 [hemisphere: left side (F3, FC3, C3, CP3, P3), midline (Fz, FCz, Cz, CPz, Pz), right (F4, FC4, C4, CP4, P4)] × electrodes location: [frontal area (F3, Fz, F4), frontal–central FC3, FCz, FC4), central (C3, Cz, C4), central–parietal (F3, Fz, F4), parietal sites (P3, Pz, P4)]. The degrees of freedom of the F-ratios were corrected by using the Greenhouse–Geisser method.
Results
Self-control scale. The self-control scale revised by Shu-Hua (2008), including impulsive control, healthy habits, resistance to temptation and focus on work, comprised 19 items. A 5-point Likert scale was used, ranging from 1 = very inconsistent to 5 = very consistent. Fifteen items were scored in reverse, and the total score was added after the reverse scores were recalculated. The higher the total score, the better a given individual’s self-control ability. According to an independent-samples t-test, the scores on self-control ability significantly differed between the two groups, t(58) = 82, p < .01. Compared with participants with low self-control ability, those with high self-control ability had higher scores (see Table 1).
Behavioral results. The independent-samples t-test revealed that the main effect of self-control ability was nonsignificant in determining the number of deceptions, t(58) = −1.71, p = .87. Participants with high self-control ability (M = 29.05, SD = 6.97) were not significantly different from those with low self-control ability (M = 29.47, SD = 7.67). Regarding the number of deception tendencies, the main effect of self-control was significant, t(58) = 2.81, p = .01, 95% CI = [−5.38, 4.54], d = 0.86. Compared with participants with low self-control ability (M = 44.47, SD = 7.78), those with high self-control ability (M = 37, SD = 8.18) exhibited lower deceptive tendency, as illustrated in Figure 2.
ERP results. For participants’ deception tendencies, the ERP waveform generated by C3, CP3, CPZ, and PZ are illustrated in Figure 3.
N1 (170–210 ms). A repeated-measures ANOVA revealed that the main effect of self-control ability was nonsignificant, F(1, 58) = .05, p = .83. No significant main effect of hemisphere was observed, F(2, 116) = 1.47, p = .24. A significant main effect of electrode location was observed, F(4, 232) = 21.79, p < .001, ηp2 = .40. Post hoc multiple comparisons revealed that parietal sites elicited larger N1 mean amplitudes than other regions (all ps < .01). In addition, other interactions were nonsignificant (all ps> .11, see Figure 3, left).
Table 1.
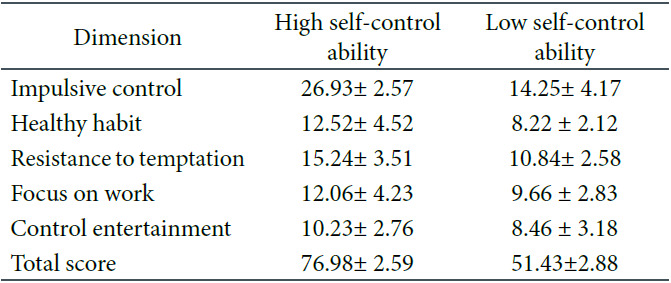
Scores on the Self-Control Scale
P2 (240–280 ms). A repeated-measures ANOVA revealed that the main effect of self-control ability was nonsignificant. F(1, 58) = .85, p = .37. A significant main effect of electrodes location was observed, F(4, 232) = 6.96, p < .001, ηp2 = .17. Post hoc multiple comparisons revealed that the frontal region elicited larger N2 mean amplitudes than the frontal–central region (ps = .05) and smaller N2 mean amplitudes than the parietal sites (p = .01). Compared with the frontal–central region, larger N2 amplitudes were elicited in the central–parietal and parietal sites (ps < .01). The N2 amplitudes in the central and central–parietal region were significantly smaller than those in the parietal sites (p < .001). A significant main effect of hemisphere was observed, F(2,116) = 11.3, p < .001, ηp2 = .25. Post hoc multiple comparisons revealed that midline laterality elicited lager N2 mean amplitudes than did left laterality (p < .01) and smaller N2 mean amplitude than did right laterality (p < .01). In addition, other interactions were nonsignificant (all ps > .11, see Figure 3, right).
N2 (280–232 ms). A repeated-measures ANOVA revealed that the main effect of self-control ability was significant, F(1, 58) = 7.17, p = .01, ηp2 = .17. The group with high self-control ability exhibited larger N2 amplitudes compared with the group with low self-control ability (see Figure 4). A significant main effect of electrode location was observed, F(4, 232) = 3.25, p = .01, ηp2 = .09. Post hoc multiple comparisons revealed that the frontal region elicited larger P2 mean amplitude than frontal–central region (all ps = .003). Compared with the frontal–central, central, and central–parietal regions, larger P2 amplitudes were elicited in the parietal sites (all ps < .05). A significant main effect of hemisphere was observed, F(2, 116) = 5.34, p = .01, ηp2 = .14. Post hoc multiple comparisons revealed that midline laterality elicited smaller P2 mean amplitude than left and right laterality (p < .01). In addition, other interactions were nonsignificant (all ps> .11).
P3 (380–480 ms). A repeated-measures ANOVA revealed that the main effect of self-control ability was significant, F(1, 58) = 4.91, p = .03, ηp2 = .13. Participants with high self-control ability induced a smaller amplitude on P3 compared with the group with low self-control ability. No significant main effect of electrodes location was observed: F(4, 232) = 1.32, p = .27. A significant main effect of hemisphere was observed, F(2, 116) = 5.28, p = .01, ηp2 = .14. Post hoc multiple comparisons revealed that the right laterality elicited larger P3 mean amplitude than left laterality (all ps < .01). In addition, other interactions were nonsignificant (all ps > .11, see Figure 5).
Correlational analyses between behavior and ERPs data. We found that the two groups not only had significant differences in behavioral results, but also significant differences in N2 and P3 amplitudes. Next, Pearson correlation was used to explore the relationship between behavioral results and ERP results. The correlation analysis showed that deception tendencies of the low self-control ability were significantly and positives correlated with the P3 (r =.52, p = .03) and that deception tendencies of the high self-control ability were not statistically significant and negatively correlated with the N2 (r = −.41, p =.09, see Figure 6).
Figure 2.
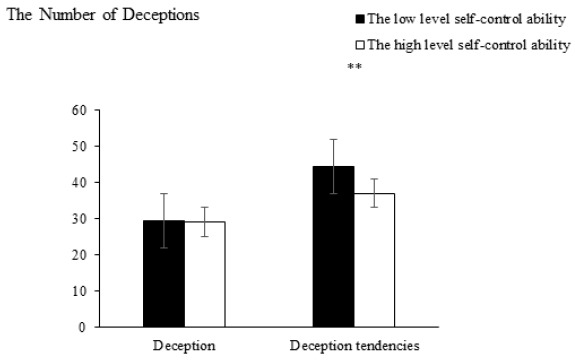
Comparison of the resulting deception and deception tendencies. ** p < .01.
Figure 3.
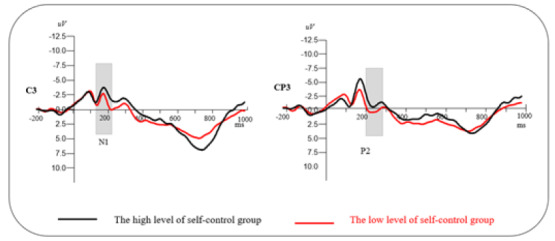
The total average of ERPs induced on C3 and CP3 (left = N1; right = P2).
Figure 4.
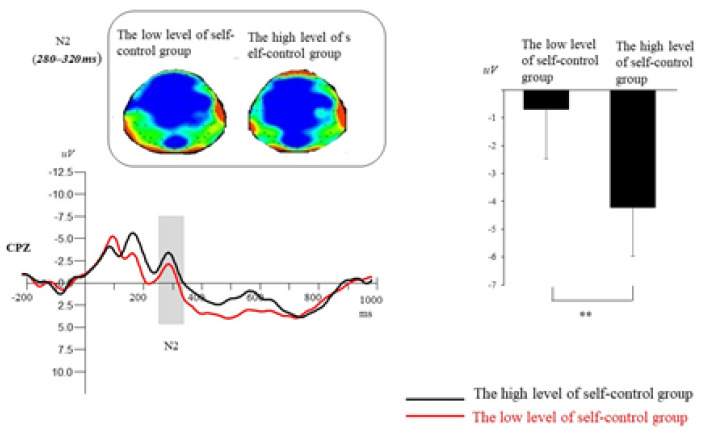
The ERP total average map, brain topographic map, and N2(280~320ms) amplitude average value of all analysis points of N2 with different deception tendency on Cpz electrode points of two groups of participants. **p < .001.
Figure 5.
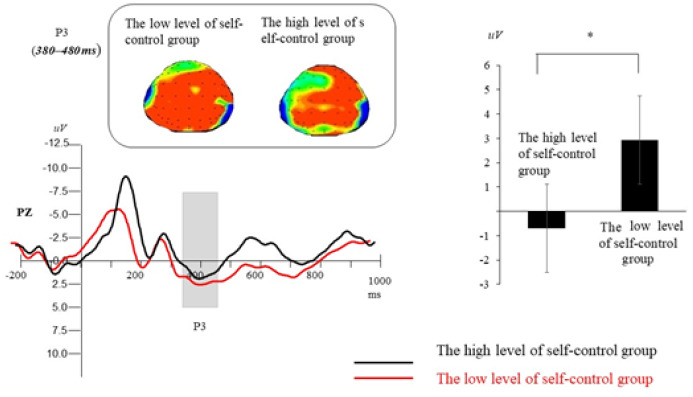
The ERP total average map, brain topographic map, and P3 (380~480ms) amplitude average value of all analysis points of P3 with different deception tendency on Pz electrode points of two groups of participants.*p < .05.
Figure 6.
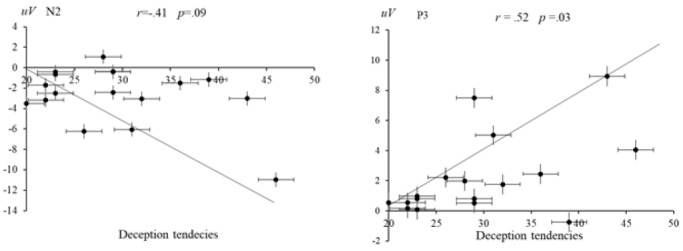
Left: The correlation between N2 and deception tendencies of the high self-control ability group. Right: The correlation between P3 and deception tendencies of the low self-control ability group.
Discussion
The experiment revealed no significant differences in the N1 amplitude in the two groups when they exhibited a deceptive tendency. This was probably because the participants with different levels of self-control ability had just received the information stimulus at that time and had not begun to engage in deception.
After the stimulus was presented, the apparent components of P2 were observed. On the P2 amplitude, the main effect of self-control ability was nonsignificant and no difference was observed between the two groups. Studies have revealed that P2 components may indicate a rapid detection of stimuli features (Thorpe et al., 1996) because the two groups of participants received the same stimulus. Accordingly, no difference was observed at this time. This result indicated that the experimental materials in this study were suitable and that the effects on different participants were physically similar.
The experiment also indicated a more apparent N2 component as N2 is generally considered a nonspecific component associated with the conversion mechanism of attention (Kiehl et al., 2001). The main effect of self-control ability on the N2 amplitude was notable. Participants with high self-control ability produced a larger N2 than did those with low self-control ability. This finding is similar to that reported previously (Martin & Potts, 2009). Martin and Potts (2009) observed that for less impulsive individuals, the low-risk decision-making option was the default choice. The participants with high self-control may have been better at controlling themselves; accordingly, choosing deception to obtain greater rewards required more cognitive processing, thereby inducing a greater N2 amplitude (Martin & Potts, 2009). Through cor-relation analysis, we found that there was no significant correlation between deception tendency of high self-control ability and N2. This study shows that N2 component does not constitute evidence of deception tendencies (Tang et al., 2019).
P3 is considered the orientation response of the human brain to central control processing in the later stage (Campanella et al., 2004). The current study, participants with high self-control ability produced a smaller P3 amplitude than did those with low self-control ability. This finding was similar to that of previous studies. A prior study observed that individuals with high self-control ability tended to choose low-risk options (Bechara et al., 2003). Other research findings revealed that P3 is critically activated from the low-risk selection when less impulsive individuals make high-risk choices (Martin & Potts, 2009). Furthermore, participants with low self-control were more prone to self-deception when facing the temptation of a reward (Fan et al., 2016). The priority choice for less impulsive individuals was the low-risk option. The results of the current experiment illustrated that the instinctive reaction of individuals with high self-control is to be honest when facing a scenario with the option to be deceptive. The scenario in this experiment aimed to induce a greater deceptive tendency to obtain greater rewards. This was not the priority of individuals with high self-control, resulting in a smaller P3 when they performed less processing. Through correlation analysis, we found that there was a significant correlation between P3 and deception tendencies of the low self-control ability. Such research could prove that the P3 component is evidence of deception tendencies (Ding et al., 2014).
Experiment 2: Influence of the Depletion of Self-Control Resources on Deception
Research Methods
Participants. The Ethics Committee of the Institute of Psychology, Hunan Normal University granted ethical approval for the experimental procedure. By using G*Power (version 3.1; Faul et al., 2009), we calculated a sample size of 26 for a small-to-large effect size of |p| = .5, a significance level of α = .05, and a power of 0.8 (within-subject design, two-tailed). However, we sought to recruit as large a sample as we could in order to maximize the statistical power. With the administration of a self-control scale and the elimination of extreme data points (the high and low self-control ability), 70 participants (Mage = 19.8 ± 0.25 years) with moderate self-control ability were selected and randomly divided into two groups. There were 35 individuals in the experimental group (17 women and 18 men) and 35 individuals in the control group (18 women and 17 men). All participants were right-handed and healthy without neurological diseases, had no history of brain injury, and possessed normal or corrected-to-normal vision. They signed their informed consent to the experiment and were given appropriate remuneration after the experiment.
Figure 7.
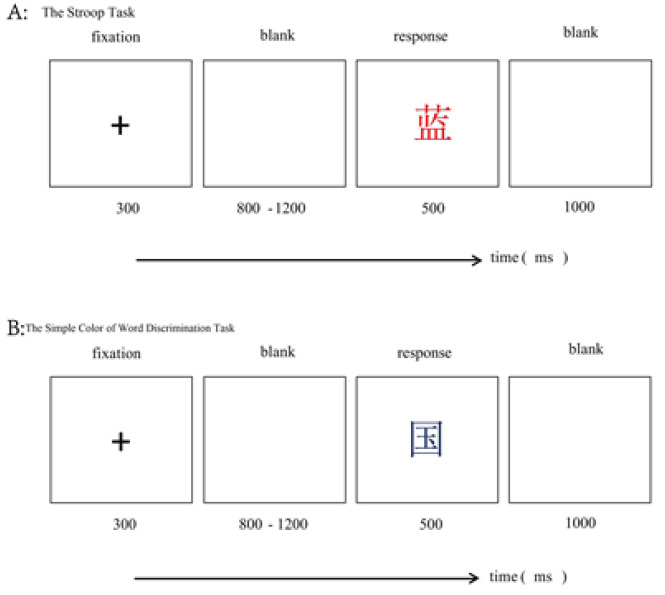
Left: The correlation between N2 and deception tendencies of the high self-control ability group. Right: The correlation between P3 and deception tendencies of the low self-control ability group.
Experimental design. The experiment used a single-factor, between-subject design. The independent variable was the level of self-control resources depletion (depletion vs. non-depletion). The dependent variables were the behavioral results (the number of deceptions and deception tendencies) and the ERP results (N1, P2, N2, and P3 amplitudes).
Experimental materials and procedures. All participants completed experiments in separate small rooms. The instructions and experimental procedures were presented on computers. The participants were randomly assigned to two groups. Half of the participants were allocated to the self-control resources depletion group, and the other half were allo-cated to the self-control resources nondepletion group. Before the start of the formal experiment, the participants in the experimental group had to complete a 15-minute Stroop color discrimination task (Neshat-Doost et al., 2008). In the Stroop task, the participants needed to distinguish the word “red” written in a red-color font, the word “blue” written in a red-color font, the word “blue” written in a blue-color font, and the word “red” written in a red-colored font (see Figure 7, Panel A). The control group only needed to complete a simple word recognition task (for a noncolor noun; Figure 7, Panel B). Thereafter, the operation test was performed to examine the status of self-control resources among different participants. The operation test involved a subjective assessment of the Stroop task difficulty. A 7-point Likert scale was used, (from 1 = very easy to 7 = very difficult) and the assessment of the degree of effort needed (from 1 = did not have to work hard to 7 = needed to apply a significant effort). Afterwards, the participants performed the visual perception task (experimental materials and procedures were the same as in Experiment 1) which was the formal experiment of deceptive behavior (see Figure 7, Panels A and B).
EEG recording. The EEG recording process was identical to that in Experiment 1.
EEG data processing and statistics. The ERP data processing and statistics were identical to that in Experiment 1.
Table 2.
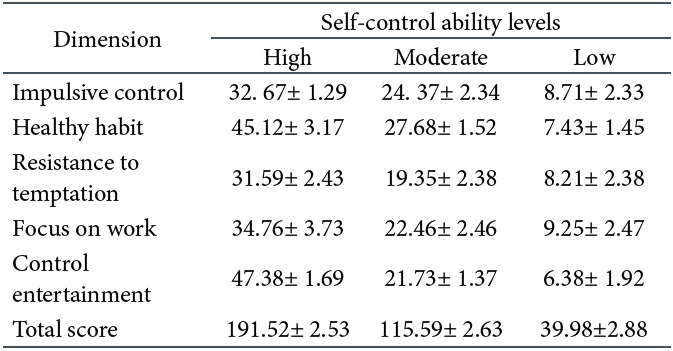
Scores on the Self-Control Scale
Results
Descriptive results of the Stroop task. In the subjective assessment of task difficulty, an independent-samples t-test revealed that the difference between the two groups was significant, t(68) = 1.69, p = .04. Compared with the nondepleted self-control resources of group, the depleted self-control resources group considered the task to be more difficult. In the subjective assessment of the degree of effort, the independent-samples t-test revealed that the difference between the two groups was significant, t(68) = 1.45, p = .03. Compared with the nondepleted self-control resources group, the depletion resource of self-control group incurred more efforts to perform the task. In summary, significant differences were observed between the two groups in the Stroop task.
Self-control scale. In Experiment 2, the self-control ability scale was used to screen the participants with medium self-control ability (Shu-Hua, 2008). The results of a one-way ANOVA showed that there were significant differences in participant scores on the scale, F(2,207) = 12.86, p = .02,ηp2 = .16. Post hoc multiple comparisons revealed that there were significant differences between the three groups, ps < .05. Following the aim of the current study, only participants with moderate self-control ability were selected for the next test (see Table 2).
Figure 8.
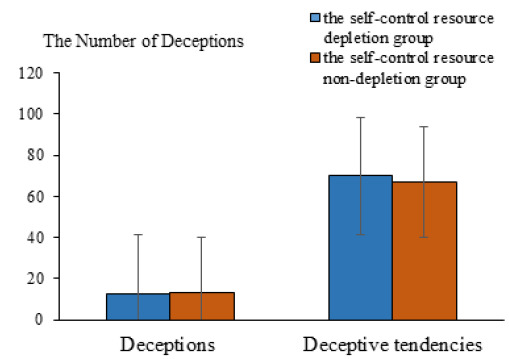
Deception and deception tendencies in each group.
Behavioral results. The independent-samples t-test revealed that the main effect of self-control resources on the number of deceptions was not statistically significant, t(68) = .95, p > .05. No significant difference was observed between the depleted self-control resources group (M = 12.82, SD = 3.41) and the nondepleted self-control resources group (M = 13.18, SD = 2.18). In terms of deception tendencies, the main effect of self-control resources was not statistically significant, t(68) = .59, p > .05. No significant difference was observed between the depleted self-control resource group (M = 69.94, SD = 14.54) and the nondepleted self-control resources group (M = 66.76, SD = 19.68, see Figure 8).
ERP results. For the participants’ deceptive tendencies, the ERP waveforms generated by CP3, P3, CPZ, and PZ are illustrated in Figure 9.
N1 (90–130 ms). A repeated-measures ANOVA revealed that the main effect of self-control resources was not statistically significant, F(1, 68) = .31, p = .59. No significant difference was observed between the depleted self-control resources group and the nondepleted self-control resources group on N1. A significant main effect of electrode location was observed, F(4, 272) = 32.80, p < .001, ηp2 = .50. Post hoc multiple comparisons revealed that the parietal sites elicited larger N1 mean amplitudes than did other regions (all ps< .001). The central–parietal region elicited larger N1 mean amplitudes than did other frontal, frontal–central, and central regions (all ps < .001). The frontal region elicited larger N1 mean amplitudes than the frontal–central region (all ps < .001). A significant main effect of hemisphere was observed, F(2, 136) = 23.43, p < .001,ηp2 = .42. Post hoc multiple comparisons revealed that the midline elicited larger N1 mean amplitudes than left and right laterality (all ps < .01). Other interactions were not statistically significant (all ps > .11, see Figure 9).
P2 (160–240 ms). A repeated-measures ANOVA indicated that the main effect of self-control resources was not statistically significant, F(1, 68) = .95, p > .05. No significant difference was observed between the depleted self-control resources group and the nondepleted self-control resources group on the P2. A significant main effect of electrode location was observed, F(4, 272) = 19.41, p < .001, ηp2 = .37. Post hoc multiple comparisons revealed that parietal sites elicited larger N2 mean amplitudes than other regions (all ps < .001). The central–parietal region elicited larger N2 mean amplitudes than the frontal, frontal–central, and central regions (all ps < .001). The central region elicited larger N2 mean amplitudes than the frontal and frontal–central regions (all ps< .01). A significant main effect of hemisphere was observed, F(2, 136) = 15.40, p < .001, ηp2 = .32. Post hoc multiple comparisons revealed that the right laterality elicited lager N2 mean amplitudes than left and the midline laterality (all ps < .01). Other interactions were not statistically significant (all ps> .11, See Figure 9).
N2 (260–340 ms). A repeated-measures ANOVA revealed that the main effect of self-control resources was marginally significant, F(1, 68) = 3.78, p = .06. The depleted self-control resources group exhibited a smaller N2 amplitude compared with the nondepleted self-control resource group (see Figure 10). A significant main effect of electrode location was observed, F(4, 272) = 18.78, p < .001, ηp2 = .36. Post hoc multiple comparisons revealed that the frontal region elicited larger P2 mean amplitudes than other regions (all ps < .001). Compared with the central, central–parietal, and parietal regions, larger P2 amplitudes were elicited in the frontal–central region (all ps < .001). Compared with the central region, smaller P2 amplitudes were elicited in the central–parietal and parietal regions (all ps < .001). Compared with the parietal region, larger P2 amplitudes were elicited in the central–parietal and parietal regions (p = .014). A significant main effect of hemisphere was observed, F(2, 136) = 1.58, p = .23,ηp2 = .05. In addition, other interactions were nonsignificant (all ps> .11).
Figure 9.
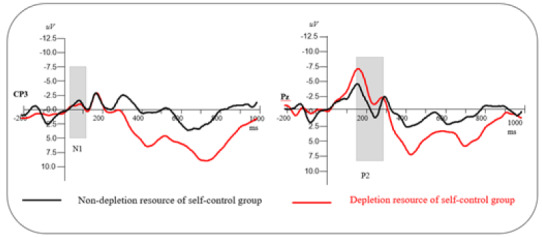
The total average of ERPs generated on Cp3 and Pz.
Figure 10.
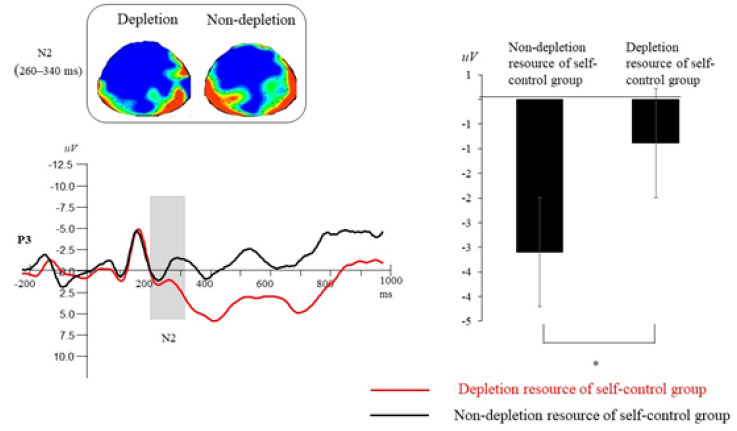
The ERP total average map, brain topographic map, and N2 (260~340ms) amplitude average value of all analysis points of N2 with different deception tendencies on P3 electrode points of two groups of participants. * p <.05.
Figure 11.
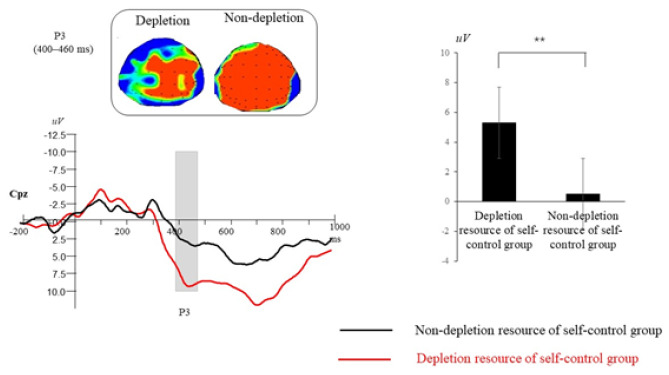
The ERP total average map, brain topographic map, and P3 (400~460ms) amplitude average value of all analysis points of P3 with different deception tendencies on Cpz electrode points of two groups of participants.
P3 (400–460 ms). A repeated-measures ANOVA revealed that the main effect of self-control resources was marginally significant, F(1,68) = 7.78, p = .01, ηp2 = .19. Compared with the nondepleted self-control resources group, the depleted self-control resources group exhibited a larger P3 amplitude (see Figure 11). A significant main effect of electrode location was observed, F(4, 272) = 14.41, p < .001, ηp2 = .30. Post hoc multiple comparisons revealed that the parietal region elicited larger P3 mean amplitudes than the frontal region (all ps < .001). Compared with the central–parietal region, smaller P3 amplitudes were elicited in the frontal and frontal–central regions (all ps < .001). Compared with the central region, smaller P3 amplitudes were elicited in the frontal and frontal–central regions (all ps < .001). Compared with the frontal region, larger P3 amplitudes were elicited in the frontal–central region (p < .001). A significant main effect of hemisphere was observed, F(2, 136) = 19.38, p < .001,ηp2 = .37. Post hoc multiple comparisons revealed that the midline laterality elicited smaller P3 mean amplitudes than the left and the right laterality (p < .001). Other interactions were nonsignificant (all ps > .11).
Correlational analyses between behavioral and ERP data. We found that the two groups only had significant differences in the N2 and the P3 amplitude. Next, we used Pearson correlation to explore the relationship between behavioral results and ERP results. The results showed that deception tendencies of the depleted self-control resources group were not correlated with the N2 to a statistically significant degree (r = .30, p = .23). However, deception tendencies of the depleted self-control resources group were significantly and positively correlated with the P3 (r = .69, p = .01, see Figure 12).
Discussion
A more apparent N2 component was also observed in this experiment. The main effect of self-control resources on the N2 amplitude was significant. Participants in the experimental group produced a larger N2 compared with participants in the control group. This finding in line with those reported previously (Barnes et al., 2011; Christian & Ellis, 2011; Gino et al., 2011). Individuals in the experimental group were more likely to exhibit selfish and egoistic impulses (Christian & Ellis, 2011; Gino et al., 2011). The P3 is typically associated with elaborative processing in the brain at later stages. In this study, like in previous studies, the participants in the experimental group exhibited a larger P3 than did those in the control group. When an individual was in the state of ego depletion, they were more likely to produce an impulse that was not socially acceptable (Denson et al., 2011). Through correlation analysis, we found that the deception tendencies of the self-control resources depletion group were significantly correlated with the P3. Although Experiment 2 did not find a significant difference in behavioral results in the self-control depletion group, the correlation results show that the P3 can be induced significantly when people have deception tendencies after self-control resources depletion. This result shows that although people did not show obvious deception tendencies on the surface, the intrinsic neural mechanism could prove that the P3 component related to deception was activated (Ding et al., 2013).
Individuals exhibited more deceptive behaviors (Kouchaki & Smith, 2014) or antisocial behaviors, such as quarrels (Righetti & Finkenauer, 2011), after they depleted a certain level of self-control resources. Self-control requires cognitive resources, which are limited. When more cognitive resources are used in an activity, these resources for self-control may be reduced. In this experiment, the participants in the experimental group who performed many highly difficult Stroop tasks and experienced self-control depletion failed to control themselves under the temptation of money. Accordingly, their deceptive processing increased, resulting in greater N2 and P3.
General Discussion
Intrinsic or Extrinsic Effect of Self-Control on Deceptive Behavior
Individuals with high self-control are more successful in suppressing selfish motives and engaging in prosocial behaviors. Individuals learn self-control in their daily interpersonal interactions. If individuals perceive that someone has a stronger self-control ability, they generally believe they can obtain greater benefits through cooperation with them. In fact, some researchers have observed a strong positive correlation between an individual’s self-control ability and others’ trust (Righetti & Finkenauer, 2011). Individuals with high self-control perform better academically (Duckworth & Kern, 2011), exhibit less impulsive behavior (Peluso et al., 1999), and exhibit more active health-conscious behaviors (Kuijer et al., 2008). Nonimpulsive individuals are characterized by a higher P3 amplitude after making high-risk choices; the prior preference of nonimpulsive individuals was a low-risk option. Thus, self-control may play a key role in inhibiting impulsive behavior, meeting external needs, and satisfying long-term interests (Hofmann et al., 2009; Righetti & Finkenauer, 2011). The results of Experiment 1 indicated that individuals with strong self-control ability can better suppress selfish motives, consider long-term interests, and are less likely to deceive on the basis of their own interests.
Experiment 1 examined the influence of self-control on deceptive behavior, revealing that self-control ability was intrinsic, relatively stable, and generally unchangeable. Experiment 2 examined the influence of self-control resources on deceptive behavior, indicating that self-control resources were extrinsic, unstable, and susceptible to environmental influences. Muraven et al. (1998) reported that emotional regulation, thought suppression, resistance to temptation, and distraction control can cause individuals to remain in a state of self-control depletion. These studies support the notion that the influence of self-control resources is extrinsic and easily disturbed. In Experiment 2, we selected only the participants with moderate self-control ability to exclude the influence of different levels of self-control on deceptive behavior. The experimental results indicated that participants in the depletion group exhibited more deceptive behaviors and deceptive tendencies compared with the participants with moderate self-control ability in the control group. The level of self-control in individuals with moderate self-control ability was relatively high; however, their deceptive behavior remained under the influence of self-control resources. Accordingly, the effect of self-control on deception may be primarily extrinsic. The occurrence of deception may have been primarily restrained by self-control resources. This could also explain the reason that individuals with strong self-control ability still exhibited deceptive behaviors. Three levels of self-control ability, such as high, medium, and low, should be considered in future research in order to examine the effects of different levels of self-control on deceptive behaviors under the condition of self-control resource depletion and nondepletion. This can aid in further determining whether the effect of self-control on deceptive behavior is intrinsic or extrinsic.
Individuals who engage in autonomous work feel that they cannot be restricted by rules while simultaneously showing high creativity, followed by an increase in immoral as well as selfish behavior (Lu, Brockner, et al., 2017; Lu, Zhang, et al., 2017). Accordingly, self-control helps inhibit impulsive behavior and meet external requirements and long-term interests (Hofmann et al., 2009; Righetti & Finkenauer, 2011).
Psychological Mechanism of the Effect of Self-Control Resources on Deceptive Behavior
There are two views concerning the influence of self-control resources on deceptive behavior. First, the view of energy exhaustion holds that self-control resources are significantly consumed in daily tasks, thereby reducing the self-control resources that an individual can use. Decline in self-control resources to a certain degree results in the state of ego depletion. Accordingly, the individual does not possess enough self-control resources to support the effective completion of the second self-control task. Second, researchers holding the view of energy preservation believe that typical daily tasks or self-control tasks lead to exhaustion of an individual’s self-control resources, stimulating the individual’s awareness of the need to preserve the remaining self-control resources until they are required. In recent years, most psychology studies seem to be inclined to support the concept of energy preservation rather than energy exhaustion (Muraven et al., 2006). For instance, Muraven et al. (2006) asked their participants to perform two self-control tasks; however, before they performed the second task, the experimental group was told that there was a third, more impor-tant self-control task awaiting. The participants in the experimental group gave up more quickly than did those in the control group while performing the second self-control task, indicating that the control group was saving certain self-control resources for a subsequent more important task (Muraven et al., 2006; Muraven et al., 1998). Similar results were obtained by Tyler and Burns (2009). In Experiment 2, we examined the impact of self-control resources on deceptive behavior. Participants in the depleted self-control resources group had to complete a 15-minute Stroop color discrimination task followed by the operation test and, finally, the visual perception task. The control group participants only needed to complete a simple word recognition task (noncolor noun), followed by the operation test and finally the red dot task. The subjective assessment results revealed that compared with the participants in the control group, those in the group with depleted self-control resources perceived the task as more difficult; however, the two groups did not significantly differ in their evaluation of the level of effort. These results indicate that the participants in the self-control resources depletion group potentially exhibited more deceptive behaviors or tendencies. However, in the previous task with self-control resources consumption (the Stroop task), the resources was not depleted. The reserves of self-control resources remained available to cope with emergency incidents. Accordingly, our experiments support the concept of energy preservation. Individuals fail to control themselves to avoid depleting self-control resources and exhibit increased deceptive behaviors and tendencies.
Acknowledgements
This work was supported in part by grants from the National Natural Science Foundation of China (31671134), the Hunan Province Philosophy Social Science Project (18YBQ095), the Natural Science Foundation of Hunan Province (2018JJ3341, 2018JJ2254), the Hunan Provincial Department of Education Scientific Research General Project (18A006). The funders had no role in study design, data collection and analysis, decision to publish, or preparation of the manuscript.
References
- Ambach W., Stark R., Peper M., Vaitl D. An interfering go/no–go task does not affect accuracy in a concealed information test. International Journal of Psychophysiology. 2010;75:258–267. doi: 10.1016/j.ijpsycho.2007.11.004. [DOI] [PubMed] [Google Scholar]
- Barnes C. M., Schaubroeck J., Huth M., Ghumman S. Lack of sleep and unethical conduct. Organizational Behavior and Human Decision Processes. 2011;115:169–180. [Google Scholar]
- Baumeister R. F., Bratslavsky E. , Muraven M., Tice D. M. Ego depletion: Is the active self a limited resource? Journal of Personality and Social Psychology. 1998;74:1252–1265. doi: 10.1037//0022-3514.74.5.1252. [DOI] [PubMed] [Google Scholar]
- Beauducel A., Brocke B., Leue A. Energetical bases of extraversion: Effort, arousal, EEG, and performance. International Journal of Psychophysiology. 2006;62:212–223. doi: 10.1016/j.ijpsycho.2005.12.001. [DOI] [PubMed] [Google Scholar]
- Bechara A., Damasio H., Damasio A. R. Role of the amygdala in decision‐making. Annals of the New York Academy of Sciences. 2003;985:356–369. doi: 10.1111/j.1749-6632.2003.tb07094.x. [DOI] [PubMed] [Google Scholar]
- Campanella S., Rossignol M., Mejias S., Joassin F., Maurage P., Debatisse D., Bruyer R., Crommelinck M., Guéritd J. M. Human gender differences in an emotional visual oddball task: An event-related potentials study. Journal of Neuroence Letters. 2004;367:14–18. doi: 10.1016/j.neulet.2004.05.097. [DOI] [PubMed] [Google Scholar]
- Chen J., Yuan J., Feng T., Chen A., Gu B., Li H. Temporal features of the degree effect in self-relevance: Neural correlates. Biological Psychology. 2011;87:290–295. doi: 10.1016/j.biopsycho.2011.03.012. [DOI] [PubMed] [Google Scholar]
- Christian M. S., Ellis A. P. Examining the effects of sleep deprivation on workplace deviance: A self-regulatory perspective. Academy of Management Journal. 2011;54:913–934. [Google Scholar]
- Christiansen P., Cole J. C., Field M. Ego depletion increases ad-lib alcohol consumption: Investigating cognitive mediators and moderators. Experimental and Clinical Psychopharmacology. 2012;20:118–128. doi: 10.1037/a0026623. [DOI] [PubMed] [Google Scholar]
- Debey E., Verschuere B., Crombez G. Lying and executive control: An experimental investigation using ego depletion and goal neglect. Acta Psychologica. 2012;140:133–141. doi: 10.1016/j.actpsy.2012.03.004. [DOI] [PubMed] [Google Scholar]
- Denson T. F., Pedersen W. C., Friese M., Hahm A., Roberts L. Understanding impulsive aggression: Angry rumination and reduced self-control capacity are mechanisms underlying the provocation-aggression relationship. Personality and Social Psychology Bulletin. 2011;37:850–862. doi: 10.1177/0146167211401420. [DOI] [PubMed] [Google Scholar]
- Ding X. P., Gao X., Fu G., Lee K. Neural correlates of spontaneous deception: A functional near-infrared spectroscopy (fNIRS)study. Neuropsychologia. 2013;51:704–712. doi: 10.1016/j.neuropsychologia.2012.12.018. [DOI] [PMC free article] [PubMed] [Google Scholar]
- Ding X. P., Sai L., Fu G., Liu J., Lee K. Neural correlates of second-order verbal deception: A functional near-infrared spectroscopy (fNIRS) study. Neuroimage. 2014;87:505–514. doi: 10.1016/j.neuroimage.2013.10.023. [DOI] [PubMed] [Google Scholar]
- Duckworth A. L., Kern M. L. A meta-analysis of the convergent validity of self-control measures. Journal of Research in Personality. 2011;45:259–268. doi: 10.1016/j.jrp.2011.02.004. [DOI] [PMC free article] [PubMed] [Google Scholar]
- Fan W., Zhong Y., Li H., Meng C., You C., Fu X. The influence of self-control in deceptive judgment and deceptive behavior. Acta Psychologica Sinica. 2016;48:845–856. [Google Scholar]
- Faul F., Erdfelder E., Buchner A., Lang A. G. Statistical power analyses using g*power 3.1: Tests for correlation and regression analyses. Behavioral Research Methods. 2009;41:1149–1160. doi: 10.3758/BRM.41.4.1149. [DOI] [PubMed] [Google Scholar]
- Folstein J. R., Van Petten C. Influence of cognitive control and mismatch on the N2 component of the ERP: A review. Psychophysiology. 2008;45:152–170. doi: 10.1111/j.1469-8986.2007.00602.x. [DOI] [PMC free article] [PubMed] [Google Scholar]
- Gamer M., Berti S. Task relevance and recognition of concealed information have different influences on electrodermal activity and event-related brain potentials. Psychophysiology. 2010;47:355–364. doi: 10.1111/j.1469-8986.2009.00933.x. [DOI] [PubMed] [Google Scholar]
- Gino F., Schweitzer M. E., Mead N. L., Ariely D. Unable to resist temptation: How self-control depletion promotes unethical behavior. Organizational Behavior and Human Decision Processes. 2011;115:191–203. [Google Scholar]
- Gunia B. C., Barnes C. M., Sah S. The morality of larks and owls: Unethical behavior depends on chronotype as well as time of day. Psychological Science. 2014;25:2272–2274. doi: 10.1177/0956797614541989. [DOI] [PubMed] [Google Scholar]
- Hofmann W., Friese M., Strack F. Impulse and self-control from a dual-systems perspective. Perspectives on Psychological Science. 2009;4:162–176. doi: 10.1111/j.1745-6924.2009.01116.x. [DOI] [PubMed] [Google Scholar]
- Johnson R., Barnhardt J., Zhu J. The contribution of executive processes to deceptive responding. Neuropsychologia. 2004;42:878–901. doi: 10.1016/j.neuropsychologia.2003.12.005. [DOI] [PubMed] [Google Scholar]
- Johnson R., Henkell H., Simon E., Zhu J. The self in conflict: The role of executive processes during truthful and deceptive responses about attitudes. NeuroImage. 2008;39:469–482. doi: 10.1016/j.neuroimage.2007.08.032. [DOI] [PubMed] [Google Scholar]
- Kiehl K. A., Laurens K. R., Duty T. L., Forster B. B., Liddle P. F. Neural sources involved in auditory target detection and novelty processing: An event-related fMRI study. Psychophysiology. 2001;38:133–142. [PubMed] [Google Scholar]
- Kouchaki M., Smith I. H. The morning morality effect: The influence of time of day on unethical behavior. Psychological Science. 2014;25:95–102. doi: 10.1177/0956797613498099. [DOI] [PubMed] [Google Scholar]
- Kuijer R., de Ridder D., Ouwehand C., Houx B., van den Bos R. Dieting as a case of behavioural decision making. Does self-control matter? Appetite. 2008;51:506–511. doi: 10.1016/j.appet.2008.03.014. [DOI] [PubMed] [Google Scholar]
- Leue A., Lange S., Beauducel A. Have you ever seen this face?—Individual differences of deception and event-related potentials. Frontiers in Psychology. 2012;3:570. doi: 10.3389/fpsyg.2012.00570. [DOI] [PMC free article] [PubMed] [Google Scholar]
- Lu J. G., Brockner J., Vardi Y., Weitz E. The dark side of experiencing job autonomy: Unethical behavior. Journal of Experimental Social Psychology. 2017;73:222–234. [Google Scholar]
- Lu J. G., Zhang T., Rucker D. D., Galinsky A. D. Atlas of moral psychology . Guilford Press; 2017. On the distinction between unethical and selfish behavior; pp. 465–475. [Google Scholar]
- Martin L. E., Potts G. F. Impulsivity in decision-making: An event-related potential investigatio. Personality and Individual Differences. 2009;46:303–308. doi: 10.1016/j.paid.2008.10.019. [DOI] [PMC free article] [PubMed] [Google Scholar]
- Martinsson P., Myrsethy K. O. R., Wollbrant C. Reconciling pro-social vs selfish behavior: On the role of self-control. Judgment and Decision Making. 2012;7:304–315. [Google Scholar]
- Mead N. L., Baumeister R. F., Gino F., Schweitzer M. E., Ariely D. Too tired to tell the truth: Self-control resource depletion and dishonesty. Journal of Experimental Social Psychology. 2009;45:594–597. doi: 10.1016/j.jesp.2009.02.004. [DOI] [PMC free article] [PubMed] [Google Scholar]
- Mecklinger A., Kramer A. F., Strayer D. L. Event related potentials and EEG components in a semantic memory search task. Psychophysiology. 2010;29:104–119. doi: 10.1111/j.1469-8986.1992.tb02021.x. [DOI] [PubMed] [Google Scholar]
- Muraven M., Baumeister R. F. Self-regulation and depletion of limited resources: Does self-control resemble a muscle? Psychological Bulletin. 2000;126:247–259. doi: 10.1037/0033-2909.126.2.247. [DOI] [PubMed] [Google Scholar]
- Muraven M., Shmueli D., Burkley E. Conserving self-control strength. Journal of Personality and Social Psychology. 2006;91:524–537. doi: 10.1037/0022-3514.91.3.524. [DOI] [PubMed] [Google Scholar]
- Muraven M., Tice D. M., Baumeister R. F. Self-control as a limited resource: Regulatory depletion patterns. Journal of Personality and Social Psychology. 1998;74:774–789. doi: 10.1037//0022-3514.74.3.774. [DOI] [PubMed] [Google Scholar]
- Neshat-Doost H. T., Dalgleish T., Golden A. M. J. Reduced specificity of emotional autobiographical memories following self-regulation depletion. Emotion. 2008;8:731–736. doi: 10.1037/a0013507. [DOI] [PubMed] [Google Scholar]
- Peluso T., Ricciardelli L. A., Williams R. J. Brief report self-control in relation to problem drinking and symptoms of disordered eating. Addictive Behaviors. 1999;24:439–442. doi: 10.1016/s0306-4603(98)00056-2. [DOI] [PubMed] [Google Scholar]
- Ren M., Zhong B., Fan W., Dai H., Yang B., Zhang W., Yin Z., Liu J., Li J., Zhan Y. The influence of self-control and social status on self-deception. Frontiers in Psychology. 2018;9:1256. doi: 10.3389/fpsyg.2018.01256. [DOI] [PMC free article] [PubMed] [Google Scholar]
- Righetti F., Finkenauer C. If you are able to control yourself, I will trust you: The role of perceived self-control in interpersonal trust. Journal of Personality and Social Psychology. 2011;100:874–886. doi: 10.1037/a0021827. [DOI] [PubMed] [Google Scholar]
- Roeser K., McGregor V. E., Stegmaier S., Mathew J., Kübler A., Meule A. The Dark Triad of personality and unethical behavior at different times of day. Personality and Individual Differences. 2016;88:73–77. [Google Scholar]
- Schmeichel B. J., Caskey R., Hicks J. A. Rational versus experiential processing of negative feedback reduces defensiveness but induces ego depletion. Self and Identity. 2015;14:75–89. [Google Scholar]
- Shmueli D., Prochaska J. J. Resisting tempting foods and smoking behavior: Implications from a self-control theory perspective. Health Psychology. 2009;28:300–306. doi: 10.1037/a0013826. [DOI] [PMC free article] [PubMed] [Google Scholar]
- Shu-Hua T. Revision of self-control scale for chinese college students. Chinese Journal of Clinical Psychology. 2008;16:468–470. [Google Scholar]
- Suchotzki K., Crombez G. , Smulders F. T. Y., Meijer E., Verschuere B. The cognitive mechanisms underlying deception: an event-related potential study. International Journal of Psychophysiology. 2015;95:395–405. doi: 10.1016/j.ijpsycho.2015.01.010. [DOI] [PubMed] [Google Scholar]
- Tang H., Zhang S., Jin T., Wu H., Su S., Liu C. Brain activation and adaptation of deception processing during dyadic face-to-face interaction. Cortex. 2019;120:326–339. doi: 10.1016/j.cortex.2019.07.004. [DOI] [PubMed] [Google Scholar]
- Tangney J. P., Baumeister R. F., Boone A. L. High self-control predicts good adjustment, less pathology, better grades, and interpersonal success. Journal of Personality. 2004;72:271–324. doi: 10.1111/j.0022-3506.2004.00263.x. [DOI] [PubMed] [Google Scholar]
- Thorpe S., Fize D., Marlot C. Speed of processing in the human visual system. Nature. 1996;381(6582):520–522. doi: 10.1038/381520a0. [DOI] [PubMed] [Google Scholar]
- Tu S., Li H. J., Zhang Q., Wang T., Yu C., Qiu J. An event-related potential study of deception to self preferences. Brain Research. 2009;1247:142–148. doi: 10.1016/j.brainres.2008.09.090. [DOI] [PubMed] [Google Scholar]
- Tyler J. M., Burns K. C. Triggering conservation of the self's regulatory resources. Basic And Applied Social Psychology. 2009;31:255–266. [Google Scholar]
- Vohs K. D. Money priming can change people's thoughts, feelings, motivations, and behaviors: An update on 10 years of experiments. Journal of Experimental Psychology: General. 2015;144:e86–e93. doi: 10.1037/xge0000091. [DOI] [PubMed] [Google Scholar]
- Wu H., Hu X., Fu G. Does willingness affect the n2-p3 effect of deceptive and honest responses? Neuroscience Letters. 2009;467:63–66. doi: 10.1016/j.neulet.2009.10.002. [DOI] [PubMed] [Google Scholar]
- Yeung N., Holroyd C. B., Cohen J. D. ERP correlates of feedback and reward processing in the presence and absence of response choice. Cerebral Cortex. 2005;15:535–544. doi: 10.1093/cercor/bhh153. [DOI] [PubMed] [Google Scholar]


