



Abstract
Understanding the regulation mechanisms of mesenchymal stem cells (MSCs) can assist in tissue regeneration. The histone demethylase (KDM) family has a crucial role in differentiation and cell proliferation of MSCs, while the function of KDM3B in MSCs is not well understood. In this study, we used the stem cells from the apical papilla (SCAPs) to test whether KDM3B could regulate the function of MSCs. By an alkaline phosphatase (ALP) activity assay, Alizarin red staining, real-time RT-PCR, and western blot analysis, we found that KDM3B enhanced the ALP activity and mineralization of SCAPs and promoted the expression of runt-related transcription factor 2 (RUNX2), osterix (OSX), dentin sialophosphoprotein (DSPP), and osteocalcin (OCN). Additionally, the CFSE, CCK-8, and flow cytometry assays revealed that KDM3B improved cell proliferation by accelerating cell cycle transition from the G1 to S phase. Scratch and transwell migration assays displayed that KDM3B promoted the migration potential of SCAPs. Mechanically, microarray results displayed that 98 genes were upregulated, including STAT1, CCND1, and FGF5, and 48 genes were downregulated after KDM3B overexpression. Besides, we found that the Toll-like receptor and JAK-STAT signaling pathway may be involved in the regulating function of KDM3B in SCAPs. In brief, we discovered that KDM3B promoted the osteo-/odontogenic differentiation, cell proliferation, and migration potential of SCAPs and provided a novel target and theoretical basis for regenerative medicine.
1. Introduction
With the development of the technique, the treatment outcome of tooth loss and orofacial bone defects is improved continuously. Nonetheless, the limited bone intrinsic regenerative ability or the impaired host regenerative ability will affect the tissue repair and regeneration [1]. In recent years, stem cell-based therapy is a prospecting strategy for repairing and regenerating dental and orofacial bone defects [2]. Mesenchymal stem cells (MSCs) are attractive candidates for tissue regeneration due to their capacity for self-renewal and multiple differentiation potentials [3, 4]. At present, stem cells are divided into odontogenic stem cells including the stem cells from the apical papilla (SCAPs), stem cells from the dental pulp (DPSCs) and periodontal ligament (PDLSCs), and nonodontogenic stem cells including bone marrow stem cells (BMSCs) [5, 6]. However, the underlying molecular mechanism of MSCs remains to be unveiled before widespread clinical application in dental and orofacial bone regeneration.
Histone methylation is a major regulator of epigenetic modification, which could be critical for determining the cell fate of MSCs [7, 8]. The status and location of lysine methylation determine that it acts as an activator or suppressor of transcription, such as H3K4, H3K36, and H3K79 methylation activating transcription and H3K9, H3K27, and H4K20 methylation suppressing transcription, and is regulated by histone methyltransferases and demethylases [8, 9]. Therefore, the function and balance between histone methyltransferases and demethylases determine gene expression. The largest family of histone demethylase (KDMs) has the Jumonic (JmjC) domain, including the KDM2-7 subfamily; these histone demethylases are thought to have functions in maintaining cell fate and genome stability [10, 11]. At present, histone demethylation is an important epigenetic mechanism in dental and orofacial bone regeneration [12–14]. And mounting evidence shows that the KDM subfamily may be linked to osteo-/odontogenic differentiation and cell proliferation [12, 15–21].
The current results reflected that the loss of H3K9me2 is associated with the activation of gene expression [22]. Lysine-specific demethylase 3B (KDM3B), also known as JMJD1B, which is a JmjC domain-containing protein, was regarded as a lysine demethylase for H3K9 demethylation (H3K9me2) [22, 23]. Moreover, KDM3B is responsible for the demethylation of H3K9me2 which has been shown to change the state of chromatin modification and dynamically regulate the gene expression of differentiated cells and regulate the proliferation of cells [19, 24–26]. Subsequently, researchers confirm that KDM3B is also important for the erasure of H4R3me2s which is also necessary for cellular processes including osteogenic differentiation and cell cycle potential of MSCs [22, 27], while the molecular mechanisms by which KDM3B regulates osteo/-odontogenic differentiation and self-renewal capacity in MSCs have not been well characterized and need to be explored.
In this study, our team aims to explore the potential function and mechanism of the KDM3B in MSCs by using SCAPs. Our findings show that the KDM3B promotes the osteo-/odontogenic differentiation, cell proliferation, and migration potential in human SCAPs. Moreover, the candidate targets of KDM3B are identified and provide the novel target and theoretical basis for tissue regeneration.
2. Materials and Methods
2.1. Cell Cultures
Apical papilla stem cells (SCAPs) were used in these experiments following the ISSCR “Guidelines for the Conduct of Human Embryonic Stem Cell Research,” after obtaining patient consent, and the study was approved by the ethics committee of Beijing Stomatological Hospital, Capital Medical University. SCAPs were obtained as previously depicted [28, 29]. Briefly, the apical tissue was peeled off rapidly after wisdom tooth extraction and digested with 3 mg/mL type I collagenase (Worthington Biochemical Corp., Lakewood, NJ, USA) and 4 mg/mL Dispase (Roche Diagnostics Corp., Indianapolis, IN, USA) at 37°C for 45 min. In our previous study, we described the culture of SCAPs [28, 29]. The cell images under the microscope are shown in Figure S1.
2.2. Plasmid Construction and Viral Infection
Construction of plasmids following standard techniques was confirmed using restriction enzyme digestion analysis or sequencing. A hemagglutinin (HA) tag combined with the full-length sequence of KDM3B was subcloned into the pQCXIN retroviral vector by the BamH1 and AgeI restriction sites. Short hairpin RNA (shRNA) of KDM3B was subcloned into the pLKO.1 lentiviral vector (Addgene). The scramble shRNA (Scramsh) was purchased from Addgene. The target sequence for the shRNA of KDM3B was 5′-AGGCACATTACATTTAGTC-3′.
2.3. Alkaline Phosphatase (ALP) and Alizarin Red Detection
SCAPs were cultured in the osteogenesis differentiation medium for 3 days, and ALP activity was detected with an ALP activity kit (Sigma-Aldrich, St. Louis, MO, USA). Cells were cultured in osteogenesis differentiation medium for 2 weeks and then stained with Alizarin red according to the manufacturer's instructions, as described in our previous work [15].
2.4. Real-Time Reverse Transcriptase Polymerase Chain Reaction (Real-Time RT-PCR)
The extraction of total RNA of SCAPs, the synthesis of cDNA, and the reactions of real-time RT-PCR were tested as described in our previous study [30]. By using the method of 2-△△CT, the expression of genes was determined and normalized based on GAPDH. The primers used in this study are listed in Table 1.
Table 1.
Primer sequences used in the real-time RT-PCR.
| Gene symbol | Primer sequences (5′-3′) |
|---|---|
| GAPDH-F | CGGACCAATACGACCAAATCCG |
| GAPDH-R | AGCCACATCGCTCAGACACC |
| RUNX2-F | TCTTAGAACAAATTCTGCCCTTT |
| RUNX2-R | TGCTTTGGTCTTGAAATCACA |
| OSX-F | CCTCCTCAGCTCACCTTCTC |
| OSX-R | GTTGGGAGCCCAAATAGAAA |
2.5. Western Blot Analysis
25 μg protein isolated from SCAPs was diluted in PBS to a total volume of 25 μL. The western blot was performed as described in our previous study [30]. The primary antibodies used in the study are as follows: KDM3B antibody (cat no. 19915-1-AP, Rabbit Polyclonal, USA), RUNX2 antibody (cat no. ab76956, Abcam), OSX antibody (cat no. ab209484, Abcam), OCN antibody (cat no. bs-4917R, Bioss, China), DSPP antibody (cat no. bs10316R, Bioss, China), and histone H3 antibody (cat no. SC-56616, Santa Cruz Biotechnology, Santa Cruz, CA, USA).
2.6. CFSE Assay
To detect the proliferation ability of SCAPs, carboxyfluorescein succinimidyl ester (CFSE) assays were applied as previously described [30]. The proliferation ability of SCAPs was tested by flow cytometry (FACSCalibur, BD Biosciences, USA) after staining with CFSE reagents. The results were documented using flow cytometry with a 488 nm laser. ModFit LT (Verity Software House, Topsham, ME, USA) was applied to calculate the proliferation index.
2.7. CCK-8 Assay
To further test the proliferation ability of SCAPs, the Cell Counting Kit-8 assay (Dojindo, Kumamoto, Japan) was performed as previously described [30]. 7 × 10³ cells/well were seeded into 96-well plates. After 24 h and 48 h incubation, the culture medium was replaced with 10 μL CCK-8 reagent mixed with 100 μL DMEM. 2 h of incubation later, the absorbance (OD) was measured with a multiwell spectrophotometer at 450 nm.
2.8. Flow Cytometry for the Cell Cycle
The flow cytometry was applied for detecting the cell cycle. As previously described [30], SCAPs (1 × 10⁶) were placed in anhydrous ethanol at 4°C overnight and then incubated with the mixture of propidium iodide (50 μg/mL, Sigma) and 10 μg/mL RNase in the dark for 30 minutes. Cell cycle fractions (G0/G1 phase, S phase, and G2/M phase) were calculated by flow cytometry. PI = ((S + G2)/M)/((G0/G1) + S + G2M) was applied to calculate the proliferation index.
2.9. Scratch Migration Assays
SCAPs were seeded in 6-well culture plates with 4 × 10⁵ cells per well and cultured in serum-free medium for 48 h. Subsequently, the cells were scratched with a 1000 μL pipet tip (Axygen® Corning, NY, USA) to create a wound and washed twice with PBS to clear the floating cells and then continuously incubated in the fresh culture medium. Scratch images were observed under a microscope at 0 h, 24 h, and 48 h after wound scratch, the degree of wound closure was tested, and the relative width (RW) was calculated by the program of Image-Pro 1.49v (National Institutes of Health, USA).
2.10. Transwell Chemotaxis Assays
To detect the chemotaxis ability of SCAPs, 24-well chemotaxis chambers were applied for this experiment. SCAPs suspended in 100 μL serum-free medium (Invitrogen, Carlsbad, CA, USA) were placed in the upper chamber at a density of 2 × 10⁴ cells, while 600 μL of serum-free medium with the addition of 15% fetal bovine serum (FBS) was added in the bottom chamber. The chemotactic ability of the cells will cause the cells in the upper chamber to migrate through the hole to the lower chamber. After 24 and 48 hours, 10 visual fields were randomly selected for counting transferred cell numbers using a microscope (Olympus, Japan).
2.11. Microarray Analysis
The gene expression profile was performed and analyzed by using the Human Gene 1.0 ST Array (Affymetrix, USA). Abiding by the methods as described previously [30], differentially expressed genes were analyzed using the Affymetrix GeneChip Operating Software (Affymetrix, USA). The selected threshold set for differentially mRNAs was a fold change > 1.5 and a P value < 0.05.
2.12. Statistics
Each experiment was done at least in triplicate. All the data were analyzed by the SPSS17 statistical software (SPSS Inc., Chicago, IL, USA). Significance was determined using Student's t-test. P ≤ 0.05 was regarded as statistically significant.
3. Results
3.1. KDM3B Increased the Osteo-/Odontogenic Differentiation Potential of SCAPs
To identify the potential roles of KDM3B, we knock down KDM3B in SCAPs through lentiviral transfection. The knockdown efficiency of KDM3B in SCAPs was tested by western blot analysis after 3 days of treatment of 2 μg/mL puromycin (Figure 1(a)). At 3 days after osteo-/odontogenic induction, we found that KDM3B knockdown significantly depressed the ALP activity (Figure 1(b)). The Alizarin red staining and the quantitative calcium analysis were assessed after 2 weeks of in vitro culturing in osteo-/odontogenic induction medium. The results reflected that KDM3B knockdown reduced the mineralization capacity of SCAPs (Figures 1(c) and 1(d)). Real-time RT-PCR analysis confirmed that KDM3B knockdown reduced the expression of RUNX2 and OSX (Figures 1(e) and 1(f)). After osteo-/odontogenic induction, western blot analysis showed downregulated RUNX2 and OSX in the KDM3B knockdown group compared with the control group at 0 and 7 days (Figure 1(g)). Moreover, we detected the osteo-/odontogenic marker proteins at 2 weeks after osteo-/odontogenic induction, and the western blot results reflected that expression of OCN and DSPP was decreased after KDM3B was knocked down in SCAPs (Figure 1(h)). To further investigate the osteo-/odontogenic differentiation function of KDM3B in SCAPs, the HA-KDM3B sequence was inserted into the retroviral vector which was used to infect SCAPs. The KDM3B overexpression was tested by western blot (Figure 1(i)). At 3 days after osteo-/odontogenic induction, we discovered that KDM3B overexpression significantly enhanced the ALP activity (Figure 1(j)). At 2 weeks after osteo-/odontogenic induction, the Alizarin red staining and the quantitative calcium analysis revealed that KDM3B overexpression enhanced the mineralization capacity of SCAPs (Figures 1(k) and 1(l)). Real-time RT-PCR analysis confirmed that KDM3B overexpression promoted the expression of RUNX2 and OSX (Figures 1(m) and 1(n)). After osteo-/odontogenic induction, western blot analysis showed upregulated RUNX2 and OSX in the KDM3B overexpression group compared with the control group at 0 and 7 days (Figure 1(o)). In parallel, after 2 weeks of osteo-/odontogenic induction, the western blot results revealed that the expression of OCN and DSPP was enhanced after KDM3B was overexpressed (Figure 1(p)).
Figure 1.

KDM3B enhanced the osteo-/odontogenic differentiation potential of SCAPs. (a) The knockdown efficiency of KDM3B in SCAPs was tested by western blot. (b) KDM3B knockdown significantly depressed the ALP activity in SCAPs. (c) The Alizarin red staining and (d) the quantitative calcium analysis showed that KDM3B knockdown reduced the mineralization capacity of SCAPs compared with the control group. (e, f) Real-time RT-PCR analysis confirmed that KDM3B knockdown reduced the expression of (e) RUNX2 and (f) OSX in SCAPs. (g) Western blot analysis showed the expression of RUNX2 and OSX in the KDM3B knockdown group and the control group. Histone H3 served as an internal control. (h) Western blot analysis revealed that the expression of DSPP and OCN was decreased after KDM3B was knocked down. Histone H3 served as an internal control. (i) The KDM3B overexpression was tested by western blot. (j) KDM3B overexpression significantly enhanced the ALP activity in SCAPs. (k, l) The results of (k) the Alizarin red staining and (l) the quantitative calcium analysis revealed that KDM3B overexpression enhanced the mineralization capacity of SCAPs compared with the control group. (m, n) Real-time RT-PCR analysis revealed that KDM3B overexpression increased the expression of (m) RUNX2 and (n) OSX in SCAPs. (o) Western blot analysis showed the expression of RUNX2 and OSX in the KDM3B overexpression group and the control group. Histone H3 served as an internal control. (p) Western blot analysis revealed that the expression of OCN and DSPP was enhanced after KDM3B was overexpressed. Histone H3 served as an internal control. Statistical significance was determined using Student's t-test. All error bars represent SD (n = 3). P < 0.05. ∗∗P ≤ 0.01.
3.2. KDM3B Enhanced the Proliferation Ability of SCAPs
To detect the effects of KDM3B on cell proliferation potential of SCAPs, the CFSE assay, CCK-8 assay, and flow cytometric cell cycle analysis were performed. After culturing for 3 days, the result of the CFSE assay confirmed that the proliferation potential of SCAPs was suppressed following KDM3B knockdown (Figures 2(a) and 2(b)). The result of the CCK-8 assay showed that cell numbers in the KDM3B knockdown group were significantly reduced compared with those in the control group at 24 h and 48 h (Figure 2(c)). Then, after culturing for 3 days, flow cytometric cell cycle analysis was carried out. The results revealed that KDM3B knockdown increased the proportion of cells in the G0/G1 phase and decreased the percentage of cells in S phases (Figures 2(d) and 2(e)). After calculation, the proliferation index was significantly lower in the KDM3B knockdown group than in the control group (Figure 2(f)). To further prove whether KDM3B could affect the proliferation potential of SCAPs, the CFSE assay, CCK-8 assay, and flow cytometric cell cycle analysis were performed in KDM3B overexpression SCAPs. After culturing for 3 days, the CFSE assay showed that the proliferation potential of SCAPs was enhanced in the KDM3B overexpression group compared with the control group (Figures 2(g) and 2(h)). The result of the CCK-8 assay showed that cell numbers in the KDM3B overexpression group were significantly increased compared with those in the control group at 24 h and 48 h (Figure 2(i)). Also, after culturing for 3 days, flow cytometric cell cycle analysis was carried out in SCAPs. The results showed that KDM3B overexpression decreased the proportion of cells in the G0/G1 phase and increased the proportion of cells in the S phase (Figures 2(j) and 2(k)). Consistently, the proliferation index was higher in the KDM3B overexpression group than in the control group (Figure 2(l)).
Figure 2.
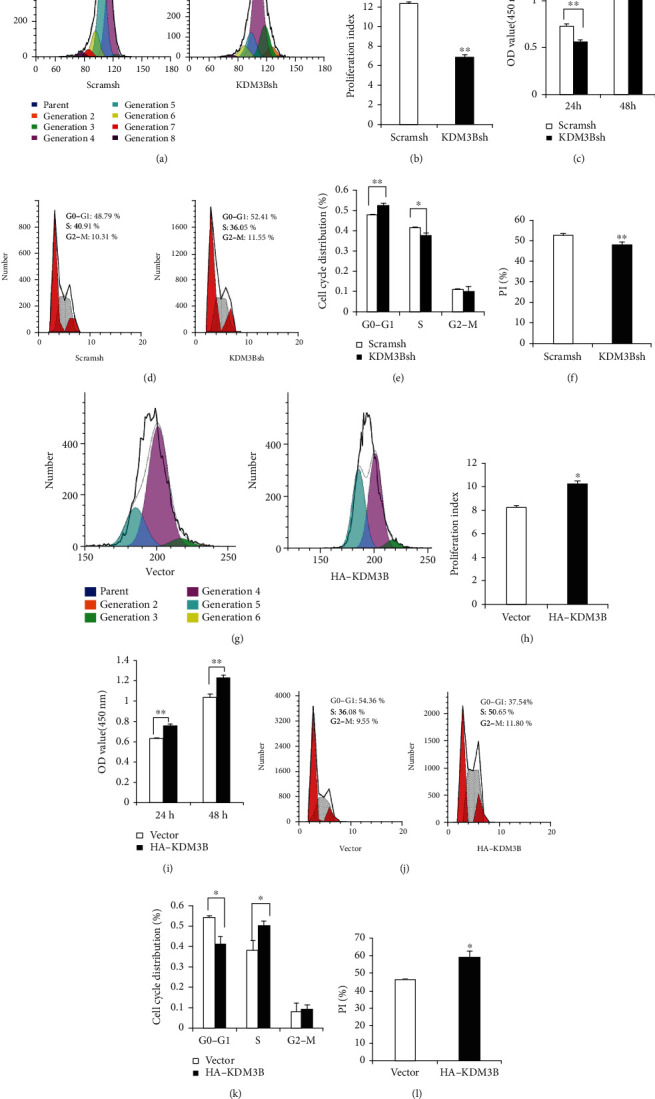
KDM3B enhanced the cell proliferation of SCAPs and regulated the cell cycle. The (a) CFSE assay and (b) quantitative analysis results revealed that KDM3B knockdown decreased the cell numbers at 3 days in SCAPs. (c) The CCK-8 assay revealed that KDM3B knockdown reduced the cell numbers at 24 h and 48 h in SCAPs. (d) Flow cytometric cell cycle analysis revealed that KDM3B knockdown increased the proportion of cells in the G0/G1 phase and decreased the proportion of cells in the S phase. (e) Comparison of cell cycle distribution between the KDM3B knockout group and the control group. (f) The proliferation index between the KDM3B knockout group and the control group. The (g) CFSE assay and (h) quantitative analysis results revealed that KDM3B overexpression enhanced the cell numbers at 3 days in SCAPs. (i) The CCK-8 assay revealed that KDM3B overexpression increased the cell numbers at 24 h and 48 h in SCAPs. (j) Flow cytometric cell cycle analysis revealed that KDM3B overexpression decreased the percentage of cells in the G0/G1 phase and increased the proportion of cells in the S phase. (k) Comparison of cell cycle distribution between the KDM3B overexpression group and the control group. (l) The proliferation index between the KDM3B overexpression group and the control group. Statistical significance was determined using Student's t-test. All error bars represent SD (n = 3 or 6). P < 0.05. ∗∗P ≤ 0.01.
3.3. KDM3B Enhanced the Migration and Chemotaxis Potential of SCAPs
To test whether KDM3B could regulate the migration potential of SCAPs, the scratch migration and transwell chemotaxis assays were performed. Scratch migration assays demonstrated that KDM3B knockdown led to a significant decrease in the migration ability of SCAPs at 24 h and 48 h (Figures 3(a) and 3(b)). Similarly, the results of the transwell chemotaxis assay confirmed that KDM3B knockdown led to a decrease in the chemotaxis ability of SCAPs at 24 h and 48 h (Figures 3(c) and 3(d)). To further confirm the function of KDM3B in the regulation of the migration of SCAPs, the scratch migration and transwell chemotaxis assays were performed in KDM3B overexpression SCAPs. Scratch migration assay results revealed that KDM3B overexpression led to a significant increase in the migration ability of SCAPs at 24 h and 48 h (Figures 3(e) and 3(f)). The results of the transwell chemotaxis assay confirmed that KDM3B overexpression led to a significant increase in the chemotaxis ability of SCAPs at 24 h and 48 h (Figures 3(g) and 3(h)).
Figure 3.
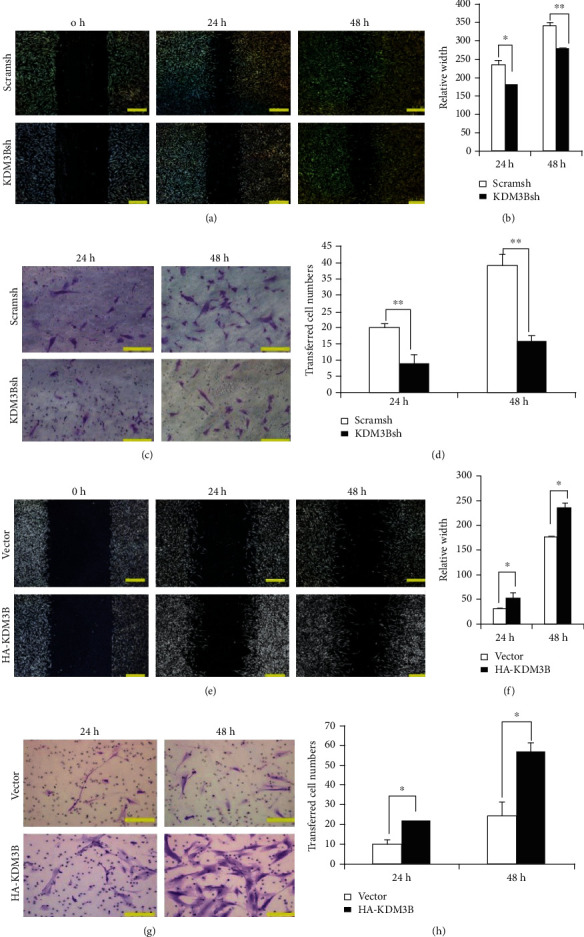
KDM3B enhanced the migration and chemotaxis potential of SCAPs. The (a) scratch migration assay and (b) quantitative analysis results demonstrated that KDM3B knockdown led to a significant decrease in the migration ability of SCAPs at 24 h and 48 h. The (c) transwell chemotaxis assay and (d) quantitative analysis results showed that KDM3B knockdown led to a decrease in the chemotaxis ability of SCAPs at 24 h and 48 h. The (e) scratch migration assay and (f) quantitative analysis results demonstrated that KDM3B overexpression led to a significant increase in the migration ability of SCAPs at 24 h and 48 h. The (g) transwell chemotaxis assay and (h) quantitative analysis results showed that KDM3B overexpression led to an increase in the chemotaxis ability of SCAPs at 24 h and 48 h. Statistical significance was determined using Student's t-test. All error bars represent SD (n = 3 or 6). P < 0.05. ∗∗P ≤ 0.01.
3.4. Differentially Expressed Genes and Bioinformatic Analysis in KDM3B overexpression SCAPs
Subsequently, differentially expressed genes between KDM3B overexpression SCAPs and the control group were identified by microarray analysis. The microarray analysis results suggested that there were 146 differential genes in the KDM3B overexpression SCAPs compared with the control group. In these differentially expressed genes, 98 genes were upregulated while 48 genes were downregulated in the KDM3B overexpression SCAPs compared with the control group (Table S1). The upregulated genes include TGM2, ITGA2, STAT1, CCND1, FGF5, and SEMA3A, while the downregulated genes include COL3A1, C5AR2, and SERPINF1.
Then, gene ontology (GO) analysis and pathway analysis were carried out. First, GO analysis was used to identify a statistical enrichment of various biological functions and pathways from the differentially expressed genes in the HA-KDM3B group. By GO analysis, the upregulated GO functions included positive regulation of cell migration, positive regulation of cell motility, positive regulation of cellular component movement, and positive regulation of response to external stimulus (Figure 4(a)). Some important downregulated GO functions included negative regulation of TOR signaling and negative regulation of cell migration (Figure 4(b)).
Figure 4.
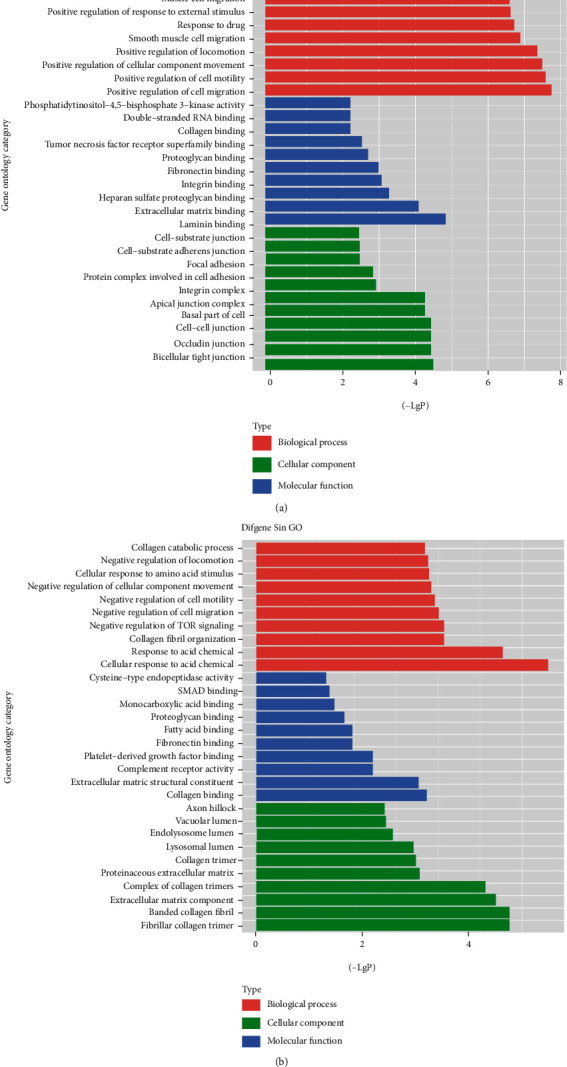
Significant gene ontology (GO) analyses of differentially expressed genes in KDM3B overexpression SCAPs compared with the control group. (a) The significant GO functions of upregulated genes during KDM3B overexpression. (b) The significant GO functions of downregulated genes during KDM3B overexpression. The y-axis represents the GO category, and the x-axis represents the negative logarithm of the P value (−LgP). A larger −LgP indicated a smaller P value for the difference.
We then used the KEGG database to enrich the pathways of significant alterations in differentially expressed genes and identified the pathways of significant changes associated with differentially expressed genes which may play an important role in function regulation of KDM3B (Table S2). After analysis, the Toll-like receptor and the JAK-STAT signaling pathway associated with upregulated genes as well as focal adhesion and the TGF-beta signaling pathway associated with downregulated genes were identified (Figure 5, Table S3).
Figure 5.
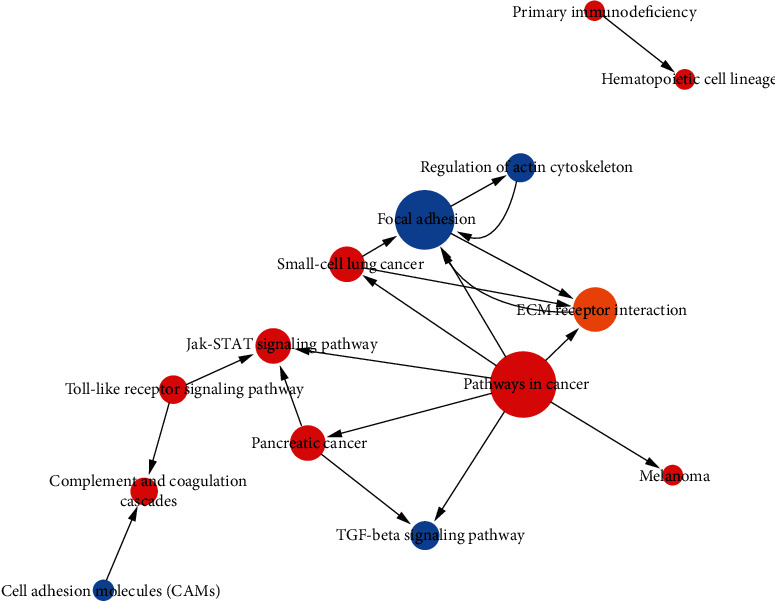
Analysis of the interaction network of significant pathways (Path-net) in the KDM3B overexpression group compared with the control group. A pathway of a high degree means that it played an essential role in the signaling network. Red indicates upregulated pathways, blue indicates downregulated pathways, and yellow indicates up- and downregulated pathways. Circle nodes represent a pathway, and the lines indicate the interactions between two pathways.
To further examine the global network, we calculated connectivity of each gene in the network and determined the node with the highest connectivity by Signal-net analysis. Through the analysis of the significantly regulated GOs and pathways, we found 12 core genes (CCND1, CLDN1, CLDN11, DDX58, FGF5, ISG15, MET, MYD88, PLAT, PLAU, and SERPINE1) in the KDM3B overexpression group compared with the control group according to the degree of gene interaction (Figure 6, Table S4).
Figure 6.
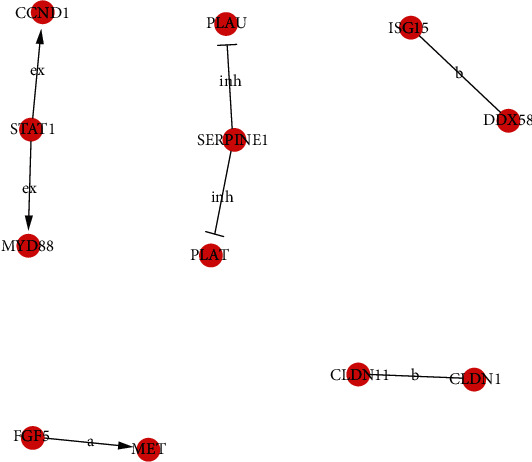
Analysis of the interaction network of differentially expressed genes (Signal-net) in the KDM3B overexpression group compared with the control group. In the Signal-net, the intermediate centrality of genes represents the characteristics of genes. Red represents an important upregulated gene, and the degree of interaction between genes is indicated by the circle size and the interaction is indicated by the line.
4. Discussion
Dental and orofacial bone regeneration depends on the MSCs [31]. Under the condition of osteogenesis, dental tissue-derived MSCs expressed typical osteoblastic markers such as mineralized matrix nodules and differentiate into an osteoblastic/odontoblastic lineage [32]. The maintenance of self-renewal and differentiation potential is essential in MSC-based therapy, but expansion in vitro may lead to the loss of these characteristics [32]. Therefore, improving the function of MSCs will effectively improve the therapeutic efficacy of MSCs.
ALP activity is an early marker of osteo-/odontogenic differentiation. In our study, we proved that KDM3B promotes osteo-/odontogenic differentiation by increasing the expression of ALP. In vitro mineralization represents a late marker of osteogenesis. The results of Alizarin red staining and the quantitative calcium analysis revealed that KDM3B enhanced the mineralization in SCAPs. These results all consistent with the data reported in the literature revealed that KDM3B is the key factor of osteogenic differentiation in MSCs [33]. In our study, we found that KDM3B promotes the gene expressions of SCAPs which are involved in the process of cell differentiation. These genes, including RUNX2 and OSX, have been identified as key transcription factors in the early stage of osteo-/odontogenic differentiation [34, 35]. Besides, KDM3B also promoted the expressions of OCN and DSPP in SCAPs. These proteins represent a commitment to differentiate into an osteogenic cell lineage [36–38]. The above results suggested that KDM3B is a potential enhancer of osteo-/odontogenic differentiation in SCAPs.
Moreover, new bone formation and graft integration rely on the recruitment of stem cells to target sites and obtained more stem cells for successful directed differentiation in the microenvironment [39]. In the present study, we also confirmed that KDM3B enhanced the proliferation ability of SCAPs by promoting the rapid transition from the G1 phase to the S phase. We also discovered that KDM3B enhanced the migration and chemotaxis ability of SCAPs. This is consistent with the previous report in B cells and liver cells [19, 25]. Combined together, these results suggest that KDM3B has a positive role for the recruitment of SCAPs and facilitates cell expansion.
Previously, Li et al. found that KDM3B demethylates H4R3me2s and H3K9me2 in different promoter regions to facilitate gene expression for the development of hematopoietic stem cells [22]. To further explore its regulatory mechanism, we carried out microarray analysis and identify the significantly differential genes after enhanced expression of KDM3B. After bioinformatic analysis, the GO analysis indicated that some upregulated GO functions might be linked to osteo-/odontogenic differentiation, cell proliferation, and migration potential including positive regulation of cell migration, positive regulation of cell motility, positive regulation of cellular component movement, and positive regulation of response to external stimulus. Then, the Path-net analysis results suggest that the Janus kinase signal transducer and activator of transcription (JAK-STAT) and Toll-like receptor signaling pathways may be involved in the functional regulation of KDM3B. At present, some researches have shown that the JAK-STAT pathway can modulate cell migration potentials of BMSCs [40] while regulating bone regeneration and promoting angiogenesis [41–43]. Among them, the STAT1-CCND1/CDK6 axis promotes proliferation by accelerating the transition from the G0/G1 phase to the S phase [44, 45]. These genes are believed to be key factors in cell proliferation. Besides, it is generally known that MSCs are recruited to the injured or inflamed sites through TLR receptor-mediated interactions to promote tissue repair and regeneration [46]. It has been confirmed that potent agonists of TLR2, TLR3, and TLR4 enhanced the ability of MSCs to differentiate into osteoblasts [47]. As a key receptor of TLRs, MYD88 can enhance the expression of RUNX2 and ALP activity induced by TLR4 [48]. MSCs isolated from Myd88-deficient mice cannot differentiate into osteoblasts [49]. This indicates that KDM3B may enhance the osteo-/odontogenic differentiation ability of SCAPs by promoting the expression of MYD88, but further study is needed. Meanwhile, other core genes also play an important role in regulating the function of MSCs. FGF5 promotes osteogenic differentiation and cell proliferation potential of BMSCs by activating ERK1/2 [50]. Proteolytic enzymes, such as PLAU, may play a crucial role in cell migration and tissue remodeling during tissue regeneration. However, SERPINE1 can reverse the function of PLAU as an inhibitor of PLAU [51]. In general, our findings confirmed that KDM3B may affect the biological function of SCAPs by regulating some candidate downstream genes, but the molecular mechanism and regulation function remain to be further studied.
5. Conclusions
In conclusion, we identified that KDM3B promoted the osteo-/odontogenic differentiation, cell proliferation, and migration potential of SCAPs. We also identified the key downstream genes and possible pathways of KDM3B involved in these processes. These discoveries contribute to the understanding of the function and mechanism of KDM3B and provide a novel target for the regulation of MSCs and promoted MSC-mediated bone and tooth regeneration.
Acknowledgments
This work was supported by grants from the National Natural Science Foundation of China (81625005 to Z.P.F.), the CAMS Innovation Fund for Medical Sciences (2019-I2M-5-031 to Z.P.F.), and the Beijing Key Laboratory of Tooth Regeneration and Function Reconstruction (KFKT2019012).
Contributor Information
Zhipeng Fan, Email: zpfan@ccmu.edu.cn.
Jianpeng Zhang, Email: jianpeng-0527@163.com.
Data Availability
The data used to support the findings of this study are included within the article.
Conflicts of Interest
The authors declared that they have no competing interests.
Supplementary Materials
Figure 1:The cell image under the microscope
Table 1:The differentially expressed genes in KDM3B overexpressed SCAPs compared with control group
Table 2:The upregulated and downregulated pathways in KDM3B over-expressed SCAPs
Table 3:The significant pathways enriched by path-net in KDM3B over-expressed SCAPs
Table 4:The 12 core genes enriched by signal-net in KDM3B over-expressed SCAPs
References
- 1.Smith B. T., Shum J., Wong M., Mikos A. G., Young S. Bone tissue engineering challenges in oral & maxillofacial surgery. Advances in Experimental Medicine and Biology. 2015;881:57–78. doi: 10.1007/978-3-319-22345-2_4. [DOI] [PubMed] [Google Scholar]
- 2.Kang J., Fan W., Deng Q., He H., Huang F. Stem cells from the apical papilla: a promising source for stem cell-based therapy. BioMed Research International. 2019;2019:8. doi: 10.1155/2019/6104738.6104738 [DOI] [PMC free article] [PubMed] [Google Scholar]
- 3.Aghebati-Maleki L., Dolati S., Zandi R., et al. Prospect of mesenchymal stem cells in therapy of osteoporosis: a review. Journal of Cellular Physiology. 2018;234(6):8570–8578. doi: 10.1002/jcp.27833. [DOI] [PubMed] [Google Scholar]
- 4.Teitelbaum S. L. Stem cells and osteoporosis therapy. Cell Stem Cell. 2010;7(5):553–554. doi: 10.1016/j.stem.2010.10.004. [DOI] [PubMed] [Google Scholar]
- 5.Sharpe P. T. Dental mesenchymal stem cells. Development. 2016;143(13):2273–2280. doi: 10.1242/dev.134189. [DOI] [PubMed] [Google Scholar]
- 6.Cui D., Li H., Wan M., et al. The origin and identification of mesenchymal stem cells in teeth: from odontogenic to non-odontogenic. Current Stem Cell Research & Therapy. 2018;13(1):39–45. doi: 10.2174/1574888X12666170913150403. [DOI] [PubMed] [Google Scholar]
- 7.Wang L., Yang H., Lin X., et al. KDM1A regulated the osteo/dentinogenic differentiation process of the stem cells of the apical papilla via binding with PLOD2. Cell Proliferation. 2018;51(4, article e12459) doi: 10.1111/cpr.12459. [DOI] [PMC free article] [PubMed] [Google Scholar]
- 8.Ge K. Epigenetic regulation of adipogenesis by histone methylation. Biochimica et Biophysica Acta. 2012;1819(7):727–732. doi: 10.1016/j.bbagrm.2011.12.008. [DOI] [PMC free article] [PubMed] [Google Scholar]
- 9.Li J., Zhu S., Ke X. X., Cui H. Role of several histone lysine methyltransferases in tumor development. Biomed Rep. 2016;4(3):293–299. doi: 10.3892/br.2016.574. [DOI] [PMC free article] [PubMed] [Google Scholar]
- 10.Walport L. J., Hopkinson R. J., Schofield C. J. Mechanisms of human histone and nucleic acid demethylases. Current Opinion in Chemical Biology. 2012;16(5-6):525–534. doi: 10.1016/j.cbpa.2012.09.015. [DOI] [PubMed] [Google Scholar]
- 11.Park S. Y., Park J. W., Chun Y. S. Jumonji histone demethylases as emerging therapeutic targets. Pharmacological Research. 2016;105:146–151. doi: 10.1016/j.phrs.2016.01.026. [DOI] [PubMed] [Google Scholar]
- 12.Ye L., Fan Z., Yu B., et al. Histone demethylases KDM4B and KDM6B promotes osteogenic differentiation of human MSCs. Cell Stem Cell. 2012;11(1):50–61. doi: 10.1016/j.stem.2012.04.009. [DOI] [PMC free article] [PubMed] [Google Scholar]
- 13.Liu D., Wang Y., Jia Z., et al. Demethylation of IGFBP5 by histone demethylase KDM6B promotes mesenchymal stem cell-mediated periodontal tissue regeneration by enhancing osteogenic differentiation and anti-inflammation potentials. Stem Cells. 2015;33(8):2523–2536. doi: 10.1002/stem.2018. [DOI] [PubMed] [Google Scholar]
- 14.Xu J., Yu B., Hong C., Wang C. Y. KDM6B epigenetically regulates odontogenic differentiation of dental mesenchymal stem cells. International Journal of Oral Science. 2013;5(4):200–205. doi: 10.1038/ijos.2013.77. [DOI] [PMC free article] [PubMed] [Google Scholar]
- 15.Du J., Ma Y., Ma P., Wang S., Fan Z. Demethylation of epiregulin gene by histone demethylase FBXL11 and BCL6 corepressor inhibits osteo/dentinogenic differentiation. Stem Cells. 2013;31(1):126–136. doi: 10.1002/stem.1255. [DOI] [PubMed] [Google Scholar]
- 16.Yang H., Fan J., Cao Y., Gao R., Fan Z. Distal-less homeobox 5 promotes the osteo-/dentinogenic differentiation potential of stem cells from apical papilla by activating histone demethylase KDM4B through a positive feedback mechanism. Experimental Cell Research. 2019;374(1):221–230. doi: 10.1016/j.yexcr.2018.11.027. [DOI] [PubMed] [Google Scholar]
- 17.Wang C., Wang J., Li J., et al. KDM5A controls bone morphogenic protein 2-induced osteogenic differentiation of bone mesenchymal stem cells during osteoporosis. Cell Death & Disease. 2016;7(8, article e2335) doi: 10.1038/cddis.2016.238. [DOI] [PMC free article] [PubMed] [Google Scholar]
- 18.Hemming S., Cakouros D., Isenmann S., et al. EZH2 and KDM6A act as an epigenetic switch to regulate mesenchymal stem cell lineage specification. Stem Cells. 2014;32(3):802–815. doi: 10.1002/stem.1573. [DOI] [PubMed] [Google Scholar]
- 19.An M. J., Kim D. H., Kim C. H., et al. Histone demethylase KDM3B regulates the transcriptional network of cell-cycle genes in hepatocarcinoma HepG2 cells. Biochemical and Biophysical Research Communications. 2019;508(2):576–582. doi: 10.1016/j.bbrc.2018.11.179. [DOI] [PubMed] [Google Scholar]
- 20.Wang J.-J., Dong R., Wang L.-P., et al. Histone demethylase KDM2B inhibits the chondrogenic differentiation potentials of stem cells from apical papilla. International Journal of Clinical and Experimental Medicine. 2015;8(2):2165–2173. [PMC free article] [PubMed] [Google Scholar]
- 21.Gao R., Dong R., Du J., Ma P., Wang S., Fan Z. Depletion of histone demethylase KDM2A inhibited cell proliferation of stem cells from apical papilla by de-repression of p15INK4B and p27Kip1. Molecular and Cellular Biochemistry. 2013;379(1-2):115–122. doi: 10.1007/s11010-013-1633-7. [DOI] [PubMed] [Google Scholar]
- 22.Li S., Ali S., Duan X., et al. JMJD1B demethylates H4R3me2s and H3K9me2 to facilitate gene expression for development of hematopoietic stem and progenitor cells. Cell Reports. 2018;23(2):389–403. doi: 10.1016/j.celrep.2018.03.051. [DOI] [PMC free article] [PubMed] [Google Scholar]
- 23.Kim J.-Y., Kim K.-B., Eom G. H., et al. KDM3B is the H3K9 demethylase involved in transcriptional activation of lmo2 in leukemia. Molecular and Cellular Biology. 2012;32(14):2917–2933. doi: 10.1128/MCB.00133-12. [DOI] [PMC free article] [PubMed] [Google Scholar]
- 24.Ebata K. T., Mesh K., Liu S., et al. Vitamin C induces specific demethylation of H3K9me2 in mouse embryonic stem cells via Kdm3a/b. Epigenetics & Chromatin. 2017;10(1):p. 36. doi: 10.1186/s13072-017-0143-3. [DOI] [PMC free article] [PubMed] [Google Scholar]
- 25.Jiang Y., Li C., Wu Q., et al. Iron-dependent histone 3 lysine 9 demethylation controls B cell proliferation and humoral immune responses. Nature Communications. 2019;10(1):p. 2935. doi: 10.1038/s41467-019-11002-5. [DOI] [PMC free article] [PubMed] [Google Scholar]
- 26.Kuroki S., Nakai Y., Maeda R., et al. Combined loss of JMJD1A and JMJD1B reveals critical roles for H3K9 demethylation in the maintenance of embryonic stem cells and early embryogenesis. Stem Cell Reports. 2018;10(4):1340–1354. doi: 10.1016/j.stemcr.2018.02.002. [DOI] [PMC free article] [PubMed] [Google Scholar]
- 27.Kota S. K., Roening C., Patel N., Kota S. B., Baron R. PRMT5 inhibition promotes osteogenic differentiation of mesenchymal stromal cells and represses basal interferon stimulated gene expression. Bone. 2018;117:37–46. doi: 10.1016/j.bone.2018.08.025. [DOI] [PMC free article] [PubMed] [Google Scholar]
- 28.Yu G., Wang J., Lin X., et al. Demethylation of SFRP2 by histone demethylase KDM2A regulated osteo-/dentinogenic differentiation of stem cells of the apical papilla. Cell Proliferation. 2016;49(3):330–340. doi: 10.1111/cpr.12256. [DOI] [PMC free article] [PubMed] [Google Scholar]
- 29.Yang H., Liang Y., Cao Y., Cao Y., Fan Z. Homeobox C8 inhibited the osteo-/dentinogenic differentiation and migration ability of stem cells of the apical papilla via activating KDM1A. Journal of Cellular Physiology. 2020 doi: 10.1002/jcp.29687. [DOI] [PubMed] [Google Scholar]
- 30.Zhang J., Zhang C., Yang H., Han X., Fan Z., Hou B. Depletion of PRDM9 enhances proliferation, migration and chemotaxis potentials in human periodontal ligament stem cells. Connective Tissue Research. 2020;61(5):498–508. doi: 10.1080/03008207.2019.1620224. [DOI] [PubMed] [Google Scholar]
- 31.Ballini A., Boccaccio A., Saini R., Van Pham P., Tatullo M. Dental-derived stem cells and their secretome and interactions with bioscaffolds/biomaterials in regenerative medicine: from the in vitro research to translational applications. Stem Cells International. 2017;2017:3. doi: 10.1155/2017/6975251.6975251 [DOI] [PMC free article] [PubMed] [Google Scholar]
- 32.Ballini A., Di Benedetto A., De Vito D., et al. Stemness genes expression in naïve vs. osteodifferentiated human dental-derived stem cells. European Review for Medical and Pharmacological Sciences. 2019;23(7):2916–2923. doi: 10.26355/eurrev_201904_17570. [DOI] [PubMed] [Google Scholar]
- 33.Munehira Y., Yang Z., Gozani O. Systematic analysis of known and candidate lysine demethylases in the regulation of myoblast differentiation. Journal of Molecular Biology. 2017;429(13):2055–2065. doi: 10.1016/j.jmb.2016.10.004. [DOI] [PMC free article] [PubMed] [Google Scholar]
- 34.Chen S., Gluhak-Heinrich J., Wang Y. H., et al. Runx2, osx, and dspp in tooth development. Journal of Dental Research. 2009;88(10):904–909. doi: 10.1177/0022034509342873. [DOI] [PMC free article] [PubMed] [Google Scholar]
- 35.Hirata A., Sugahara T., Nakamura H. Localization of runx2, osterix, and osteopontin in tooth root formation in rat molars. The Journal of Histochemistry and Cytochemistry. 2008;57(4):397–403. doi: 10.1369/jhc.2008.952192. [DOI] [PMC free article] [PubMed] [Google Scholar]
- 36.Zhang W., Walboomers X. F., van Osch G. J. V. M., van den Dolder J., Jansen J. A. Hard tissue formation in a porous HA/TCP ceramic scaffold loaded with stromal cells derived from dental pulp and bone marrow. Tissue Engineering. Part A. 2008;14(2):285–294. doi: 10.1089/tea.2007.0146. [DOI] [PubMed] [Google Scholar]
- 37.Verdelis K., Ling Y., Sreenath T., et al. DSPP effects on in vivo bone mineralization. Bone. 2008;43(6):983–990. doi: 10.1016/j.bone.2008.08.110. [DOI] [PMC free article] [PubMed] [Google Scholar]
- 38.Suzuki S., Sreenath T., Haruyama N., et al. Dentin sialoprotein and dentin phosphoprotein have distinct roles in dentin mineralization. Matrix Biology. 2009;28(4):221–229. doi: 10.1016/j.matbio.2009.03.006. [DOI] [PMC free article] [PubMed] [Google Scholar]
- 39.Ballini A., Cantore S., Scacco S., et al. A comparative study on different stemness gene expression between dental pulp stem cells vs. dental bud stem cells. European Review for Medical and Pharmacological Sciences. 2019;23(4):1626–1633. doi: 10.26355/eurrev_201902_17122. [DOI] [PubMed] [Google Scholar]
- 40.Kamran M. Z., Patil P., Gude R. P. Role of STAT3 in cancer metastasis and translational advances. BioMed Research International. 2013;2013:15. doi: 10.1155/2013/421821.421821 [DOI] [PMC free article] [PubMed] [Google Scholar]
- 41.Bellido T., Borba V. Z., Roberson P., Manolagas S. C. Activation of the Janus kinase/STAT (signal transducer and activator of transcription) signal transduction pathway by interleukin-6-type cytokines promotes osteoblast differentiation. Endocrinology. 1997;138(9):3666–3676. doi: 10.1210/endo.138.9.5364. [DOI] [PubMed] [Google Scholar]
- 42.Popielarczyk T. L., Huckle W. R., Barrett J. G. Human bone marrow-derived mesenchymal stem cells home via the PI3K-Akt, MAPK, and Jak/Stat signaling pathways in response to platelet-derived growth factor. Stem Cells and Development. 2019;28(17):1191–1202. doi: 10.1089/scd.2019.0003. [DOI] [PubMed] [Google Scholar]
- 43.Wang P., Zhang Z. Bone marrow-derived mesenchymal stem cells promote healing of rabbit tibial fractures via JAK-STAT signaling pathway. Experimental and Therapeutic Medicine. 2020;19(3):2310–2316. doi: 10.3892/etm.2020.8441. [DOI] [PMC free article] [PubMed] [Google Scholar]
- 44.Ramos-García P., Gil-Montoya J. A., Scully C., et al. An update on the implications of cyclin D1 in oral carcinogenesis. Oral Diseases. 2017;23(7):897–912. doi: 10.1111/odi.12620. [DOI] [PubMed] [Google Scholar]
- 45.Yu L., Ye F., Li Y.-Y., et al. Histone methyltransferase SETDB1 promotes colorectal cancer proliferation through the STAT1-CCND1/CDK6 axis. Carcinogenesis. 2020;41(5):678–688. doi: 10.1093/carcin/bgz131. [DOI] [PubMed] [Google Scholar]
- 46.Mastri M., Shah Z., McLaughlin T., et al. Activation of Toll-like receptor 3 amplifies mesenchymal stem cell trophic factors and enhances therapeutic potency. American Journal of Physiology-Cell Physiology. 2012;303(10):C1021–C1033. doi: 10.1152/ajpcell.00191.2012. [DOI] [PMC free article] [PubMed] [Google Scholar]
- 47.Raicevic G., Najar M., Pieters K., et al. Inflammation and Toll-like receptor ligation differentially affect the osteogenic potential of human mesenchymal stromal cells depending on their tissue origin. Tissue Engineering. Part A. 2012;18(13-14):1410–1418. doi: 10.1089/ten.tea.2011.0434. [DOI] [PubMed] [Google Scholar]
- 48.Jarrett M. J., Yao Q., Venardos N., et al. Simvastatin down-regulates osteogenic response in cultured human aortic valve interstitial cells. The Journal of Thoracic and Cardiovascular Surgery. 2019 doi: 10.1016/j.jtcvs.2019.10.081. [DOI] [PubMed] [Google Scholar]
- 49.Pevsner-Fischer M., Morad V., Cohen-Sfady M., et al. Toll-like receptors and their ligands control mesenchymal stem cell functions. Blood. 2006;109(4):1422–1432. doi: 10.1182/blood-2006-06-028704. [DOI] [PubMed] [Google Scholar]
- 50.Park G. C., Song J. S., Park H.-Y., et al. Role of fibroblast growth factor-5 on the proliferation of human tonsil-derived mesenchymal stem cells. Stem Cells and Development. 2016;25(15):1149–1160. doi: 10.1089/scd.2016.0061. [DOI] [PubMed] [Google Scholar]
- 51.Pavón M. A., Arroyo-Solera I., Céspedes M. V., Casanova I., León X., Mangues R. uPA/uPAR and SERPINE1 in head and neck cancer: role in tumor resistance, metastasis, prognosis and therapy. Oncotarget. 2016;7(35):57351–57366. doi: 10.18632/oncotarget.10344. [DOI] [PMC free article] [PubMed] [Google Scholar]
Associated Data
This section collects any data citations, data availability statements, or supplementary materials included in this article.
Supplementary Materials
Figure 1:The cell image under the microscope
Table 1:The differentially expressed genes in KDM3B overexpressed SCAPs compared with control group
Table 2:The upregulated and downregulated pathways in KDM3B over-expressed SCAPs
Table 3:The significant pathways enriched by path-net in KDM3B over-expressed SCAPs
Table 4:The 12 core genes enriched by signal-net in KDM3B over-expressed SCAPs
Data Availability Statement
The data used to support the findings of this study are included within the article.