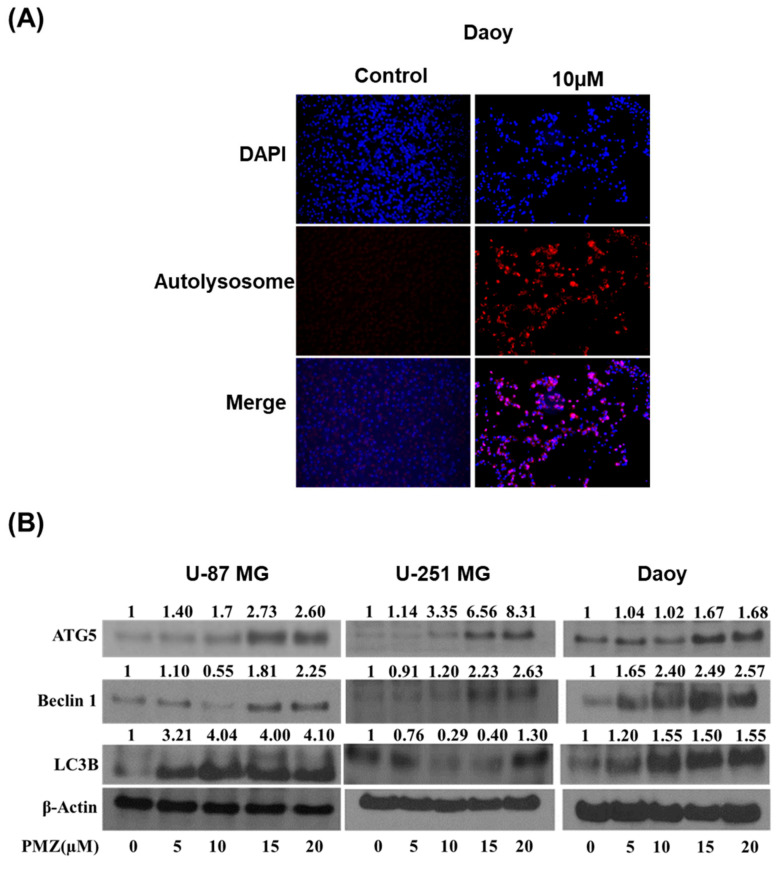
Figure 6.
Production of autolysosome by pimozide treatment. (A) Approximately 0.2 million Daoy cells were plated in a six-well plate. Daoy cells were treated with 10 µM of pimozide. After 48 h of pimozide treatment, cells were stained with NucBlue followed by staining with 0.4 µg/mL acridine orange. Images were taken using a florescence microscope. Blue florescence represents DAPI, whereas red represents the formation of autophagolysosomes. (B) Approximately 0.7 million U-87 MG, Daoy, and U-251 MG cells were treated with different concentrations of pimozide for 48 h. Representative blots show the concentration-dependent effect of pimozide on ATG5, Beclin1, LC3B, cleaved caspase 3, and cleaved PARP expression. β-actin was used as a loading control. Figures shown are the representative blots of at least three independent experiments.

