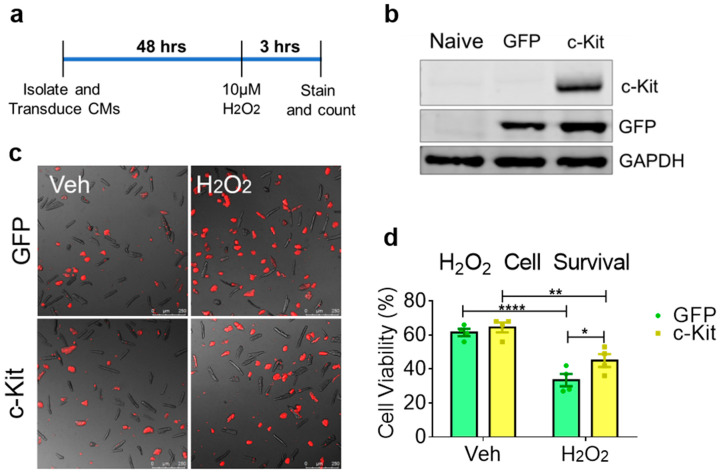
Figure 4.
Cardiomyocytes with elevated c-Kit expression demonstrate enhanced resistance against oxidative stress. (a) Schematic showing the treatment procedure. (b) Immunoblot analysis of isolated cardiomyocytes transduced with GFP or c-Kit-GFP. (c) Fluorescent images of TO-PRO-3 staining on GFP or c-Kit-expressing cardiomyocytes treated with vehicle or H2O2 overlaid with brightfield images depicting dead or dying cells in red. (d) Quantification of cell viability counted from fluorescent images. N = 4, 300–600 cardiomyocytes counted per group, error bars represent SEM, * p < 0.05, ** p < 0.01 and **** p < 0.0001 as measured by two-way ANOVA multiple comparison with Tukey.

