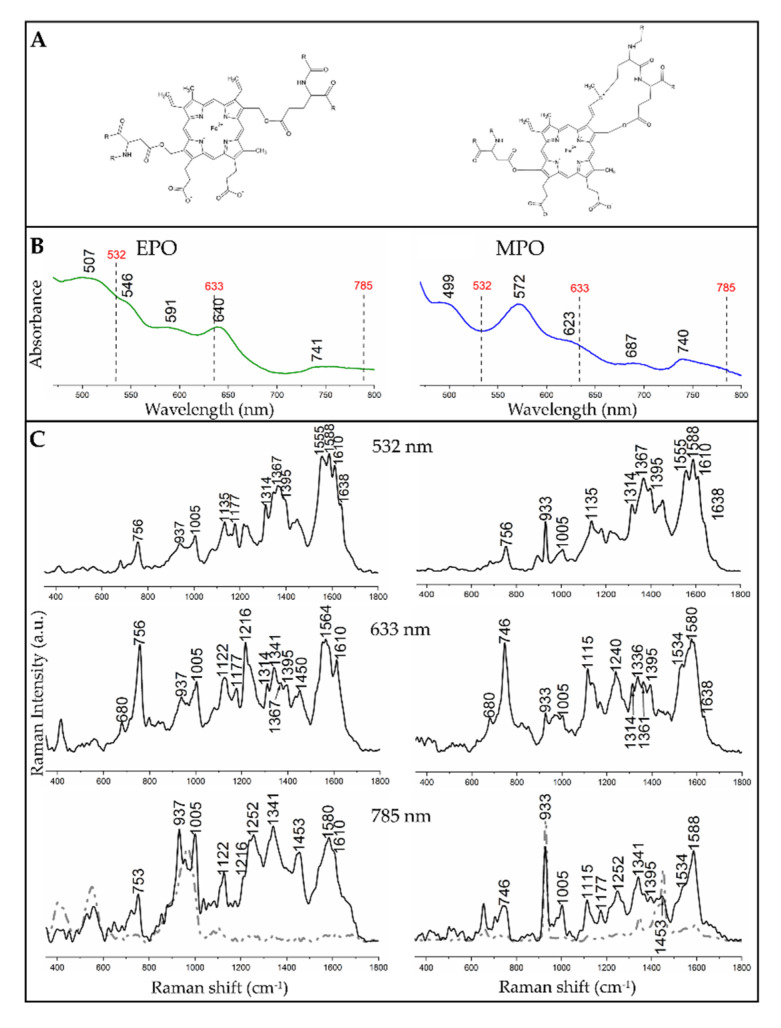
Figure 1.
Spectral characteristics of neat eosinophil peroxidase (EPO, left) and myeloperoxidase (MPO, right) with their molecular structures. (A) Structures of the proteins. (B) UV−Vis absorption spectra of EPO and MPO (strong Soret bands at ca. 410–420 nm were not displayed to improve visibility of absorption bands in the region of the used excitation lines). (C) Raman spectra of EPO and MPO solutions collected with different excitation wavelengths. For the 785 nm laser excitation, the black trace represents the spectra of the solids, while the grey dashed lines are the spectra of the solutions.

