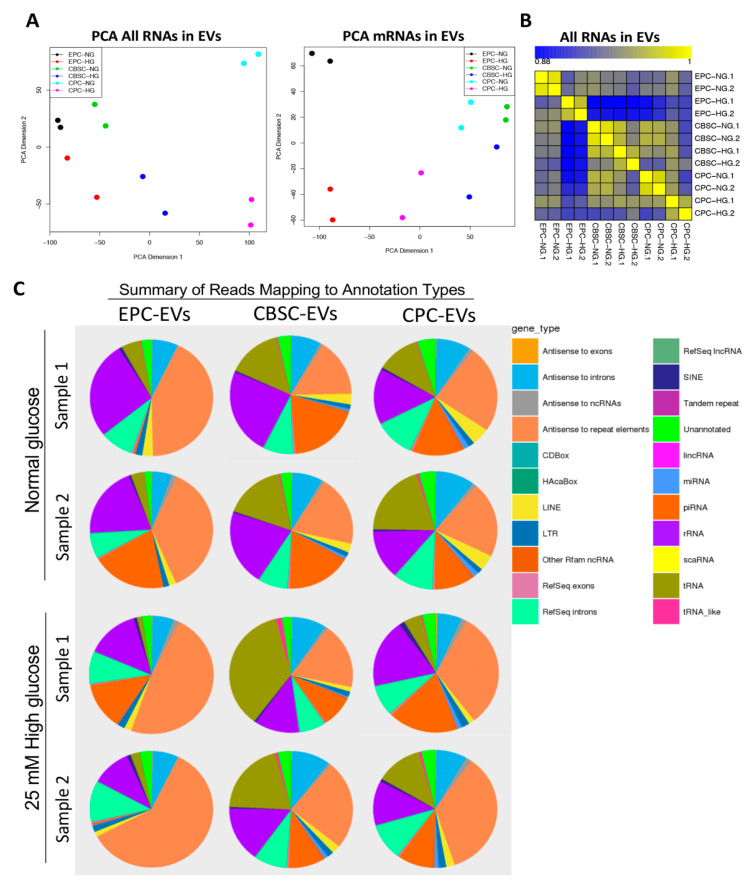
Figure 2.
Whole transcriptome analysis of EPC-, CPC-, and CBSC-derived EVs and gene annotation types. (A) All EV RNA-seq data were processed using multi-dimensional scaling. Each dot represents a biological duplicate. (B) Pearson correlation of RNA-seq data. (C) Pie chart represents the fraction of each RNA type constitutes of total RNA content in EVs of EPC, CPC, and CBSC under NG and HG conditions.

