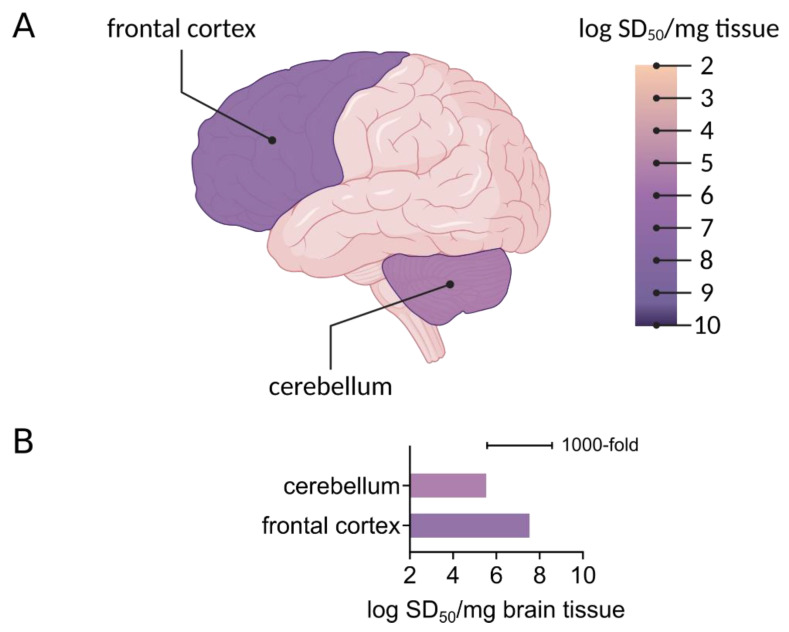
Figure 3.
Regional seeding activity detected by RT-QuIC. (A) A 3R/4R tau RT-QuIC assay was used to measure seeding activity in the frontal cortex and cerebellum in AD cases. Endpoint dilution analysis was used to determine seeding dose (SD50)/mg brain tissue, shown here on a logarithmic scale. Brain regions are colored as per average log SD50. Figure created with Biorender.com. (B) A bar graph shows the average logarithmic SD50 values determined in distinct brain regions as indicated from two AD cases.

