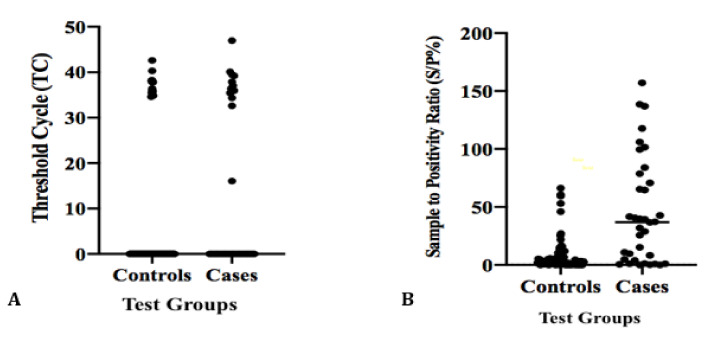
Figure 9.
Scatterplots of the distribution of 128 milk samples (MIF) in two categories of healthy controls (HCs) and MAP-infected cases tested by MqPCR (A) and MELISA (B). HCs were adjusted based on the results of both SELISA and FPCR tests. The threshold cycle corresponding to MqPCR positivity was determined as being between 16 and 46 cycles (A), whereas the S/P% corresponding to MELISA positivity was between 31.93% and 157.11% (B).

