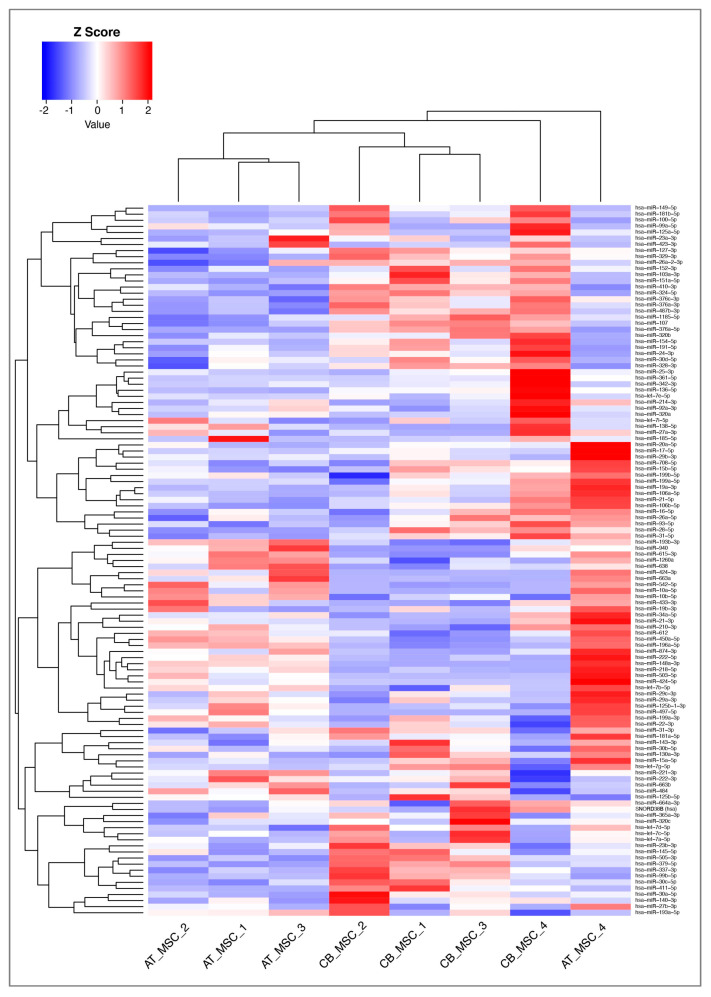
Figure 5.
Heatmap and dendrograms of all microRNAs (miRNAs) detected with certainty according to the guidelines of the Qiagen-Exiqon miRCURY LNA Universal RT microRNA PCR system. Sample IDs are shown on the x-axis. Samples with similar miRNA expression are clustered together. The heatmap was generated by RStudio and 2dCT was used for data input. Z-scores of more than zero indicate a higher expression of miRNAs in one sample compared to the others; Z-scores of less than zero indicate the opposite.

