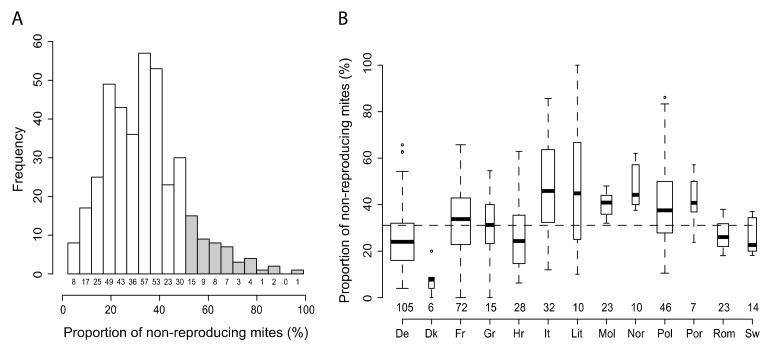
Figure 2.
Distribution of the suppression of mite reproduction (SMR) score within Europe. (A) Histogram of distribution of the total data and (B) SMR scores by country for each of the 13 sampled countries. Grey histogram bars indicate colonies with a varroa-resistance potential (SMR score ≥50%). Boxplot widths are proportional to the sample size which is indicated below each bar or plot. The dashed line represents the average SMR score among the sampled European countries. ° Indicate data points distributed outside 1.5 interquartile space.

