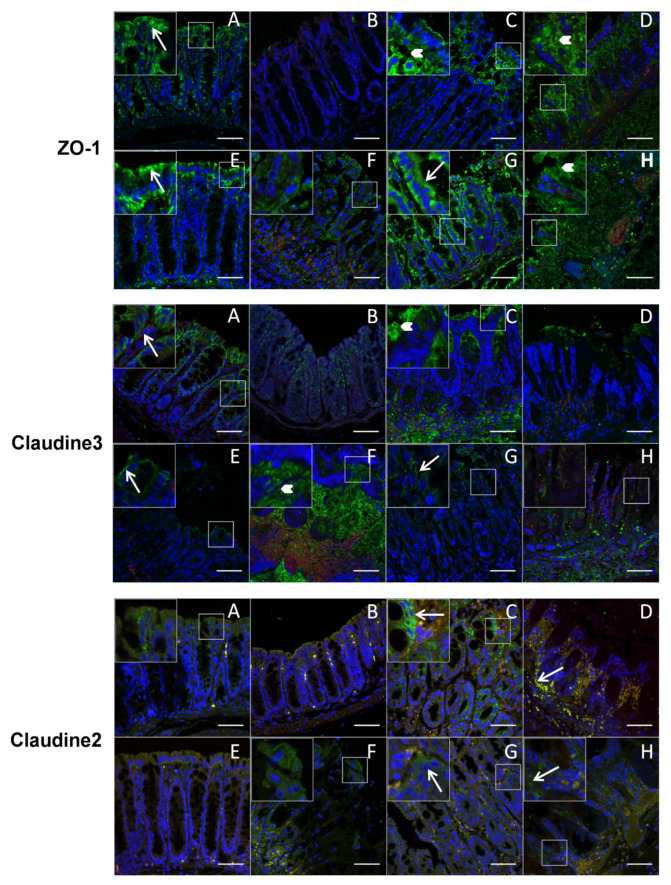
Figure 6.
Ability of the strains to modulate tight junction proteins in the colon. Representative immunofluorescent images of ZO-1, Claudin-3 and Claudin-2 of colon sections of the different groups of mice (A): healthy mice; (B): ethanol, (C): TNBS; (D): TNBS+PF-BaE7; (E): TNBS+PF-BaE11; (F): TNBS+AS93; (G): TNBS+PF-BaE5 and (H): TNBS+AS23, observed by immunofluorescence and confocal microscopy after labeling with specific primary antibodies and AF488-conjugated secondary antibody (green), with nuclei counterstained with DAPI (blue) stain. A red canal was added to identify autofluorescence tissue elements (red/yellow) and reinforce the specific labeling. Boxed areas represent magnified images (×2.5) as insets from the corresponding white box. Long arrows indicate normal TJ (ZO-1 and Claudin-3) distribution at the apical and lateral levels and labeling for Claudin-2; short arrows indicate discontinuities or diffuse cytoplasmic distribution of TJ. Scale bars 50 μm.

