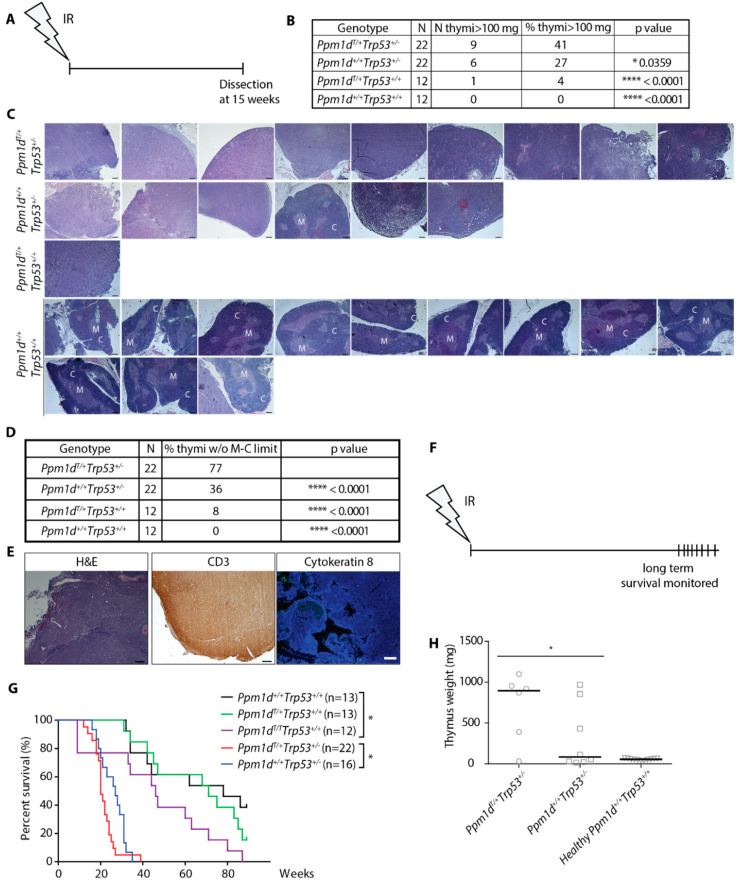
Figure 3.
Truncated PPM1D promotes formation of IR-induced lymphoma in mice. Schematic of the experimental setup. At 8–10 weeks of age, mice were exposed to a single dose of ionizing radiation (4 Gy) and followed for another 15 weeks when they were sacrificed and subjected to autopsy. Thymi were evaluated by histology (A). Mice of indicated genotypes were treated as in A. Percentage of thymi of abnormal weight (>100 mg) was scored. n value indicates the number of animals in each experimental group. Statistical significance to the Ppm1dT/+Trp53+/− was determined by Fisher’s one-tailed exact test, * p < 0.05; **** p < 0.0001. (B). H&E staining of the enlarged thymi from mice in A and B. Representative images of thymi considered to be enlarged are shown for genotypes Ppm1d+/−, Trp53+/−, and Ppm1dT/+Trp53+/− mice and all thymi from the wild-type mice are shown. Regions of the cortex (C) and medulla (M) are indicated. Magnification 5×, scale bar indicates 200 µm (C). Quantification of delineation between cortex and medulla from the experiment in C. Multiple sections were evaluated to cover the whole thymus. Statistical significance to the Ppm1dT/+Trp53+/− was determined by Fisher’s one-tailed exact test, **** p < 0.0001. (D). Representative images of a thymic tumor from B are shown. Section of the thymus was stained with H&E, or an antibody against CD3 (T-cell marker) or cytokeratin 8 (stromal marker) (E). Schematic of the experimental setup in G-H (F). Mice of indicated genotypes were exposed to a single dose of IR (4 Gy) and their survival was followed in time. n values indicate the numbers of animals of each genotype. Statistical significance of the Kaplan-Meier survival plot was determined by a log-rank test, * p < 0.05. (G). Terminally moribund mice from G were sacrificed, dissected, and median size of thymi was determined. Statistical significance was determined by the one-tailed t-test (p = 0.045) (H).

