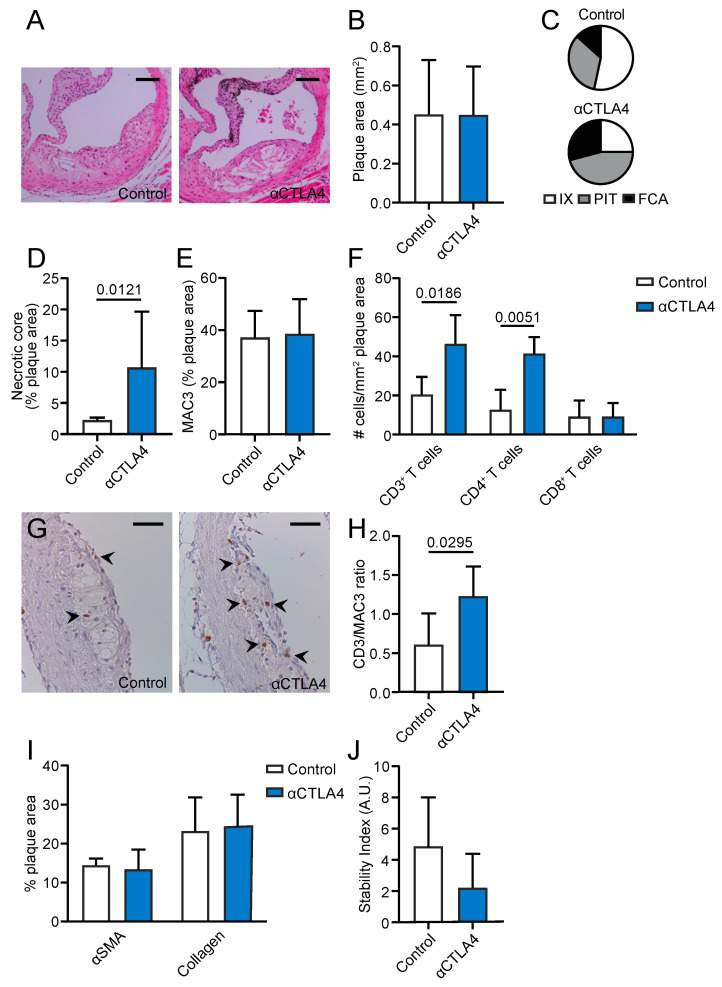
Figure 4.
Antibody-mediated inhibition of CTLA4 promotes the progression of atherosclerosis in the aortic root. (A) Representative pictures of plaques in the aortic root (haematoxylin and eosin staining). Scale bar: 200 μm. (B) Atherosclerotic plaque area in the aortic root (n = 5–9). (C) Morphological analysis of the atherosclerotic plaque phenotype according to the Virmani Classification. (D) Quantification of necrotic core area in plaques. (E) Quantification of plaque macrophage content. (F) Immunohistochemical quantification of CD3+, CD4+, and CD8+ cells. (G) Representative pictures of CD3+ cells in the plaque. Scale bar: 150μm. (H) The CD3/MAC3 ratio in the plaques. (I) Quantification of smooth muscle actin and collagen content in the plaques. (J) The stability index (smooth muscle actin positive area %/necrotic core area %). FCA = fibrous cap atheroma, IX = intimal xanthoma, PIT = pathological intimal thickening.

