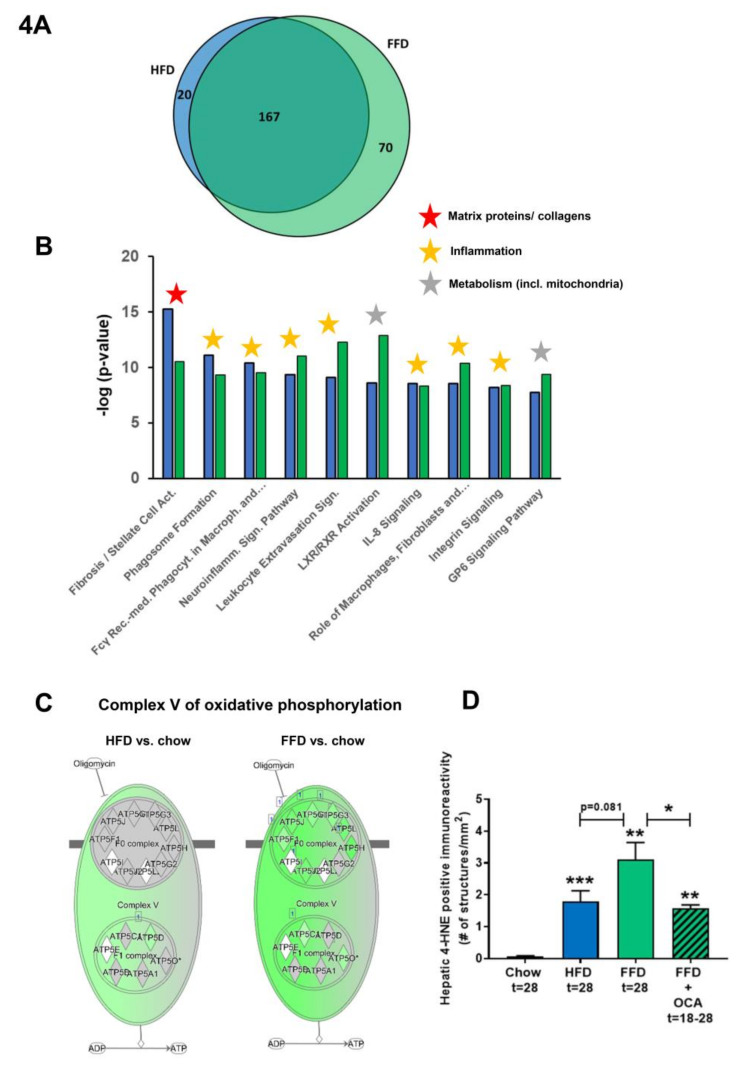
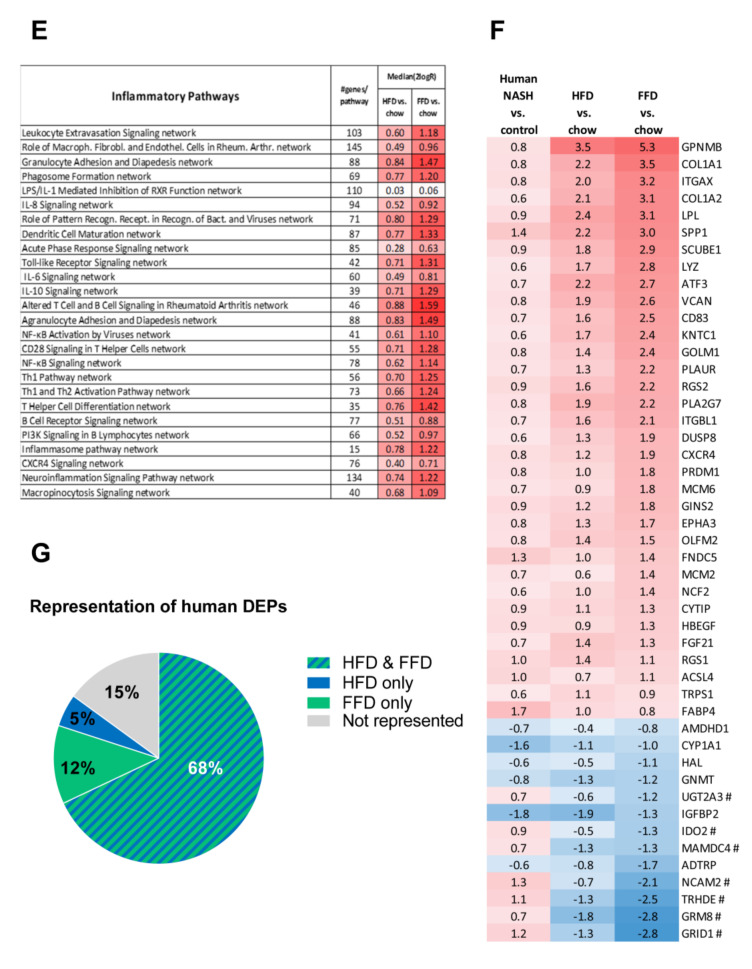
Figure 4.
Venn diagram (A) illustrating the overlap of differentially expressed pathways (pathway pval < 0.01) of livers between Ldlr−/−.Leiden mice fed a high-fat diet (HFD) vs. healthy chow diet (blue circle) or fed a fast food diet (FFD) vs. healthy chow diet (green circle) for 28 weeks. N ≥ 8 mice per group. The shared top 10 of significantly enriched biological processes (−log (p-value)) for the genes affected by HFD (blue bars) and FFD (green bars) vs. chow (B). Differences between HFD and FFD in downregulation of ATP synthases in complex V of oxidative phosphorylation (C). Quantification of 4-hydroxynonenal (4-HNE) marker of oxidative stress using stained liver sections ** p < 0.01 and *** p < 0.001 vs. chow or * p < 0.05 FFD + OCA vs. FFD t = 28 (as indicated by bar) (D). Effect of HFD and FFD on different inflammatory pathways, expressed as median (2logR) of all genes in the listed inflammatory pathway (E). Heatmap showing expression of genes differentially regulated in human non-alcoholic steatohepatitis (NASH) vs. normal controls [6] in Ldlr−/−.Leiden mice fed the HFD or FFD for 28 weeks relative to chow (F). Blue color indicates downregulation, and red color indicates upregulation. Genes with # indicate genes with differential regulation vs. human regulation. Visualization (G) of the differentially expressed pathways (DEPs) distinguishing human NASH patients vs. normal controls and representation thereof in the mice on HFD or FFD.


