

Abstract
Background and Aim:
Campylobacter species have been recognized as the most frequently identified bacterial cause of human gastroenteritis. The aims of this study were to identify Campylobacter jejuni and Campylobacter coli species isolated from chicken meat and to analyze the differences in the melting curve patterns of both species.
Materials and Methods:
A total of 105 chicken meat samples collected from slaughterhouses and retailers in six provinces in Indonesia were examined for the isolation and identification of Campylobacter spp. A total of 56 positive isolates of Campylobacter spp. were analyzed using the quantitative real-time polymerase chain reaction and high resolution melting method.
Results:
The prevalence of Campylobacter spp. in chicken meat was found to be 61.9%. Regarding the identification, 23 isolates (41.07%) were C. jejuni, 22 (39.29%) were C. coli, six (10.71%) were a mix between C. jejuni and C. coli, and five isolates (8.93%) were Campylobacter spp. All the C. jejuni and C. coli isolates produced varied melting curve patterns.
Conclusion:
The high prevalence of C. jejuni and C. coli in chicken meat in Indonesia indicates a high risk of the incidence of campylobacteriosis in humans.
Keywords: Campylobacter coli, Campylobacter jejuni, chicken meat, glyA, hipO, melting curves
Introduction
Campylobacter spp. are the bacteria those cause foodborne disease. They are the leading cause of acute gastroenteritis in humans and have an impact on public health. Cases of infection caused due to these bacteria pose a significant economic burden. It has been observed that the incidence and prevalence of campylobacteriosis have increased in both developed and developing countries over the past 10 years [1]. These bacterial infections cause diarrhea (sometimes bloody diarrhea), abdominal pain, fever, and complications that can lead to Guillain–Barré syndrome, reactive arthritis, and inflammatory bowel diseases [2]. Campylobacteriosis in humans is primarily caused due to two species, namely, Campylobacter jejuni and Campylobacter coli [3]. C. jejuni is responsible for causing 81% of campylobacteriosis incidence in humans, whereas 8.4% of the incidence is caused due to C. coli, and the remaining 10.6% is caused due to Campylobacter lari, Campylobacter fetus, and Campylobacter upsaliensis [1]. Although reports of gastroenteritis caused due to Campylobacter spp. are rare, especially in poor and developing countries, studies conducted in developed countries have estimated an incidence of 4.4-9.3 per thousand population per year [2]. The Centers for Disease Control and Prevention estimated that approximately 9% of foodborne diseases in the United States are caused due to Campylobacter spp. and as much as 15% of campylobacteriosis cases required intensive care in hospitals [4].
Chicken meat and other poultry meats are the major sources of campylobacteriosis. Campylobacter spp. can colonize asymptomatically in chickens and are considered as commensal gastrointestinal microbiota [5]. The process of slaughtering chickens in poultry slaughterhouses creates the opportunity for cross-contamination and bacterial spread even though the hygiene of the process is well maintained [6]. Chicken meat obtained from an uninfected farm can be contaminated with Campylobacter from another farm previously slaughtered at the same poultry slaughterhouse. Research conducted in China shows a very high prevalence of 80% of Campylobacter when slaughtering poultry [7]. Routine testing for pathogenic bacteria that cause foodborne diseases such as campylobacteriosis in the food of animal origin is a critical component of food safety management. The prevalence and contamination level of Campylobacter spp. in slaughterhouses and retailers can be used in the implementation of food safety policies and the evaluation of strategies to minimize risks to consumers [8,9].
Analysis conducted using real-time polymerase chain reaction and high resolution melting (qPCR-HRM) could be an efficient and robust molecular method to distinguish variations in DNA sequences [10]. HRM is a method that involves amplification in the presence of a saturation dye using PCR, and the subsequent melting of the amplicons gradually results from an increase in temperature. The melting pattern results indicate the characteristics of the DNA formed [11]. Numerous studies in the food safety sector have demonstrated that qPCR-HRM analysis can be applied for screening genotypes and variants based on the melting points of DNA fragments of pathogenic foodborne bacteria [8,12]. The HRM technique has been used for genotyping C. jejuni and C. coli to detect and differentiate between the two species on the basis of visual interpretation of differences in the melting curve patterns [9].
Therefore, the aims of this study were to identify the species of C. jejuni and C. coli isolated from chicken meat in Indonesia and to analyze the differences in the shape of the melting curves of both species.
Materials and Methods
Ethical approval
Ethical approval was not required in this study. However, samples were collected as per the standard sample collection procedure.
Study period and location
The study was conducted from January 2018 to November 2019 at Quality Control Laboratory and Certification of Animal Products, Ministry of Agriculture, Republic of Indonesia.
Campylobacter spp. isolate samples
Chicken meat samples obtained from the Monitoring and Surveillance Program of Animal Product run by the Quality Control Laboratory and Certification of Animal Products, Ministry of Agriculture, Republic of Indonesia, were used in this study. These samples were collected from the provinces of Aceh, Lampung, Banten, Jakarta, West Java, and Central Java. The samples were collected from the poultry slaughterhouses or retailers that already possessed a Veterinary Establishment Certificate, and sampling was conducted from January to December 2018.
A total of 105 samples were obtained from the program. The samples were initially tested by screening using the Singlepath Campylobacter (Merck, UK) rapid test. Positive test results from the rapid test were confirmed using a test method based on ISO 10272-1: 2006 concerning the microbiology of food and animal feedstuff – horizontal method for detection and enumeration of Campylobacter spp. – Part 1: Detection method. The Campylobacter spp. those were identified and suitable for storage were transferred to Brucella Broth (Merck, Germany) and glycerol (Merck, Germany) medium (20%) in cryotubes (Corning, USA) and then frozen at −20°C or −80°C for further extended storage.
DNA extraction
The DNA from the isolates was extracted using the Mericon DNA Bacteria Kit (Qiagen, Germany), according to the manufacturer’s instructions. An amount of 0.2 mL of Campylobacter spp. isolate was taken from the cryotube and added to 0.8 mL of sterile phosphate-buffered saline (PBS) in a 2-mL microtube and then centrifuged at 11,900 rpm for 5 min. The resulting supernatant was removed using a pipette, and then 200 μL of sterile PBS was added to the bacterial pellet. The mixture was homogenized and centrifuged again at 11,900 rpm for 5 min. This procedure of washing the bacterial pellet was conducted until the suspension became colorless. The final step was the addition of 200 μL of Fast Lysis Buffer (Mericon DNA Bacteria Kit Qiagen, Germany). The suspension was placed in a ThermoMixer, heated at 100°C for 10 min at 800 rpm, and then incubated at room temperature for 2 min. The resulting suspension was centrifuged at 11,900 rpm for 5 min, and then 100 μL of the supernatant was transferred to a new 1.5-mL microtube and stored at −20°C or −80°C until further analysis.
Campylobacter spp. isolate analysis using qPCR-HRM
The qPCR-HRM test protocol was implemented based on the procedure used by de Boer et al. [13] and modified using the intercalating dye SYBR Green Master Mix (Kapa Biosystems, USA). The primers used in this analysis were aimed to identify the hipO gene for C. jejuni, the glyA gene for C. coli, and the 16S rDNA Campylobacter gene for Campylobacter spp. Table-1 [13] shows the DNA sequences of the primer genes used to detect the Campylobacter isolates. The PCR mixture (20 μL) consisted of 25 μL of 10-μL SYBR Green Master Mix (Kapa Biosystems, USA), 1 μL (10 pmol) of the forward and reverse primers of each gene (Kapa Biosystems, USA), 3 μL of nuclease-free water, and 5 μL of DNA template.
Table-1.
DNA sequences of the primers used for the detection of Campylobacter spp. isolates.
| Primer name | Sequences (5’-3’) | Target | Reference |
|---|---|---|---|
| Cjejuni-F2 | ATGAAGCTGTGGATTTTGCTAGTG | hipO | [13] |
| Cjejuni-R3 | AAATCCAAAATCCTCACTTGCCA | hipO | |
| Ccoli-F2 | CATATTGTAAAACCAAAGCTTATC | glyA | |
| Ccoli-R | AGTCCAGCAATGTGTGCAATG | glyA | |
| 16S-CampyF1 | CACGTGCTACAATGGCATATACA | 16G rDNA Campylobacter | |
| 16S-CampyR1 | AAATCCAAAATCCTCACTTGCCA | 16G rDNA Campylobacter |
The qPCR-HRM amplification was performed on a thermal cycler Rotor-Gene Q (Qiagen, Germany). The amplification program was conducted according to a modification of the method described by de Boer et al. [13]. Initial denaturation was performed at 95°C for 3 min, followed by 40 cycles of denaturation at 95°C for 3 s, annealing at 60°C for 30 s, and extension at 72°C for 20 s. The DNA melting program for HRM was based on Banowary et al. [9], where the measurements were conducted at a temperature of 70-90°C with a modification of the temperature increase speed of 0.1°C/s with a normalized region at 60-95°C for 5 s. The PCR analysis and the melting curve profile analysis were conducted using the Q-Rex (Qiagen, Germany) software.
All data obtained from the results of this study were analyzed descriptively. The differences in the melting curve patterns and the melting peak temperatures between the species in this study were analyzed and compared with those of C. jejuni ATCC 33291 (Microbiologic, France) and C. coli ATCCC 43478 (Microbiologic, France) as positive control references. Temperature standards for positive controls had been previously optimized (data not shown), and the melting peak temperatures were 74.5°C±0.1°C and 78.4°C±0.1°C for C. jejuni and C. coli positive controls, respectively.
All the obtained data were differentiated based on the C. jejuni isolates that produced melting curve patterns differing from those of the positive control and had a melting peak temperature other than 74.5°C±0.2°C, whereas for the C. coli isolates that produced melting curve patterns differing from those of the positive control and had melting peaks other than 78.4°C±0.2°C. This differentiation was based on Merchant-Patel et al. [14], who stated that HRM curves could be discriminated on the basis of obvious differences in the curve shape and/or on the basis of Tm, with a difference of 0.2°C being considered to be significant.
Results
Species identification of Campylobacter spp.
A total of 65 of the 105 chicken samples identified using the culture method showed positive results for Campylobacter spp., indicating a prevalence of 61.9%. The majority of positive bacterial-contaminated results exceeded 50% of the total samples collected in each province. Lampung and Jakarta were the provinces with the highest prevalence of 80% of Campylobacter spp., whereas Central Java Province had the least prevalence of 30%. A complete description of these results is provided in Table-2.
Table-2.
The number of samples that were Campylobacter spp. positive from chicken meat samples in 2018 at the quality control laboratory and certification of animal products.
| Province | Sample code | Total number of samples (n=105) | Campylobacter spp. Positive (n=65) | Percentage of Campylobacter positive samples (%) |
|---|---|---|---|---|
| Aceh | AC | 20 | 10 | 50 |
| Central Java | JTG | 10 | 3 | 30 |
| Lampung | LMP | 20 | 16 | 80 |
| Jakarta | JKT | 10 | 8 | 80 |
| West Java | JBR | 20 | 11 | 55 |
| Banten | BNT | 25 | 17 | 68 |
The positive chicken samples yielded 56 isolates that could be analyzed for species identification. The Campylobacter spp. isolates were confirmed using the qPCR-HRM method for the identification of C. jejuni and C. coli species. On the basis of these results, the identification of the Campylobacter spp. isolates indicated that 23 isolates (41.07%) were C. jejuni and 22 isolates (39.29%) were C. coli. Furthermore, there were six isolates (10.71%) that were a mix between C. jejuni and C. coli, and the remaining five isolates (8.93%) were not identified as either but were identified as Campylobacter spp.
The variation in the number of Campylobacter bacterial species in each province was different. The samples from Lampung and Banten Provinces were dominated by C. jejuni species, whereas C. coli species were predominant in samples collected from Central Java and Jakarta. The samples collected from West Java showed an equal number of C. jejuni and C. coli species; however, in Lampung Province, the samples were dominated by another species of Campylobacter. Table-3 shows the identification results.
Table-3.
Species identification results of Campylobacter spp. isolates using qPCR-HRM.
| Province | Total number of isolates | C. jejuni (%) | C. coli (%) | Campylobacter spp. (%) | Mix of C. jejuni and C. coli (%) |
|---|---|---|---|---|---|
| Aceh | 10 | 2 (20) | 1 (10) | 5 (50) | 2 (20) |
| Central Java | 3 | 0 (0) | 3 (100) | 0 (0) | 0 (0) |
| Lampung | 15 | 9 (60) | 4 (26.67) | 0 (0) | 2 (13.33) |
| Jakarta | 7 | 2 (28.57) | 5 (71.43) | 0 (0) | 0 (0) |
| West Java | 11 | 5 (45.45) | 5 (45.45) | 0 (0) | 1 (9.1) |
| Banten | 10 | 5 (50) | 4 (40) | 0 (0) | 1 (10) |
| Total (%) | 56 (100) | 23 (41.07) | 22 (39.29) | 5 (8.93) | 6 (10.71) |
qPCR-HRM=real-time polymerase chain reaction and high resolution melting, C. jejuni=Campylobacter jejuni, C. coli=Campylobacter coli
Melting curve variations of C. jejuni and C. coli
All the Campylobacter spp. isolates tested in this study were analyzed descriptively based on the obtained visible melting curve patterns and melting peak temperatures, as mentioned in the materials and methods section. Overall, this method can detect the pattern of the melting curve of each isolate with two different temperature ranges that can demonstrate the differences between C. jejuni and C. coli species in one running PCR test, as depicted in Figure-1.
Figure-1.
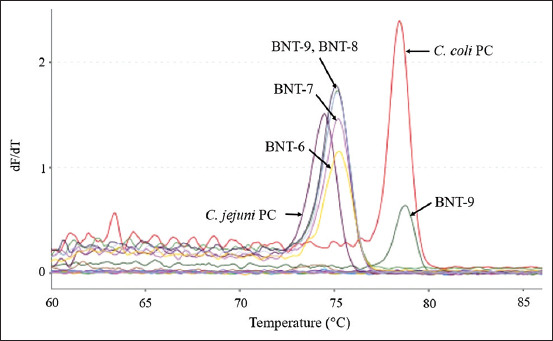
The melting curves of Campylobacter jejuni and Campylobacter coli isolates from Banten were tested using real-time polymerase chain reaction and high resolution melting. The left side is the melting curve of the C. jejuni (BNT-6, BNT-7, BNT-8, BNT-9, and C. jejuni positive control [PC]) isolates, while the right side is the melting curve of the C. coli (BNT-9 and C. coli PC) isolates.
In the present study, 18 isolates of C. jejuni were found to have different melting curve patterns and melting peak temperatures, and five isolates had similar melting curve patterns and melting peak temperatures as those of the positive control. Meanwhile, there were 13 isolates of C. coli that had different melting curve patterns and melting peak temperatures, and there were nine isolates of C. coli that had similar melting curve patterns and peak temperatures as those of the positive control. These results are described in Table-4.
Table-4.
The total number of C. jejuni and C. coli isolates distinguished by melting curves and melt peak temperatures compared to the positive control.
| Campylobacter species | Melting curve pattern | |
|---|---|---|
| Similar | Different | |
| C. jejuni (n=23) | 5 | 18 |
| C. coli (n=22) | 9 | 13 |
| Mix of C. jejuni and C. coli (n=6) | 2 | 4 |
C. jejuni=Campylobacter jejuni, C. coli=Campylobacter coli
Comparison of the melting curve patterns between the C. jejuni isolates and the positive control showed differences in isolates from Aceh, Lampung, Jakarta, West Java, and Banten Provinces. Similarity to the positive control was observed in isolates from Aceh, Lampung, and West Java Provinces. Variations based on the differences in melting curve patterns were detected in the C. jejuni isolates from West Java Province (JBR-1, JBR-2, JBR-6, JBR-7, and JBR-8). These results are depicted in Figures-2 and 3. The C. jejuni isolates from Banten Province (BNT-6, BNT-7, BNT-8, and BNT 9) also appeared to have different melting curve patterns compared with the positive control, as illustrated in Figure-4. Similar melting curve patterns as those of the positive control were detected in the C. jejuni isolates originating from West Java Province (JBR-9), as shown in Figure-5a.
Figure-2.
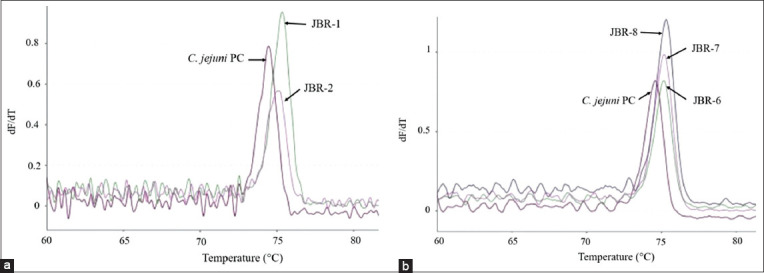
Campylobacter jejuni isolates from West Java (JBR) that showed variation in their melting curves. The melt peak temperatures for isolates JBR-1 and JBR-2 were 75.3°C and 74.9°C (a), JBR-6, JBR-7, and JBR-8 were 75.1°C (b), and the positive control for C. jejuni was 74.5°C.
Figure-3.
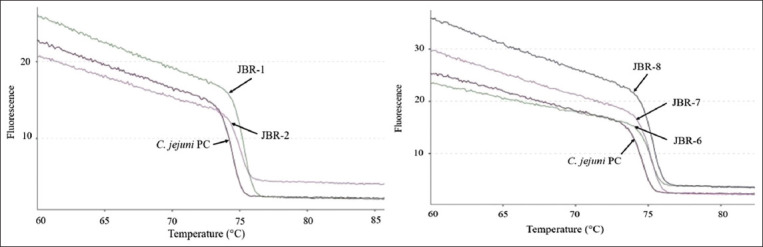
Normalized melting curve of Campylobacter jejuni isolates from West Java (JBR) and the C. jejuni positive control.
Figure-4.
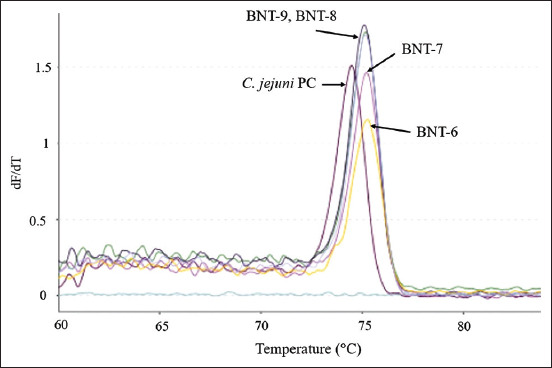
Campylobacter jejuni isolates from Banten (BNT) that showed variations in their melting curves. The melt peak temperatures for isolates BNT-6, BNT-7, and JBR-8 were 75.2°C, while BNT-9 was 75.1°C, and the positive control for C. jejuni was 74.5°C.
Figure-5.
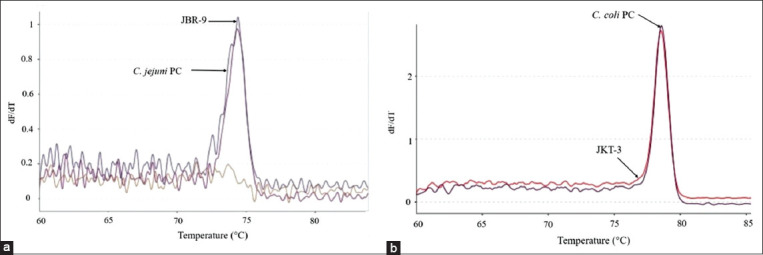
Campylobacter jejuni isolate from West Java Province (JBR) coded JBR-9 (a), and Campylobacter coli isolates from Jakarta Province (JKT) coded JKT-3 (b) showed similarities to the melting curve and melt peak temperature to the positive control.
Variations were also found in the different melting peak temperatures produced for each isolate. Differences based on the melting peak temperatures and melting curve patterns were found in isolates from West Java and Banten Provinces, as illustrated in Figures-2-4. The melting peak temperature for West Java isolates coded as JBR-1 and JBR-2 was 75.3°C and 74.9°C, respectively. The isolates coded as JBR-6, JBR-7, and JBR-8 had the same melting peak temperature of 75.1°C; the isolates from Banten coded as BNT 6, BNT-7, and BNT-8 also had the same melting peak temperature of 75.2°C, and that for the isolate coded as BNT-9 was 75.1°C.
C. coli isolates exhibiting differences and similarities in the melting curve patterns compared with the positive control were found in all six provinces. Variations in C. coli based on differences in the melting curve patterns were observed in isolates originating from Jakarta Province. This difference is shown in Figure-6 where the C. coli isolate (JKT-1) had a different melting curve pattern compared with the positive control. The similarity in the melting curve patterns with the C. coli positive control was also observed in an isolate originating from Jakarta Province (JKT-3) and is depicted in Figure-5b.
Figure-6.
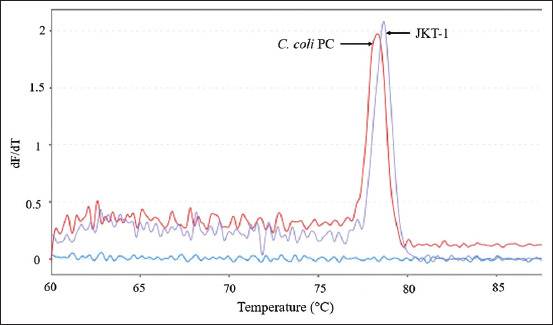
Campylobacter coli isolates from Jakarta Province (JKT) that showed variations in their melting curves. The melt peak temperature for isolate JKT-1 was 78.7°C, while the positive control for C. coli was 78.4°C.
The variations in C. coli isolates were detected not only in the melting curve patterns but also in the melting peak temperatures produced for each isolate and were observed for isolates from Jakarta, as illustrated in Figure-6. The melting peak temperature of JKT-1 isolate was 78.7°C. Table-5 shows the results of species identification and melting peak temperatures.
Table-5.
Species identification and melt peak temperature of C. jejuni and C. coli isolates using qPCR-HRM.
| Isolate ID | Melt peak (°C) | Species identification | Isolate ID | Melt peak (°C) | Species identification |
|---|---|---|---|---|---|
| AC-3 | 74.3 | C. jejuni | JKT-4 | 74.9 | C. jejuni |
| AC-5 | 75.0 | C. jejuni | JKT-5 | 79.0 | C. coli |
| AC-8 | 74.4 and 79.0 | C. jejuni and C. coli | JKT-6 | 78.7 | C. coli |
| AC-9 | 74.1 and 78.6 | C. jejuni and C. coli | JKT-7 | 75.0 | C. jejuni |
| AC-10 | 78.6 | C. coli | JBR-1 | 75.3 | C. jejuni |
| JTG-1 | 78.8 | C. coli | JBR-2 | 74.9 and 78.3 | C. jejuni and C. coli |
| JTG-2 | 78.8 | C. coli | JBR-3 | 78.4 | C. coli |
| JTG-3 | 78.1 | C. coli | JBR-4 | 78.7 | C. coli |
| LMP-1 | 74.5 and 78.7 | C. jejuni and C. coli | JBR-5 | 78.2 | C. coli |
| LMP-2 | 78.9 | C. coli | JBR-6 | 75.1 | C. jejuni |
| LMP-3 | 78.7 | C. coli | JBR-7 | 75.1 | C. jejuni |
| LMP-4 | 78.9 | C. coli | JBR-8 | 75.1 | C. jejuni |
| LMP-5 | 74.9 dan 78.9 | C. jejuni and C. coli | JBR-9 | 74.4 | C. jejuni |
| LMP-6 | 75.4 | C. jejuni | JBR-10 | 78.8 | C. coli |
| LMP-7 | 74,9 | C. jejuni | JBR-11 | 78,6 | C. coli |
| LMP-8 | 74.8 | C. jejuni | BNT-1 | 78,7 | C. coli |
| LMP-9 | 74.5 | C. jejuni | BNT-2 | 78.9 | C. coli |
| LMP-10 | 74.9 | C. jejuni | BNT-3 | 78.4 | C. coli |
| LMP-11 | 74.7 | C. jejuni | BNT-4 | 78.6 | C. coli |
| LMP-12 | 75.2 | C. jejuni | BNT-5 | 75.0 | C. jejuni |
| LMP-13 | 74.7 | C. jejuni | BNT-6 | 75.2 | C. jejuni |
| LMP-14 | 78.4 | C. coli | BNT-7 | 75.2 | C. jejuni |
| LMP-15 | 75.4 | C. jejuni | BNT-8 | 75.2 | C. jejuni |
| JKT-1 | 78,7 | C. coli | BNT-9 | 75.1 and 78.4 | C. jejuni and C. coli |
| JKT-2 | 78.8 | C. coli | BNT-10 | 75.0 | C. jejuni |
| JKT-3 | 78.5 | C. coli | ATCC 43478 | 78.4±0.1 | C. coli |
| ATCC 33291 | 74.5±0.1 | C. jejuni |
qPCR-HRM=real-time polymerase chain reaction and high resolution melting, C. jejuni=Campylobacter jejuni, C. coli=Campylobacter coli
Discussion
Prevalence of Campylobacter spp. in chicken meat samples
Campylobacteriosis has now been declared as one of the leading bacterial causes of human gastroenteritis in both developing and developed countries [1,2]. Several studies have related the high risk of campylobacteriosis in humans to chicken meat contaminated with Campylobacter [15]. In the present study, the prevalence of Campylobacter spp. originating from chicken meat in Indonesia was found to be 61.9% (65/105 chicken meat samples).
In a previous study, Zhang et al. [7] reported a high prevalence of 87.5-100% of Campylobacter contamination in samples collected from farms and in chilled chicken meat in China. Defeathering and evisceration are considered as critical points for cross-contamination in the process of slaughtering poultry [16,17]. Routine testing for Campylobacter on farms before the chickens are sent to the slaughterhouses or after slaughtering is essential to reduce these risks [18].
Species identification of the Campylobacter spp. isolates
Species identification of the 56 isolates of Campylobacter spp. using qPCR-HRM demonstrated a slightly higher proportion of C. jejuni species (41.07%) than C. coli species (39.29%). There was a small proportion (10.71%) of isolates that was a mix of both species. These results are consistent with those reported in the Netherlands [13], who mentioned that the number of C. jejuni and C. coli species was almost similar. In another study conducted in Sichuan, China [18], it was observed that there were isolates of Campylobacter spp. that might contain either C. jejuni or C. coli.
Based on several other studies such as those conducted in the United States of America [19], Canada, Belgium, Australia, the United Kingdom, Japan, and Indonesia [20,21]. C. jejuni was more commonly isolated from chickens than C. coli although the ratio differed among countries. However, in Ecuador, South Africa, and Thailand, C. coli was the dominant species found in chickens [21,22].
The transmission routes of campylobacteriosis in humans generally involve handling and consuming food or water contaminated with Campylobacter [2]. Some studies have suggested that although Campylobacter spp. are extremely sensitive to various stress conditions, C. jejuni can survive in various types of environments by forming biofilms [23,24] and can protect itself from chemical products, physical cleaning processes, and other types of environmental stress [25].
C. jejuni can survive in water for longer periods than C. coli. Therefore, C. jejuni has a greater opportunity to contaminate food and can infect animals and humans [26]. This has been supported by the statements issued by EFSA and ECDC [1], which confirmed that C. jejuni species are responsible for causing the majority of campylobacteriosis cases in humans compared to those caused by C. coli.
In a recent study conducted by Johansson et al. [24], it was observed that C. coli clade 3 isolates exhibited a potent cytotoxic effect on HT-29 cells (human colon cancer cells), which caused rapid cell death in the digestive tract, but this was not found for C. coli clades 1 or 2 and C. jejuni. These findings indicate that although C. jejuni has a greater potential to cause campylobacteriosis in humans than C. coli, the presence of C. coli clade 3, which is more virulent, causes both these species to pose similarly high risks in humans.
Melting curve variations of the Campylobacter spp. isolates
The results of the qPCR-HRM analysis conducted using the hipO and glyA genes revealed variations in the melting curve patterns observed for in C. jejuni and C. coli isolates, as illustrated in Figures-1-6. De Boer et al. [13] identified C. jejuni and C. coli in some samples by real-time PCR using the hipO and glyA genes. Although this method could identify the two species without the need for media or further testing processes, it could not demonstrate the melting curve patterns and the melting peak temperatures.
Banowary et al. [9] conducted identification and differentiation study of Campylobacter isolates using multiplex PCR and HRM using the asp and hipO genes. This method identified and differentiated C. jejuni and C. coli species with a sensitivity and specificity of 100% and 92%, respectively. Moreover, this method was able to reveal the differences in intraspecies DNA sequence variations based on melting curve patterns, differences in melting peak temperatures, and genotyping confidence percentage. Gago et al. [27] also reported that the HRM method could distinguish between Cryptococcus neoformans var. grubii and C. neoformans var. neoformans based on the different melting curve patterns.
DNA characterization using the HRM method is achieved based on the length of the sequence, the primary content of guanine and cytosine, and the complementarity of DNA sequences. This method is highly sensitive in detecting changes in one nucleotide base and would produce a different melting curve pattern [11].
According to the study of Banowary et al. [9], the difference in melting curve patterns produced by the HRM method is a reflection of the variations in the DNA sequence of the target genes in each isolate by confirming the results using sequencing methods. The results demonstrated nucleotide sequence variations of the isolates consisting of nucleotide deletions, insertions, and substitutions in the hipO and asp genes.
The method of sequencing is believed to be the gold standard for detecting DNA sequence variations. However, in a meta-analysis, the HRM method is considered to be one of the preferred methods for detecting sequence variations among the currently available techniques. This is the first step before deciding to continue using the sequencing method, which is relatively expensive and more time-consuming [28]. The major advantages of using the HRM method are that it is relatively rapid and of low cost, uses generic instruments, and provides good results. The differentiation of isolates based on the variations in melting curve patterns does not require the sequencing method if it is used only to identify variations in the DNA sequences [29,30].
The differences in DNA sequences can have an enormous impact on the virulence and characteristics of bacterial strains [31]. The differences in the DNA sequence of C. jejuni can affect the expression of genes encoding flagellar glycosylation, the capsular outer membrane, biosynthesis of enzymes, which are the strategies used by the bacterium for survival [32]. C. jejuni and C. coli have very similar phenotypic and genotypic characteristics that are difficult to distinguish [10]. Based on the present study, the identification and differentiation of C. jejuni or C. coli can be made with qPCR-HRM using the hipO and glyA genes. Moreover, this method can reveal the melting curve pattern variations and melting peak temperatures for each species.
Conclusion
The majority of chicken meat samples collected from six provinces in Indonesia were contaminated with Campylobacter spp. (61.9%). The species most commonly found were C. jejuni and C. coli with almost similar percentages. A small proportion of isolates were a mix between C. jejuni and C. coli. These C. jejuni and C. coli isolates showed variations in the melting curve patterns and melting peak temperatures produced using the qPCR-HRM method. The high prevalence of C. jejuni and C. coli in chicken meat in Indonesia indicates a high risk of campylobacteriosis incidence in humans.
Authors’ Contributions
IKS designed the study, performed the test, data analysis and drafted the manuscript under the supervision of HL, CB and PR. All authors read and approved the final manuscript.
Acknowledgments
This research was supported by funding from the Agency of Agricultural Counseling and Human Resource Development Ministry of Agriculture and the Quality Control Laboratory and Certification of Animal Products (QCLCAP/BPMSPH) Bogor of the Ministry of Agriculture (grant number:751/KPTS/Kp.320/10/2018), Republic of Indonesia, where the research was conducted. The authors would like to thank Mr. Hasan Abdullah Sanyata, Chief of QCLCAP/BPMSPH, Mr. Armin Riandi, Section Chief of Technical Services Division of QCLCAP/BPMSPH, and Mrs. Nuraini Triwijayanti, Section Chief of Preparation Samples Division of QCLCAP/BPMSPH for the permission and support; Mrs. Hasniah Achmad and all staff Laboratory of Microbiology, Biotechnology, and Sample Preparation at QCLCAP/BPMSPH, Bogor, Indonesia, for the technical support.
Competing Interests
The authors declare that they have no competing interests.
Publisher’s Note
Veterinary World remains neutral with regard to jurisdictional claims in published institutional affiliation.
References
- 1.European Food Safety Authority;European Centre for Disease Prevention and Control. The European Union summary report on trends and sources of zoonoses, zoonotic agents and foodborne outbreaks in 2014. J. EFSA. 2016;13(12):4329. doi: 10.2903/j.efsa.2017.5077. [DOI] [PMC free article] [PubMed] [Google Scholar]
- 2.WHO. The Global View of Campylobacteriosis:Report of an Expert Consultation. WHO, Utrecht, Netherlands. 2012. Available from: https://www.apps.who.int/iris/bitstream/handle/10665/80751/9789241564601eng.pdf?sequence=1&isallowed=y . Retrieved on 20-04-2019.
- 3.Tresse O, Alvarez-Ordóñez A, Connerton I.F. About the foodborne pathogen Campylobacter. Front. Microbiol. 2017;8(10):1908. doi: 10.3389/fmicb.2017.01908. [DOI] [PMC free article] [PubMed] [Google Scholar]
- 4.Scallan E, Hoekstra R.M, Angulo F.J, Tauxe R.V, Widdowson M.A, Roy S.L. Foodborne illness acquired in the United States-major pathogens. Emer. Infect. Dis. 2011;17(1):7–15. doi: 10.3201/eid1701.P11101. [DOI] [PMC free article] [PubMed] [Google Scholar]
- 5.Horrocks S.M, Anderson R.C, Nisbet D.J, Ricke S.C. Incidence and ecology of Campylobacter jejuni and coli in animals. Anaerobe. 2009;15(1-2):8–25. doi: 10.1016/j.anaerobe.2008.09.001. [DOI] [PubMed] [Google Scholar]
- 6.Althaus D, Zweifel C, Stephan R. Analysis of a poultry slaughter process:Influence of process stages on the microbiological contamination of broiler carcasses. Ital. J. Food. Saf. 2017;6(4):7097. doi: 10.4081/ijfs.2017.7097. [DOI] [PMC free article] [PubMed] [Google Scholar]
- 7.Zhang X, Tang M, Zhou Q, Zhang J, Yang X, Gao Y. Prevalence and characteristics of Campylobacter throughout the slaughter process of different broiler batches. Front. Microbiol. 2018;9(9):2092. doi: 10.3389/fmicb.2018.02092. [DOI] [PMC free article] [PubMed] [Google Scholar]
- 8.Druml B, Cichna-Markl M. High-resolution melting (HRM) analysis of DNA:Its role and potential in food analysis. Food. Chem. 2014;158(2):245–254. doi: 10.1016/j.foodchem.2014.02.111. [DOI] [PubMed] [Google Scholar]
- 9.Banowary B, Dang T.V, Sarker S, Connolly J.H, Chenu J, Groves P, Ayton M, Raidal S, Devi A, Vanniasinkam T, Ghorashi S.A. Differentiation of Campylobacter jejuni and Campylobacter coli using multiplex-PCR and high-resolution melt curve analysis. PLoS One. 2015;10(9):e0138808. doi: 10.1371/journal.pone.0138808. [DOI] [PMC free article] [PubMed] [Google Scholar]
- 10.Hoseinpour F, Foroughi A, Nomanpour B, Nasab RS. Identification and differentiation of Campylobacter species by high-resolution melting curve analysis. Microb. Pathog. 2017;108(5):109–113. doi: 10.1016/j.micpath.2017.05.009. [DOI] [PubMed] [Google Scholar]
- 11.Wittwer C.T. High-resolution DNA melting analysis:Advancements and limitations. Hum. Mutat. 2009;30(6):857–859. doi: 10.1002/humu.20951. [DOI] [PubMed] [Google Scholar]
- 12.Reed G.H, Kent J.O, Wittwer C.T. High-resolution DNA melting analysis for simple and efficient molecular diagnostics. Pharmacogenomics. 2007;8(6):597–608. doi: 10.2217/14622416.8.6.597. [DOI] [PubMed] [Google Scholar]
- 13.de Boer P, Rahaoui H, Leer R.J, Montijin R.C, van de Vossen J.M.B. Real-time PCR detection of Campylobacter spp.:A comparison to classic culturing and enrichment. Food. Microbiol. 2015;51(2015):96–100. doi: 10.1016/j.fm.2015.05.006. [DOI] [PubMed] [Google Scholar]
- 14.Merchant-Patel S, Blackall P.J, Templeton J, Price E.P, Tong S.Y.C, Huygens F, Giffard P.M. Campylobacter jejuni and Campylobacter coli genotyping by high-resolution melting analysis of a flaA fragment. Appl. Environ. Microbiol. 2010;76(2):493–499. doi: 10.1128/AEM.01164-09. [DOI] [PMC free article] [PubMed] [Google Scholar]
- 15.Boysen L, Rosenquist H, Larsson J.T, Nielsen E.M, Sørensen G, Nordentoft S. Source attribution of human campylobacteriosis in Denmark. Epidemiol. Infect. 2014;142(8):1599–1608. doi: 10.1017/S0950268813002719. [DOI] [PMC free article] [PubMed] [Google Scholar]
- 16.Sasaki Y, Maruyama N, Zou B, Haruna M, Kusukawa M, Murakami M. Campylobacter cross-contamination of chicken products at an abattoir. Zoonoses Public Health. 2013;60(2):134–140. doi: 10.1111/j.1863-2378.2012.01509.x. [DOI] [PubMed] [Google Scholar]
- 17.Gruntar I, Biasizzo M, Kušar D, Pate M, Ocepek M. Campylobacter jejuni contamination of broiler carcasses:Population dynamics and genetic profiles at slaughterhouse level. Food. Microbiol. 2015;50(9):97–101. doi: 10.1016/j.fm.2015.03.007. [DOI] [PubMed] [Google Scholar]
- 18.Han X, Zhu D, Lai H, Zeng H, Zhou K, Zou L, Wu C, Han G, Liu S. Prevalence, antimicrobial resistance profiling and genetic diversity of Campylobacter jejuni and Campylobacter coli isolated from broilers at slaughter in China. Food Control. 2016;69(2016):160–170. [Google Scholar]
- 19.Williams A, Oyarzabal O.A. Prevalence of Campylobacter spp In skinless, boneless retail broiler meat from 2005 through 2011 in Alabama, USA. BMC Microbiol. 2012;12(184):2–7. doi: 10.1186/1471-2180-12-184. [DOI] [PMC free article] [PubMed] [Google Scholar]
- 20.Andriani. Prevalensi Campylobacter jejuni Pada Karkas Ayam dan Pengembangan Uji Deteksinya. Doctoral IPB University, Bogor. 2012 [Google Scholar]
- 21.Suzuki H, Yamamato S. Campylobacter contamination in retail poultry meats and by-products in the world:A literature survey. J. Vet. Med. Sci. 2009;71(3):255–261. doi: 10.1292/jvms.71.255. [DOI] [PubMed] [Google Scholar]
- 22.Vinueza-Burgos C, Wautier M, Martiny D, Cisneros M, van Damme I, de Zutter L. Prevalence, antimicrobial resistance and genetic diversity of Campylobacter coli and Campylobacter jejuni in Ecuadorian broilers at slaughter age. Poult. Sci. 2017;96(7):2366–2374. doi: 10.3382/ps/pew487. [DOI] [PMC free article] [PubMed] [Google Scholar]
- 23.Nilsson A, Johansson C, Skarp A, Kaden R, Bertilsson S, Rautelin H. Survival of Campylobacter jejuni and Campylobacter coli water isolates in lake and well water. APMIS. 2018;126(9):762–770. doi: 10.1111/apm.12879. [DOI] [PubMed] [Google Scholar]
- 24.Johansson C, Nilsson A, Kaden R, Rautelin H. Campylobacter coli clade 3 isolates induce rapid cell death in vitro. Appl. Environ. Microbiol. 2019;85(5):e02993–e03018. doi: 10.1128/AEM.02993-18. [DOI] [PMC free article] [PubMed] [Google Scholar]
- 25.Hanning I, Jarquin R, Slavik M. Campylobacter jejuni as a secondary colonizer of poultry biofilms. Appl. Microbiol. 2008;105(4):1199–1208. doi: 10.1111/j.1365-2672.2008.03853.x. [DOI] [PubMed] [Google Scholar]
- 26.Nilsson A. Characterization of Campylobacter jejuni and Campylobacter coli Water Isolates, Doctoral Thesis. Uppsala Universitet, Sweden. 2018 [Google Scholar]
- 27.Gago S, Zaragoza O, Cuesta I, Rodríguez-Tudela J.L, Cuenca-Estrella M, Buitrago M.J. High-resolution melting analysis for identification of the Cryptococcus neoformans-Cryptococcus gattii complex. J. Clin. Microbiol. 2011;49(10):3663–3666. doi: 10.1128/JCM.01091-11. [DOI] [PMC free article] [PubMed] [Google Scholar]
- 28.Li B.S, Wang X.Y, Ma F.L, Jiang B, Song XX, Xu A.G. Is high resolution melting analysis (HRMA) accurate for detection of human disease-associated mutations?A meta-analysis. PLoS One. 2011;6(12):e28078. doi: 10.1371/journal.pone.0028078. [DOI] [PMC free article] [PubMed] [Google Scholar]
- 29.Tong S.Y.C, Xie S, Richardson L.J, Ballard S.A, Dakh F, Grabsch E.A, Grayson M.L, Howden BP, Johnson P.D.R. High-resolution melting genotyping of Enterococcus faecium based on multilocus sequence typing derived single nucleotide polymorphisms. PLoS One. 2011;6(12):e29189. doi: 10.1371/journal.pone.0029189. [DOI] [PMC free article] [PubMed] [Google Scholar]
- 30.Price E.P, Smith H, Huygens F, Giffard P.M. High-resolution DNA melt curve analysis of the clustered, regularly interspaced short-palindromic-repeat locus of Campylobacter. jejuni. Appl. Environ. Microbiol. 2007;73(10):3431–3436. doi: 10.1128/AEM.02702-06. [DOI] [PMC free article] [PubMed] [Google Scholar]
- 31.Jerome J.P, Bell J.A, Plovanich-Jones A.E, Barrick J.E, Brown C.T, Mansfield L.S. Standing genetic variation in contingency loci drives the rapid adaptation of Campylobacter jejuni to a novel host. PLoS One. 2011;6(1):e16399. doi: 10.1371/journal.pone.0016399. [DOI] [PMC free article] [PubMed] [Google Scholar]
- 32.Linton D, Karlyshev A.V, Wren B.W. Deciphering Campylobacter jejuni cell surface interactions from the genome sequence. Curr. Opin. Microbiol. 2001;4(1):35–40. doi: 10.1016/s1369-5274(00)00161-2. [DOI] [PubMed] [Google Scholar]