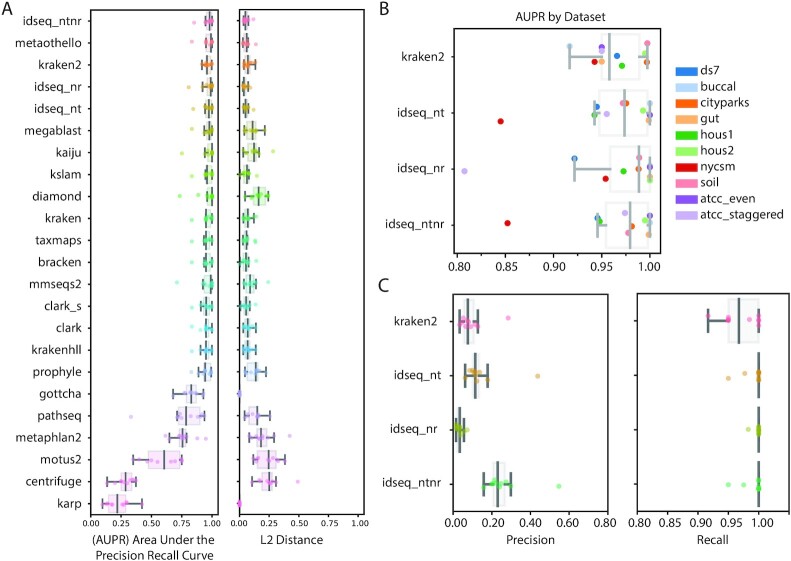
Figure 3:
Performance metrics calculated for IDseq (NT and NR), as compared to the values recently published by Ye et al. [46]. (A) Area under the precision recall curve (AUPR) and L2 distance values for 22 tools, as evaluated against their default databases. (B) The AUPR values for specific benchmark datasets evaluated for 3 tools (Kraken2, IDseq NT, and IDseq NR), including metrics obtained when evaluating basic threshold filters integrating both IDseq NT and NR (idseq_ntnr). (C) The precision and recall of the same 3 tools for detecting known taxa. In all boxplots, the median is shown as a dark grey line, with light grey boxes corresponding to the first and third quartiles. Whiskers extend to the farthest data points that are not outliers.

