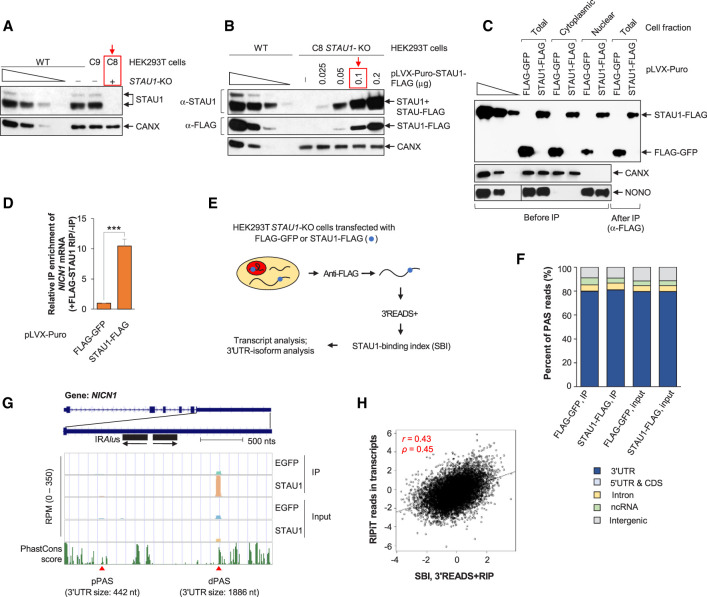
FIGURE 1.
Transcriptome-wide analysis of STAU1 binding using 3′READS + RIP. (A) Western blots of lysates of wild-type (WT), STAU1-knockout (KO, C8, red box), or isogenic control (C9) HEK293T cell lines, the last two generated using CRISPR–Cas9n (i.e., Cas nickase). Calnexin (CANX) serves as a loading control. Here and elsewhere, lanes under the wedge are threefold dilutions of cell lysates and used for semiquantitative analyses. (B) Western blots of lysates of WT and STAU1-KO (C8) HEK293T cells transiently transfected with increasing amounts of STAU1-FLAG expression vector (µg per ∼3 × 10⁶ cells in one 60-mm dish). The red box designates the amount of vector utilized in all subsequent experiments, where the level of STAU1-FLAG was ∼1.2-fold the level of endogenous STAU1 in WT HEK293T cells (the first lane of the anti-STAU1 titration corresponds to one cell equivalent). (C) Western blots of lysates from the specified fraction of STAU1-KO HEK293T cells transiently transfected with amounts of STAU1-FLAG expression vector equivalent to those shown in the red-boxed lane of panel B or, as a negative control, using the same amount of FLAG-GFP expression vector. Lysates were analyzed before or after immunoprecipitation (IP) using anti(α)-FLAG, where fivefold more cell equivalents were loaded after IP relative to before IP. CANX and NONO controls for the cytoplasmic and nuclear fraction, respectively, in before IP samples. (D) Histogram representation of RT-qPCR quantitations of NICN1 mRNA in the anti-FLAG IP relative to before IP using total-cell lysates of STAU1-KO HEK293T cells transiently expressing FLAG-GFP or STAU1-FLAG, where the value in FLAG-GFP-transfected cells is set to 1. Results are means ± standard deviations (SD). n = 3. (***) P < 0.001 (unpaired two-tailed t-test). (E) Schematic outlining the 3′READS + RIP procedure to analyze STAU1 binding to transcripts using samples prepared as in D. (F) Genomic distributions of poly(A) sites (PASs) detected in different input and RIP samples. (G) UCSC tracks for the NICN1 gene using 3′READS + RIP data. Reads per million (RPM) ranges are indicated on y-axis. Two APA isoforms were detected in HEK293T cells that derive from PASs different than those noted in the UCSC database. Their polyadenylation sites are depicted by red triangles, and their 3′UTR size is provided in nts. pPAS, proximal polyadenylation site; dPAS, distal polyadenylation site. Genomic sequence conservation, based on PhastCons scores derived from 100 vertebrate species, is shown in the bottom-most strip. (H) Correlation between the STAU1-Binding Index (SBI) derived from two biological replicates of 3′READS + RIP and STAU1 binding based on RIPiT data (Ricci et al. 2014) (accession number GSE52447). The SBI was calculated as the Log2(STAU1-FLAG IP RPM/FLAG-EGFP IP RPM), and STAU1 binding with RIPiT data was calculated by Log2(STAU1 WT IP/STAU1 MT IP RIPiT reads), where WT is wild-type STAU1 and MT is a STAU1 variant harboring a point mutation in dsRBD 3 and another in dsRBD 4, both known to disrupt RNA binding. For RIPiT, reads throughout transcripts were merged to calculate STAU1 binding in the whole transcript. Each point represents a transcript selected from one gene. For genes with multiple isoforms, the one with the highest expression level based on RPM in samples before IP was chosen. Pearson correlation r is indicated, as is the Spearman correlation coefficient ρ.

