

Abstract
22q11.2 deletion syndrome (22q11.2DS) is a genetic condition accompanied by a range of psychiatric manifestations, including autism spectrum disorder (ASD). It remains unknown, however, whether these symptoms are mediated by the same or distinct neural mechanisms as in idiopathic ASD. Here, we examined differences in lGI associated with ASD in 50 individuals with 22q11.2DS (n = 25 with ASD, n = 25 without ASD) and 81 individuals without 22q11.2DS (n = 40 with ASD, n = 41 typically developing controls). We initially utilized a factorial design to identify the set of brain regions where lGI is associated with the main effect of 22q11.2DS, ASD, and with the 22q11.2DS-by-ASD interaction term. Subsequently, we employed canonical correlation analysis (CCA) to compare the multivariate association between variability in lGI and the complex clinical phenotype of ASD between 22q11.2DS carriers and noncarriers. Across approaches, we established that even though there is a high degree of clinical similarity across groups, the associated patterns of lGI significantly differed between carriers and noncarriers of the 22q11.2 microdeletion. Our results suggest that ASD symptomatology recruits different neuroanatomical underpinnings across disorders and that 22q11.2DS individuals with ASD represent a neuroanatomically distinct subgroup that differs from 22q11.2DS individuals without ASD and from individuals with idiopathic ASD.
Keywords: 22q11.2 deletion syndrome, autism spectrum disorder, brain anatomy, cortical folding, local gyrification index
Introduction
22q11.2 deletion syndrome (22q11.2DS) is a genetic condition caused by a microdeletion at the q11.2 band of chromosome 22 (Scambler et al. 1992). The phenotypic consequences of 22q11.2DS are both complex and variable, including a wide range of somatic and psychiatric symptoms (McDonald-McGinn et al. 2016). Clinical studies indicate that 22q11.2DS is associated with a high prevalence of comorbid neuropsychiatric conditions, occurring at different developmental stages. These include psychotic spectrum disorders (Murphy et al. 1999; Schreiner et al. 2013; Schneider et al. 2014), anxiety disorders (Schneider et al. 2014), and attention deficit hyperactivity disorder (Schneider et al. 2014). Furthermore, autism spectrum disorder (ASD) is a commonly observed neuropsychiatric phenotype of 22q11.2DS, with prevalence estimates ranging from 18% to 58% (Antshel et al. 2007; Schneider et al. 2014; Fiksinski et al. 2017; Jalbrzikowski et al. 2017). However, even though individuals with 22q11.2DS display behavioral symptoms that are similar to those in non-22q11.2DS individuals, evidence suggests that these symptoms may be underpinned by different neurobiological mechanisms. Most of the existing literature linking neuropsychiatric symptoms to different brain phenotypes in 22q11.2DS has focused on the high incidence of psychotic symptoms (e.g., Jalbrzikowski et al. 2013). In terms of ASD, however, it remains largely unknown how closely the neurobiological phenotype in 22q11.2DS resembles the ASD phenotype in the general population and whether ASD symptoms are mediated by the same or different neurobiological mechanisms across conditions.
To date, only three neuroimaging studies have examined the neuroanatomical underpinnings of ASD in 22q11.2DS. Two of these studies, in independent cohorts, reported significant differences in right amygdala volume between 22q11.2DS individuals with and without ASD, though these were in opposite directions (Antshel et al. 2007; Jalbrzikowski et al. 2017). Further, a recent study by our group noted differences in cortical volume and surface area between 22q11.2DS individuals with and without ASD, primarily in parieto-temporal regions, posterior cingulate, and dorsolateral prefrontal cortices (Gudbrandsen et al. 2019). Previous studies also link both 22q11.2DS and idiopathic ASD to differences in cortical gyrification as examined via the local gyrification index (lGI; Schaer et al. 2008). The lGI is a highly complex neuroanatomical feature that has previously been linked to various aspects of the cortical microstructure (e.g., cellular complexity, neuronal density, cellular alignment; Welker 1990; Fischl et al. 2007) and may thus provide unique insights into the pathophysiological mechanisms mediating the convoluted anatomy of the cortex across development.
More specifically, prior studies have found that, relative to typically developing (TD) controls, individuals with 22q11.2DS display a reduced degree of cortical folding in several areas of the frontal and parietal lobes, as well as in cortical midline structures (Schaer et al. 2008; Kunwar et al. 2012; Srivastava et al. 2012; Mous et al. 2014; Schmitt et al. 2015; Bakker et al. 2016), with one study also reporting increased gyrification in the occipital lobe in 22q11.2DS (Bearden et al. 2009). In contrast, reports of studies examining cortical folding in idiopathic ASD are more heterogeneous. Here, several studies report increased lGI in the occipital lobe (Wallace et al. 2013), the pre- and postcentral gyrus (Ecker et al. 2016), and in inferior temporal regions (Yang et al. 2016), and some studies suggest a decreased degree of gyrification in fronto-parietal and posterior midline regions (Schaer et al. 2013), as well as in the supramarginal gyrus (Libero et al. 2014). However, no studies to date have focused on differences in cortical folding between different 22q11.2DS subgroups, for example, between those with and without comorbid ASD. This is of importance as 22q11.2DS is often utilized as a preclinical model for ASD (Meechan et al. 2009; Hiramoto et al. 2011; Hiroi et al. 2012). Yet, it remains unknown whether findings translate from the rodent model to the human brain in vivo.
In the present study, we aimed to determine whether ASD symptoms are associated with the same or different patterns of cortical folding in carriers and noncarriers of the 22q11.2 microdeletion. We first applied a categorical approach that allowed us to identify (1) the set of neuroanatomical brain regions where cortical folding is associated with 22q11.2DS and ASD symptomatology and (2) to what extent 22q11.2DS modulates differences in lGI associated with ASD. Based on prior evidence (Gudbrandsen et al. 2019), it was hypothesized that the patterns of cortical folding do not represent a simple exacerbation of the 22q11.2DS phenotype (i.e., more severe behavioral impairments being associated with more pronounced neuroanatomical differences) but that the microdeletion interacts with ASD to elicit a distinct neurobiological phenotype. In a second analysis step, we applied a multivariate dimensional approach using canonical correlation analysis (CCA). Here, rather than treating ASD as a “fixed-effect” variable based on diagnostic labels, ASD was considered a dimensional construct characterized by multiple symptom domains. This allowed us to examine the multivariate association between the clinical phenotype of ASD and variability in lGI in a spatially unbiased fashion. The resulting patterns of brain regions associated with ASD were subsequently compared between 22q11.2 deletion carriers (i.e. 22q11.2DS with and without ASD) and noncarriers (i.e., idiopathic ASD and TD controls).
Materials and Methods
Participants
The total sample consisted of 131 individuals between 6 and 25 years of age, including (1) 50 carriers of the 22q11.2 microdeletion, where n = 25 had a diagnosis of ASD (22q11.ASD) and n = 25 individuals did not (22q11.nonASD), (2) 40 individuals with a diagnosis of idiopathic ASD (i.e., with ASD but not the 22q11.2 microdeletion), and (3) 41 typically developing (TD) controls (for details on participant demographics, see Table 1 and Supplementary Material S1). The 22q11.2 microdeletion was confirmed by in-situ hybridization (FISH) or microarray. Details on the 22q11.2DS sample have previously been described in Gudbrandsen et al. (2019). ASD symptomatology was measured using the Autism Diagnostic Interview-Revised (ADI-R; Lord et al. 1994) and the Autism Diagnostic Observation Schedule (ADOS; Lord et al. 2000; Gotham et al. 2009), which was administered in all individuals with 22q11.2DS, as well as in individuals with idiopathic ASD. In accordance with previously published studies examining ASD symptomatology in 22q11.2DS, both ASD groups were diagnosed based on the following criteria: scores had to fall above the ADI-R threshold on the reciprocal social interaction domain (cutoff = 10), as well as the communication domain (cutoff = 8), while being allowed to fall below cutoff in the restricted, repetitive, and stereotyped behaviors domain (cutoff = 3). Additionally, the Social Responsiveness Scale (SRS; Bölte and Poustka 2008; Constantino and Gruber 2012) was administered in all participants, including participants without a diagnosis of ASD. Overall intellectual ability was assessed using the Wechsler Abbreviated Scale of Intelligence (WASI; Wechsler 1999). Participants with a full-scale Intelligence Quotient (IQ) below 60 were excluded from the study. Further exclusion criteria for all participants included contraindications to MRI and any medical condition or chromosomal anomaly other than 22q11.2DS, which may be associated with ASD or psychosis (e.g., tuberous sclerosis, Fragile X syndrome, or Prader–Willi syndrome). However, individuals with neuropsychiatric disorders (e.g., ADHD and depression) were included in the 22q11.2DS group and in the group of individuals with idiopathic ASD, as these are common comorbid features (see Supplementary Material S2 for details). Lastly, we administered the Structured Interview for Prodromal Syndromes (SIPS) (McGlashan 2001) to all participants with 22q11.2DS in order to assess the existence and severity of prodromal positive psychotic symptoms (e.g., unusual thought content, suspiciousness, and grandiose ideas), and negative psychotic symptoms (e.g., social anhedonia, avolition, and expression of emotion). Items were rated on a scale from 0 to 6 (0 = absent; 6 = extreme severe level). Notably, there were no significant differences in positive or negative symptoms between the 22q11.ASD and 22q11.nonASD groups (see Supplementary Material S3).
Table 1.
Participant demographics
| 22q11.non-ASD | 22q11.ASD | ASD | TD controls | Test statistics | ||||||
|---|---|---|---|---|---|---|---|---|---|---|
| (n = 25) | (n = 25) | (n = 40) | (n = 41) | F | P | |||||
| Gender (m/f) | 11/14 | 13/12 | 32/8 | 23/18 | ||||||
| Age (years) | 14 ± 6 | (6–25) | 15 ± 4 | (7–23) | 15 ± 2 | (11–18) | 14 ± 4 | (7–24) | 0.18 | 0.91 |
| Full-scale IQ | 86 ± 15 | (60–116) | 81 ± 12 | (61–112) | 96 ± 13 | (64–116) | 104 ± 11 | (76–123) | 21.01 | <0.001 |
| ADI-R Social1 | 5 ± 3 | (1–9) | 19 ± 5 | (9–28) | 17 ± 4 | (9–27) | n/a | n/a | 95.93 | <0.001 |
| ADI-R Comm1 | 6 ± 4 | (0–16) | 14 ± 4 | (8–24) | 13 ± 4 | (5–23) | n/a | n/a | 29.98 | <0.00 |
| ADI-R RRB1 | 1 ± 2 | (0–8) | 3 ± 3 | (0–10) | 5 ± 2 | (1–10) | n/a | n/a | 16.80 | <0.001 |
| ADOS CSS1 | 3 ± 2 | (1–8) | 6 ± 3 | (1–10) | 6 ± 3 | (1–10) | n/a | n/a | 9.30 | <0.001 |
| SRS Total Score | 55 ± 26 | (16–103) | 101 ± 33 | (41–174) | 95 ± 29 | (42–159) | 23 ± 19 | (0–75) | 69.38 | <0.001 |
| SRS Repetitive | 9 ± 6 | (1–22) | 17 ± 7 | (7–32) | 16 ± 7 | (0–34) | 2 ± 3 | (0–10) | 49.31 | <0.001 |
| Total CV [L] | 0.66 ± 0.08 | (0.41–0.89) | 0.68 ± 0.07 | (0.52–0.78) | 0.75 ± 0.07 | (0.60–0.92) | 0.73 ± 0.07 | (0.59–0.90) | 10.56 | <0.001 |
| Total SA [m2] | 0.20 ± 0.02 | (0.13–0.25) | 0.21 ± 0.02 | (0.17–0.24) | 0.23 ± 0.02 | (0.18–0.27) | 0.22 ± 0.02 | (0.19–0.27) | 12.41 | <0.001 |
Note: IQ, intelligence quotient; ADI-R, Autism Diagnostic Interview–Revised; ADOS CSS, Autism Diagnostic Observation Scale Calibrated Severity Score; L, liter; m, millimeter; a Data based on 89 individuals; Data expressed as mean ± standard deviation (range). Groups differed significantly in terms of Full-scale IQ. As expected, groups also differed significantly in all clinical measures. Social, reciprocal social interaction; Comm, Communication; RRB, Restricted, repetitive & Stereotyped Behaviors; SA, surface area; CV, cortical volume.
All participants, and accompanying parents for those under 18 years of age, gave informed written consent in accordance with ethics approval by the Ethics Committee (of the faculty of medicine) of Goethe-University Frankfurt, the National Research Ethics Service (NRES) Committee South Central (study reference: 12/SC/0576), and/or the UCLA Institutional Review Board (IRB).
MRI Data Acquisition
All participants were scanned with MRI scanners operating at 3 T (Siemens Trio in Frankfurt and at UCLA, and a Signa GE Medical System at the IoPPN, London). High-resolution structural MPRAGE sequence was acquired with full head coverage. At the IoPPN, 166 contiguous slices (1.2 mm thickness, with 1.2 × 1.2 mm in-plane resolution) were acquired using a repetition time/echo time (TR/TE) of 7/2.9 ms (flip angle = 8°, FOV = 26 cm). In Frankfurt, 176 contiguous slices (1.0 mm thickness, with 1.0 × 1.0 mm in-plane resolution) were acquired using a repetition time/echo time (TR/TE) of 2300/2.2 ms (flip angle = 9°, FOV = 26 cm). At UCLA, 160 contiguous slices (1.2 mm thickness, with 1.2 × 1.2 mm in-plane resolution) were acquired using a repetition time/echo time (TR/TE) of 2300/2.9 ms (flip angle = 8°, FOV = 26 cm). Consistent image quality was ensured by a semiautomated quality control procedure at all sites.
Cortical Surface Reconstruction using FreeSurfer
FreeSurfer v6.0.0 software (http://surfer.nmr.mgh.harvard.edu/) was used to derive models of the cortical surface for each T1-weighted image. These well-validated and fully automated procedures have been extensively described elsewhere (Dale et al. 1999; Fischl et al. 1999; Fischl and Dale 2000; Ségonne et al. 2004; Jovicich et al. 2006). In brief, a single filled white-matter volume was generated for each hemisphere after intensity normalization, extracerebral tissue was cropped, and image segmentation was performed using a connected components algorithm. A triangular tessellated surface was then generated for each white-matter volume by fitting a deformable template, resulting in a cortical mesh for the white-matter (i.e., inner) and pial (i.e., outer) surface. The resulting surface models were visually inspected for reconstruction errors, and the quality of each scan was rated. Details on quality assessments and manual editing of MRI scans can be found in Supplementary Material S4.
Vertex-based estimates of local gyrification were computed as described by Schaer et al. (2008). For each participant, lGI is defined as the ratio between the pial (gray matter) surface and a constructed smooth “hull” surface around the cortex, originally proposed by Zilles et al. (1988). The lGI at each point reflects the amount of cortex buried within the sulcal folds in the surrounding area (Schaer et al. 2008). For these computations, the default sampling sphere of a 25 mm radius was used. All scans were then co-registered to a common space (“fsaverage”) template, which allows for a vertex-wise comparison of morphometric features between groups (Fischl et al. 1999). As implemented in FreeSurfer, the resulting cortical lGI maps are already intrinsically smooth by default, and hence, no additional surface-based smoothing filter was applied prior to analyses (FWHM = 0). We also examined between-group differences in total surface area (SA) and total brain volume.
Statistical Analyses
Statistical analyses were conducted using the SurfStat toolbox (https://www.math.mcgill.ca/keith/surfstat/) for Matlab (R2019a; MathWorks). Between-group differences in gender were assessed via chi-squared test. Differences in age, full-scale IQ, ASD symptom severity (i.e., ADI-R, ADOS CSS, and SRS scores), and total brain volume were assessed via analysis of variances (ANOVAs) with group as categorical fixed-effects factor and Fisher’s Least Significant Differences (LSD) test to examine pair-wise differences. We applied a general linear model (GLM) at each vertex i and subject j, with (1) group membership (i.e., control group, 22q11.2 microdeletion and/or ASD diagnosis), gender, and site as categorical fixed-effect factors; (2) an 22q11.2DS-by-ASD interaction term; and (3) age, IQ, and total SA as continuous covariates, so that:
 |
where εi is the residual error at vertex i. All included continuous covariates were mean-centered across groups to improve interpretability of the coefficients. We examined between-group differences for the main effect of 22q11.2DS, estimated from the corresponding coefficient β1, as well as the main effect of idiopathic ASD, estimated from the corresponding coefficient ß2, normalized by the corresponding standard error, respectively. Furthermore, we analyzed the interaction between 22q11.2DS and ASD (coefficient ß3) across groups. Corrections for multiple comparisons across the whole brain were performed using random field theory” (RFT)-based cluster analysis for nonisotropic images using a cluster-based significance threshold of P < 0.05 (2-tailed) (Worsley et al. 1999). As some individuals with 22q11.2DS fell short in the ADI-R restricted, repetitive & stereotyped behaviors domain, we further included SRS repetitive behavior subscale as a covariate in our analysis.
Canonical Correlation Analysis
In a second analysis step, we performed a dimensional analysis using CCA in order to examine differences in the neural systems mediating autistic symptoms in 22q11.2DS and non-22q11.2DS individuals. Here, ASD was not treated as a categorical fixed effect across groups, but as multivariate latent trait construct that is spanned by interindividual differences in symptom profile. The general framework of CCA has been developed by Hotelling and is well described elsewhere ((Hotelling 1936) for details, see Supplementary Material S5).
In the present study, we examined the relationship between neuroanatomical variability in lGI as a predictor (X), and the five SRS subdomain scores in social awareness (SAW), social cognition (SCG), social communication (SCM), social motivation (SM), and restricted and repetitive behaviors (RRB) as clinical outcomes (Y) (for details on CCA, see Supplementary Materials S5 and S6). To avoid sparse CCA and to reduce the large number of vertex-based neuroanatomical features to a smaller subset of regions, we initially computed bivariate Pearson correlation coefficients between each of the five SRS subdomains and mean lGI in 34 cortical regions per hemisphere using the Desikan-Killy cortical parcellation atlas (Desikan et al. 2006). We reduced data by including all brain regions associated with at least one of the clinical variables, and the resulting correlation matrices were thresholded at the 80th percentile. This resulted in a set of P = 40 neuroanatomical features in X and thus a total of i = q = 5 canonical variates (CVs).
CCA was initially applied to the non-22q11.2DS individuals (i.e., idiopathic ASD and TD controls) to establish the relationship between neuroanatomical variability in lGI and interindividual differences in autistic symptom profiles. The significance of the full canonical model was evaluated using Wilks’ lambda λ (Henson 2000) and Pillai’s Trace (Pillai 1955). A dimension reduction analysis was then performed to identify the number of significant CVs for the subsequent comparison between groups. Here, we explored the percentage of variance explained by each CV and tested for their statistical significance using Wilks’ λ and Bartlett’s chi-squared test (Snedecor and Cochran 1989). Only CVs that explained sufficient clinical variance were retained for further analysis. The same canonical model was then fitted to individuals with the 22q11.2 microdeletion. To make the factor structure comparable across groups, CVs were sorted in descending order based on the fraction of total clinical variance explained by each CV (i.e., CV adequacies for clinical data). Last, Tucker’s congruence coefficient (Lorenzo-Seva and ten Berge 2006) was used to compare the spatially distributed patterns of neuroanatomical variability associated with the retained canonical correlations (CCs) across groups. Here, a congruence coefficient of 0.90 is generally interpreted as indicating a high degree of factor similarity, and values higher than 0.95 indicate that the factors can be considered equal. All statistical analyses were performed using RStudio Version 1.2 (https://www.rstudio.com) using yacca: Yet Another Canonical Correlation Analysis Package toolbox (https://CRAN.R-project.org/package=yacca).
Results
Participant Demographics
There were no group differences in participants’ mean age. However, groups differed significantly in gender distribution (χ2 (3) = 2.26, P < 0.05), with less females in the idiopathic ASD group, and in full-scale IQ (F(3) = 21.01, P < 0.001), with TD controls scoring higher than all other groups, and both 22q11.2DS groups having a lower IQ than idiopathic ASD. Further, we observed a significant effect of group for total brain volume (F(3) = 10.56, P < 0.001) and total SA (F(3) = 12.41, P < 0.001), with carriers of the 22q11.2DS microdeletion having significantly lower values compared with noncarriers (P < 0.05 for all pair-wise comparisons) (see Table 1 for details). In addition to age, we therefore covaried for gender, site, full-scale IQ, and total SA within the GLM.
Main Effect of 22q11.2DS on lGI
Following correction for multiple comparisons, we observed significant main effect of 22q11.2DS on lGI in several clusters across the cortex. Specifically, we observed significantly decreased lGI in 22q11.2DS in clusters centered around the bilateral pre- and postcentral gyri with the right hemisphere cluster extending to the superior parietal cortex and supramarginal gyrus (approximate Brodmann areas [BA] 1-4,7). We further observed decreased lGI in the right middle temporal gyrus (BA 20-21) and right frontal gyrus (BA 19) in 22q11.2DS. Moreover, carriers showed significantly decreased lGI in most midline brain structures extending into the medial frontal lobes (BA 1-6, 8-11), parietal lobes (BA 5, 7, 30-31), occipital lobes (BA 17-19), and cingulate cortices (BA 23-27). In contrast, 22q11.2DS individuals compared with non-22q11.2DS showed increased lGI in two large bilateral clusters spanning the middle and superior temporal lobes, the insula, as well as the pre- and postcentral gyrus (BA 4-6, 21-22, 39-43) (see Fig. 1A and Supplementary Material S7 for details).
Figure 1.
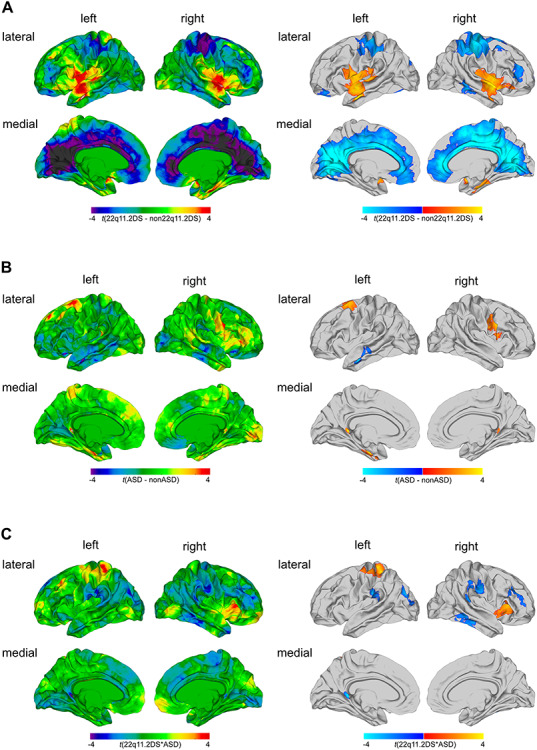
Results of the categorical analysis. Significant differences in local gyrification for (A) the main effect of 22q11.2DS, (B) the main effect of ASD, and (C) the 22q11.2DS-by-ASD interaction effect. Displayed are the unthresholded t-maps (left panel) and the random field theory (RFT)-based cluster corrected (P < 0.05, 2-tailed) t-maps (right panel). Here, increased parameter estimates in 22q11.2DS or ASD relative to their respective counterparts are marked in red to yellow, and decreased parameters are marked in blue to cyan.
Main Effect of ASD on lGI
There was a significant main effect of ASD, indicating that individuals with ASD (i.e., individuals with idiopathic ASD and 22q11.ASD) showed distinct patterns of lGI compared with those without (i.e., compared with 22q11.nonASD and TD controls). More specifically, individuals with ASD had increased lGI in the right precentral gyrus (BA 4), the left entorhinal cortex and fusiform gyrus (BA 28, 34-37), left parahippocampal gyrus (BA 27-28), the superior frontal gyrus (BA 6), and in the right posterior cingulate cortex (BA 29). In contrast, we observed decreased lGI in left middle temporal gyrus (BA 21-22) when comparing individuals with ASD symptomatology to those without (for detailed information, see Fig. 1B and Supplementary Material S7).
Interaction of 22q11.2DS and ASD on lGI
In addition to the main effects of group, we examined a 22q11.2DS-by-ASD interaction effect. We identified several cortical regions, where the neuroanatomy of ASD symptomatology was significantly modulated by the 22q11.2 microdeletion, including the right insula and pars triangularis (BA 45, 52), the left precentral gyri and superior parietal cortex (BA 1-5, 7), bilateral postcentral gyrus and supramarginal gyrus (BA 4, 40, 43), the right inferior and middle temporal gyri (BA 20, 21), right rostral middle frontal cortex (BA 9-10, 46), and a cluster spanning the left superior and inferior parietal cortex, as well as lateral occipital cortex (BA 18-19) (for detailed information, see Fig. 1C and Supplementary Material S7). The distribution of mean lGI values across groups was complex and differed between regions (for detailed information, see Supplementary Material S8). Covarying for repetitive behavior using the SRS did not change the results of our categorical analysis (see Supplementary Material S9).
Canonical Correlation Analysis
Initially, CCA was performed across individuals without the 22q11.2 microdeletion (i.e, non-22q11.2 ASD and TD controls). Based on the number of clinical predictors, the CCA yielded five CVs with correlations of 0.88, 0.79, 0.78, 0.64, and 0.61 for each successive canonical pair (Fig. 2A). Collectively, the full model including all CCs was statistically significant at P < 0.05 using Wilks’ lambda (λ) = 0.01 (F(200,184) = 1.32, p = 0.03) and Pillai’s trace = 2.80 (F(200,200) = 1.27, P < 0.05). As Wilks’ λ indicates the variance unaccounted for by the model, the R-square type (ρ2) effect size of the model was 0.99 (i.e., 1-λ), indicating that the full model explained about 99% of the variance shared between measures of neuroanatomy and clinical symptom profile. Moreover, the total variance in clinical symptoms that could be explained by neuroanatomical variation was 59.1%, to which only the first CV contributed significantly (31.45%, Fig. 2A). The first CV was also the only one to be statistically significant (Bartlett’s χ2(200) = 252.99, P = 0.007) and explained a total of 40% of clinical variability within the set of clinical variables on its own (clinical CV adequacy, Fig. 2B). Thus, given the ρ2 effects for each CVs, only the first CV was considered noteworthy in the context of the present study. The first CV was also sufficient to reliably discriminate between individuals with and without ASD and to separate individuals with higher symptom severity from those with lower symptom severity measured by the SRS (Fig. 2C). Figure 2D shows the canonical loadings (λc) for each neuroanatomical predictor on the cortical surface, which highlights the set of brain regions maximally correlated with the CV1. As expected, the highest positive loadings (i.e., λ ≥ 0.15) were observed in many regions of the social and emotional brain including the bilateral entorhinal cortex (left hemisphere [lh], λC1 = 0.23; right hemisphere [rh], λC1 = 0.18), the bilateral parahippocampal gyri (lh, λC1 = 0.21; rh, λC1 = 0.17), the left inferior parietal cortex (λC1 = 0.21), and left fusiform gyrus (λC1 = 0.15). Highest negative loadings were observed in the left rostral middle frontal gyrus (λC1 = −0.18) and the right frontal pole (λC1 = −0.18; see Supplementary Material S10).
Figure 2.
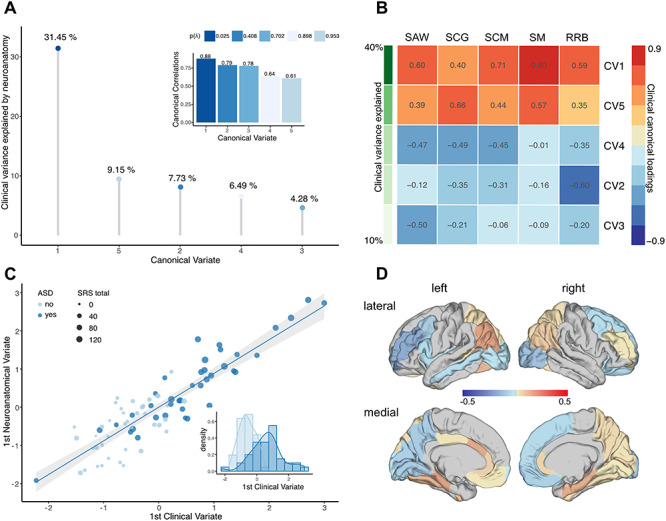
CCA results for idiopathic ASD versus TD controls. (A) CCs (subplot) and CVs sorted in descending order, and based on the percentage of clinical variance explained; (B) clinical canonical loadings plot depicting correlations between each of the five clinical CVs and each of the five SRS subdomain scores in social awareness (SAW), social cognition (SCG), social communication (SCM), social motivation (SM), and restricted and repetitive behaviors (RRB). CVs are sorted in descending order based on the percentage of explained clinical variance as indicated in shades of green; (C) scatter plot depicting individual observations based on their scores on the first CV, which explained the largest percentage of clinical variance. Data points are colored by group (ASD vs. TD controls) and sized by the individual’s total SRS score; (D) canonical loadings of lGI on the first CV.
In individuals with 22q11.2DS, the full model did not reach statistical significance (Wilks’ lambda = 0.0002, F(200,30) = 0.74, P = 0.89; Pillai’s trace = 3.91, F(200,45) = 0.81, P < 0.9). CVs were high overall (0.97, 0.95, 0.90, 0.84, and 0.74), and 76.24% of the clinical variance could be explained by the set of neuroanatomical features examined, with anatomical CV3 explaining the largest percentage of clinical variability (43.03%; see Fig. 3A). To identify the CV in the 22q11.2DS individuals that is comparable with CV1 in the non-22q11.2DS group, clinical CVs were sorted based on the percentage of clinical variability explained (i.e., clinical variate adequacies). As shown in Figure 3B, CV3 in the 22q11.2DS group was the clinically most relevant variate, accounting for approximately 53% of the clinical variance on its own, followed by CV5 and CV1, which explained 23% and 12% of the clinical variance, respectively. Moreover, CV3 displayed a clinical loading profile that closely resembled the profile of CV1 in the non-22q11.2DS individuals (i.e., high positive loadings across all five SRS subdomains; see Fig. 2C) with a congruence coefficient of 0.98 (i.e., factors can be considered equal). CV3 in the 22q11.2DS group was therefore considered the equivalent of CV1 in the non-22q11.2DS individuals. Although less precisely than in the population of non-22q11.2DS individuals, the third clinical variable was still sufficiently separating individuals with ASD from individuals without. However, while the CVs displayed a high degree of clinical factor similarity across groups, they were mediated by different neuroanatomical substrates between groups (see Supplementary Material S10 for information on neuroanatomical loadings). When comparing the neuroanatomical underpinnings of CV1 in the non-22q11.2DS and CV3 in the 22q11.2DS group based on their loadings (Fig. 4), we established that there was a very low level of congruence overall (congruence coefficient = 0.02), indicating that the neuroanatomical patterns associated with the main clinical components in carriers and noncarriers are clearly distinct. The largest differences in CV loadings (i.e., Δλ > 0.3) were observed in the left anterior cingulate cortex (Δλ = 0.42), the bilateral inferior parietal cortex (left: Δλ = 0.53; right: Δλ = 0.46), and the bilateral superior parietal cortex (left: Δλ = 0.33; right: Δλ = 0.32, Fig. 4).
Figure 3.
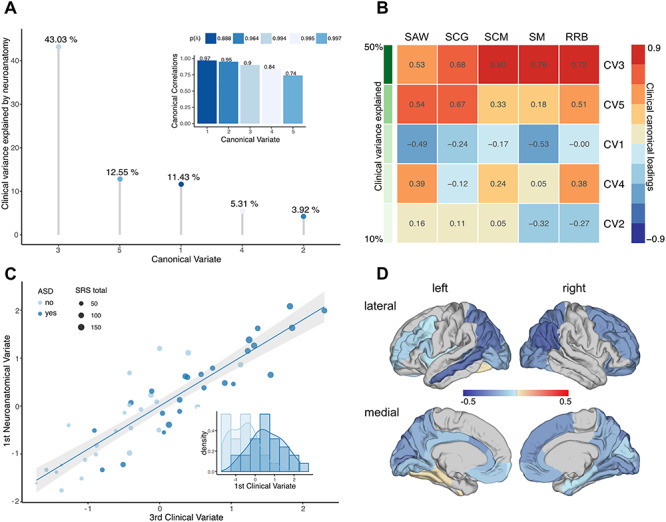
CCA results for 22q11.2DS individuals. (A) CCs (subplot) and CVs sorted in descending order, and based on the percentage of clinical variance explained; (B) clinical canonical loadings plot depicting correlations between each of the five clinical CVs and each of the five SRS subdomain scores in social awareness (SAW), social cognition (SCG), social communication (SCM), social motivation (SM), and restricted and repetitive behaviors (RRB). CVs are sorted in descending order based on the percentage of explained clinical variance as indicated in shades of green; (C) scatter plot depicting individual observations based on their scores on the third CV, which explained the largest percentage of clinical variance. Data points are colored by group (22q11.ASD vs. 22q11.nonASD) and sized by the individual’s total SRS score; (D) canonical loadings of lGI on the third CV.
Figure 4.
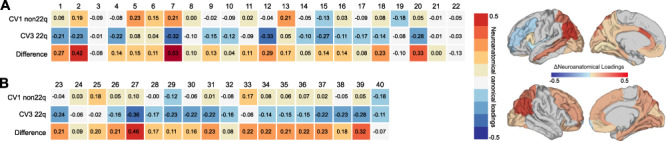
Comparison of brain loadings between 22q11.2DS and non-22q11.2DS. Neuroanatomical loadings for lGI on the 1st and 3rd CV, which explained the largest percentage of clinical variance in each group, i.e., CV1 for the non-22q11.2DS group (first row) and CV3 for the 22q11.2DS group (second row). The third row shows the difference in loadings between the groups for each region. Differences in neuroanatomical loadings are displayed for (A) Left hemisphere and (B) right hemisphere. Numbers indicate a set of brain regions: 1 banks superiortemporal, 2 caudalanteriorcingulate, 3 caudalmiddlefrontal, 4 cuneus, 5 entorhinal, 6 fusiform, 7 inferiorparietal, 8 isthmuscingulate, 9 lateraloccipital, 10 lingual, 11 medialorbitofrontal, 12 middletemporal, 13 parahippocampal, 14 parsopercularis, 15 pericalcarine, 16 posteriorcingulate, 17 precuneus, 18 rostralanteriorcingulate, 19 rostralmiddlefrontal, 20 superiorparietal, 21 frontalpole, 22 insula, 23 caudalmiddlefrontal, 24 cuneus, 25 entorhinal, 26 fusiform, 27 inferiorparietal, 28 isthmuscingulate, 29 lateraloccipital, 30 lateralorbitofrontal, 31 lingual, 32 medialorbitofrontal, 33 parahippocampal, 34 pericalcarine, 35 precuneus, 36 rostralanteriorcingulate, 37 rostralmiddlefrontal, 38 superiorfrontal, 39 superiorparietal, 40 frontalpole. Canonical loadings displayed on the cortical surface (“fsaverage” brain) highlighting the set of brain regions where the multivariate association between neuroanatomical and clinical CVs differed (Δ) between groups.
Discussion
The present study aimed to determine whether autistic symptoms are mediated by shared or distinct patterns of cortical folding in carriers and noncarriers of the 22q11.2 microdeletion. To do so, we employed both a categorical 2-by-2 factorial design treating ASD as a fixed-effect factor and a dimensional approach where ASD was considered a complex clinical latent trait construct allowing for interindividual variability across different symptom domains. Across approaches, we observed a high degree of similarity in the ASD phenotype between individuals with 22q11.2DS and individuals with idiopathic ASD. Despite the high degree of clinical similarity, however, ASD was associated with a different pattern of local gyrification in carriers and noncarriers of the 22q11.2 microdeletion. Our results suggest that ASD has different neuroanatomical underpinnings in 22q11.2DS carriers compared to noncarriers and that 22q11.2DS individuals with ASD represent a neuroanatomically distinct subgroup, at least with regard to cortical folding pattern, that differs from 22q11.2DS individuals without a diagnosis of ASD and from individuals with idiopathic ASD.
Within the categorical analysis, we firstly focused on the main effect of having a 22q11.2 microdeletion. Here, our finding of extensive decreases in lGI in 22q11.2DS is consistent with previous reports suggesting that the syndrome is accompanied by significant cortical folding abnormalities. For example, previous neuroimaging studies report significantly decreased gyrification in middle and inferior temporal regions (Bakker et al. 2016), parietal, precentral, and postcentral regions (Srivastava et al. 2012; Mous et al. 2014; Schmitt et al. 2015), as well as in several cortical midline structures in 22q11.2DS (Srivastava et al. 2012; Schmitt et al. 2015). In addition, we found bilaterally increased lGI in a large cluster spanning the inferior frontal lobe, pre- and postcentral gyri, insula, and superior and middle temporal gyrus in 22q11.2DS. Notably, these brain regions overlap with the sylvian fissure and surrounding areas, where measures of lGI are highly variable, reflecting the large amount of insular cortex hidden within the sylvian fissure during early gyrogenesis (Schaer et al. 2008, 2012). Cortical folding abnormalities might also be underpinned by differences in vertex-wise measures of surface area in similar areas of the brain (i.e., decreased surface area is associated with decreased cortical folding; Hogstrom et al. 2013), which are typically reduced in individuals with 22q11.2DS (Jalbrzikowski et al. 2013; Schmitt et al. 2015; Sun et al. 2018). In 22q11.2DS, differences in lGI have been linked to abnormalities in white matter connectivity (Schaer et al. 2006) potentially mediated by the set of genes affected by the microdeletion (Bearden et al. 2009). More specifically, the deleted region of DNA contains around 30 genes that are typically expressed during early brain development and are known to affect neuronal migration (Maynard et al. 2003). Some of these genes continue to be expressed in the brain during adolescence and adulthood (Maynard et al. 2003) and might therefore impact on the neuroanatomy of the cortex at various stages of development. The findings provided by our study and others hence agree in suggesting that the phenotypic consequences of the 22q11.2 microdeletion are complex and affect the neuroanatomy of the brain in various aspects, including both volumetric as well as geometric differences.
Differences in the geometry of the cortex are also typically observed when examining the brain in idiopathic ASD, where atypical cortical folding has been linked to early perturbations to the developmental trajectory of brain maturation and an abnormal formation of the brain’s neurocircuitry (e.g., Ecker et al. 2016). In the present study, we observed differences in lGI associated with the main effect of ASD predominantly in brain regions where neuroanatomical variability was not associated with the main effect of 22q11.2DS. More specifically, across all individuals with ASD (i.e., including both carriers and nondeletion carriers with ASD), we observed increased lGI in the frontal cortex, in the fusiform gyrus, and in the precentral gyrus. These brain areas have previously been shown to be functionally related to the cluster of behavioral symptoms characteristic for ASD. For instance, neuroanatomical variations in the frontal cortex have been linked to deficits in theory of mind (Castelli et al. 2002) and mentalizing (Lombardo et al. 2009). Moreover, ASD individuals show altered neuroanatomy and functioning of the fusiform face area, which has been associated with the ability to process facial expressions (Golarai et al. 2006). Thus, our results fit well into the previous literature examining the neuroanatomical underpinnings of autistic symptoms in idiopathic ASD. Our study extends these findings by suggesting that the neurobiological underpinnings of ASD in carriers and noncarriers can, however, be separated on the neuroanatomical level. This is also supported by our finding of significant 22q11.2DS-by-ASD interactions, which were observed across several regions of the frontal, parietal, and temporal lobes. Even though these interactions are complex and difficult to interpret, it appears that the neuroanatomical phenotype of 22q11.2DS individuals with ASD does not simply represent a linear combination of 22q11.2DS or ASD alone. Instead, both of these factors seem to interact, leading to a pattern of variability in IGI that cannot be explained by either the microdeletion or ASD alone. Individuals with 22q11.ASD may therefore represent a neuroanatomically distinct group of individuals with a pattern of cortical folding that differs from individuals with 22q11.2DS without ASD and also from individuals with idiopathic ASD.
There has been some debate as to whether a diagnosis of ASD should at all be considered a uniform clinical construct that is similar across syndromic and nonsyndromic manifestations of ASD and that might therefore be encoded as a categorical fixed effect across groups. For example, in our sample, some individuals with 22q11.2DS did not meet diagnostic cutoffs in the repetitive domain of the ADI-R. Although our categorical results remained unchanged after covarying for repetitive symptoms, we therefore also examined ASD within the multivariate dimensional framework of CCA. This allowed us to treat ASD as a continuous latent trait variable spanned by multiple symptom domains and to link interindividual variability in clinical profiles to neuroanatomical variability in multiple brain regions. Subsequently, these complex brain-behavioral associations were compared between carriers and noncarriers. We established that clinical variability across the five symptom domains of the SRS can be reduced to a single latent trait factor, which explained a high degree of clinical variance in both groups. However, while both groups were clinically comparable, the dominant clinical latent trait factor was underpinned by separate patterns of cortical folding in carriers relative to noncarriers deviating most significantly in the anterior cingulate cortex, as well as in the inferior and superior parietal cortices. Both the categorical and the dimensional approach hence converge in suggesting that the neuroanatomical correlates underlying the clinical phenotype of ASD significantly vary between individuals with and without 22q11.2DS and that the neuroanatomical phenotype of ASD in carriers and noncarriers of 22q11.2DS is not directly comparable.
Our results have to be interpreted in consideration of several methodological limitations. First, we included participants with a relatively wide age-range (i.e., from 6 to 25 years). Although we controlled for age in our factorial analysis, we did not include an age-by-group interaction term. Furthermore, we did not covary for age and other confounds in the CCA analysis. It will therefore be important in the future to explore the modulating effects of age and other covariates (e.g., IQ, sex, and site) on the multivariate association between neuroanatomical variability in lGI and the complex clinical phenotype of ASD and to examine age-sensitive developmental changes in local gyrification within and across groups. Further, we employed a multicenter design in order to obtain a larger sample size. However, the reliability of anatomical measures (such as lGI) has been shown to remain unaffected when MRI instrument and data processing factors are controlled for (Han et al. 2006). We have therefore applied the same preprocessing pipeline and quality assessments to all data. Also, due to its parametric nature, our dimensional approach is less vulnerable to bias caused by categorical variables such as site. Last, the gender distribution in our sample differed between idiopathic ASD individuals and the other groups. However, the distribution in our sample reflects the distribution in the respective populations, which is estimated as 4:1 (males to females) in idiopathic ASD (Werling and Geschwind 2013), but approximately equal in 22q11.2DS (Vorstman et al. 2006).
In conclusion, our study is the first to examine differences in local cortical gyrification in individuals with ASD and individuals with 22q11.2DS using two complementary analytical approaches. It is also the first study to include a syndromic and nonsyndromic group of individuals with ASD, in addition to neurotypical controls. Across approaches, we established that although individuals with 22q11.ASD show a similar clinical profile, there was a unique pattern of local gyrification, suggesting that 22q11.ASD represents a subgroup of 22q11.2DS individuals that are neuroanatomically different from individuals with 22q11.2DS and from idiopathic ASD.
Supplementary Material
Funding
This work was supported by the German Research Foundation (DFG) under grant agreement EC480/2-1 awarded to Prof. Ecker, the National Institute of Mental Health (NIMH) with grants R01MH085953, R01MH085953-S1, and R21MH116473-01A1 to Prof. Bearden. This study was further funded by EU AIMS and AIMS-2-TRIALS. EU-AIMS received support from the IMI Joint Undertaking (JU) under grant agreement no.115300, resources of which are composed of financial contribution from the European Union's Seventh Framework Programme (FP7/2007-2013), from the European Federation of Pharmaceutical Industries and Associations (EFPIA) companies' in kind contribution, and from Autism Speaks. AIMS-2-TRIALS received funding from the IMI 2 JU under grant agreement no. 777394. The JU receives support from the European Union's Horizon 2020 research and innovation programme and EFPIA, Autism Speaks, Autistica, and the Simons Foundation Autism Research Initiative.
Notes
Moreover, CE gratefully acknowledges support by grants EC480/1-1 from the DFG under the Heisenberg Programme. DGMM acknowledges support by grants from the Mental Health Biomedical Research Centre (BRC) and the Innovative Medicines Initiative (IMI). Furthermore,we would like to thank the National Institute for Health Research, Biomedical Research Centre for Mental Health, and the Dr Mortimer and Theresa Sackler Foundation.
Conflict of Interest: Prof. Murphy sat on an advisory board for Roche and received an honorarium. No other authors reported any financial interests or conflicts of interests.
References
- Antshel KM, Aneja A, Leslie AE, Strunge L, Peebles J, Fremont WP, Stallone K, Abdulsabur N, Higgins AM, Shprintzen RJ, et al. 2007. Autistic Spectrum disorders in Velo-cardio facial syndrome (22q11.2 deletion). J Autism Dev Disord. 37:1776–1786. [DOI] [PubMed] [Google Scholar]
- Bakker G, Caan MWA, Vingerhoets WAM, Da Silva-Alves F, De Koning M, Boot E, Nieman DH, De Haan L, Bloemen OJ, Booij J, et al. 2016. Cortical morphology differences in subjects at increased vulnerability for developing a psychotic disorder: a comparison between subjects with ultra-high risk and 22q11.2 deletion syndrome. PLoS One. 11:1–16. [DOI] [PMC free article] [PubMed] [Google Scholar]
- Bearden CE, Van Erp TGM, Dutton RA, Lee AD, Simon TJ, Cannon TD, Emanuel BS, Mcdonald-Mcginn D, Zackai EH, Thompson PM. 2009. Alterations in midline cortical thickness and Gyrification patterns mapped in children with 22q11.2 deletions. Cereb Cortex. 19:115–126. [DOI] [PMC free article] [PubMed] [Google Scholar]
- Bölte S, Poustka F. 2008. Skala zur Erfassung sozialer Reaktivität: dimensionale Autismus-Diagnostik; SRS; deutsche Fassung der Social Responsiveness Scale (SRS) von John N. Gruber, Huber: Constantino und Christan P. [Google Scholar]
- Castelli F, Frith C, Happe F, Frith U. 2002. Autism, Asperger syndrome and brain mechanisms for the attribution of mental states to animated shapes. Brain. 125:1839–1849. [DOI] [PubMed] [Google Scholar]
- Constantino JN, Gruber C. 2012. Social responsiveness scale–second edition (SRS-2). Torrance, CA: Western Psychological Services. [Google Scholar]
- Dale AM, Fischl B, Sereno MI. 1999. Cortical surface-based analysis I: segmentation and surface reconstruction. Neuroimage. 194:179–194. [DOI] [PubMed] [Google Scholar]
- Desikan RS, Ségonne F, Fischl B, Quinn BT, Dickerson BC, Blacker D, Buckner RL, Dale AM, Maguire RP, Hyman BT, et al. 2006. An automated labeling system for subdividing the human cerebral cortex on MRI scans into gyral based regions of interest. Neuroimage. 31:968–980. [DOI] [PubMed] [Google Scholar]
- Ecker C, Andrews D, Dell’Acqua F, Daly E, Murphy C, Catani M, Thiebaut De Schotten M, Baron-Cohen S, Lai MC, Lombardo MV, et al. 2016. Relationship between cortical gyrification, white matter connectivity, and autism spectrum disorder. Cereb Cortex. 26:3297–3309. [DOI] [PMC free article] [PubMed] [Google Scholar]
- Fiksinski AM, Breetvelt EJ, Duijff SN, Bassett AS, Kahn RS, Vorstman JAS. 2017. Autism Spectrum and psychosis risk in the 22q11.2 deletion syndrome. Findings from a prospective longitudinal study. Schizophr Res. 188:59–62. [DOI] [PMC free article] [PubMed] [Google Scholar]
- Fischl B, Dale AM. 2000. Measuring the thickness of the human cerebral cortex from magnetic resonance images. Proc Natl Acad Sci. 97:11050–11055. [DOI] [PMC free article] [PubMed] [Google Scholar]
- Fischl B, Rajendran N, Busa E, Augustinack J, Hinds O, Yeo BTT, Mohlberg H, Amunts K, Zilles K. 2007. Cortical folding patterns and predicting Cytoarchitecture. Cereb Cortex. 18:1973–1980. [DOI] [PMC free article] [PubMed] [Google Scholar]
- Fischl B, Sereno M, Dale A. 1999. Cortical surface-based analysis II: inflation, flattening, and a surface-based coordinate system. Neuroimage. 9:195–207. [DOI] [PubMed] [Google Scholar]
- Golarai G, Grill-Spector K, Reiss AL. 2006. Autism and the development of face processing. Clin Neurosci Res. 6:145–160. [DOI] [PMC free article] [PubMed] [Google Scholar]
- Gotham K, Pickles A, Lord C. 2009. Standardizing ADOS scores for a measure of severity in autism Spectrum disorders. J Autism Dev Disord. 39:693–705. [DOI] [PMC free article] [PubMed] [Google Scholar]
- Gudbrandsen M, Daly E, Murphy CM, Wichers RH, Stoencheva V, Perry E, Andrews D, Blackmore CE, Rogdaki M, Kushan L, et al. 2019. The neuroanatomy of autism spectrum disorder symptomatology in 22q11.2 deletion syndrome. Cereb Cortex. 29:3655–3665. [DOI] [PMC free article] [PubMed] [Google Scholar]
- Han X, Jovicich J, Salat D, Kouwe A, Quinn B, Czanner S, Busa E, Pacheco J, Albert M, Killiany R, et al. 2006. Reliability of MRI-derived measurements of human cerebral cortical thickness: the effects of field strength, scanner upgrade and manufacturer. Neuroimage. 32:180–194. [DOI] [PubMed] [Google Scholar]
- Henson RK. 2000. Demystifying parametric analyses: illustrating canonical correlation analysis as the multivariate general linear model. Mult Linear Regres Viewpoints. 26:11–19. [Google Scholar]
- Hiramoto T, Kang G, Suzuki G, Satoh Y, Kucherlapati R, Watanabe Y, Hiroi N. 2011. Tbx1: identification of a 22q11.2 gene as a risk factor for autism spectrum disorder in a mouse model. Hum Mol Genet. 20:4775–4785. [DOI] [PMC free article] [PubMed] [Google Scholar]
- Hiroi N, Hiramoto T, Harper K, Suzuki G, Boku S. 2012. Mouse models of 22q11.2-associated autism spectrum disorder. Autism Open Access. (Suppl 1):1–7. [DOI] [PMC free article] [PubMed] [Google Scholar]
- Hogstrom LJ, Westlye LT, Walhovd KB, Fjell AM. 2013. The structure of the cerebral cortex across adult life: age-related patterns of surface area, thickness, and gyrification. Cereb Cortex. 23:2521–2530. [DOI] [PubMed] [Google Scholar]
- Hotelling H. 1936. Relations between two sets of Variates. Biometrika. 28:21–377. [Google Scholar]
- Jalbrzikowski M, Ahmed KH, Patel A, Jonas R, Kushan L, Chow C, Bearden CE. 2017. Categorical versus dimensional approaches to autism-associated intermediate phenotypes in 22q11.2 microdeletion syndrome. Biol Psychiatry Cogn Neurosci Neuroimaging. 2:53–65. [DOI] [PMC free article] [PubMed] [Google Scholar]
- Jalbrzikowski M, Jonas R, Senturk D, Patel A, Chow C, Green MF, Bearden CE. 2013. Structural abnormalities in cortical volume, thickness, and surface area in 22q11.2 microdeletion syndrome: relationship with psychotic symptoms. NeuroImage Clin. 3:405–415. [DOI] [PMC free article] [PubMed] [Google Scholar]
- Jovicich J, Czanner S, Greve D, Haley E, Van Der Kouwe A, Gollub R, Kennedy D, Schmitt F, Brown G, Macfall J, et al. 2006. Reliability in multi-site structural MRI studies: effects of gradient non-linearity correction on phantom and human data. Neuroimage. 30:436–443. [DOI] [PubMed] [Google Scholar]
- Kunwar A, Ramanathan S, Nelson J, Antshel KM, Fremont W, Higgins AM, Shprintzen RJ, Kates WR. 2012. Cortical Gyrification in Velo-cardio-facial (22q11.2 deletion) syndrome: a longitudinal study. Schizophr Res. 137:20–25. [DOI] [PMC free article] [PubMed] [Google Scholar]
- Libero LE, DeRamus TP, Deshpande HD, Kana RK. 2014. Surface-based morphometry of the cortical architecture of autism spectrum disorders: volume, thickness, area, and gyrification. Neuropsychologia. 62:1–10. [DOI] [PubMed] [Google Scholar]
- Lombardo MV, Chakrabarti B, Bullmore ET, Wheelwright SJ, Sadek SA, Suckling J, Consortium MA, Baron-Cohen S. 2009. Shared neural circuits for Mentalizing about the self and others. J Cogn Neurosci. 22:1623–1635. [DOI] [PubMed] [Google Scholar]
- Lord C, Risi S, Lambrecht L, Cook EH, Leventhal BL, DiLavore PC, Pickles A, Rutter M. 2000. The autism diagnostic observation schedule–generic: a standard measure of social and communication deficits associated with the Spectrum of autism. J Autism Dev Disord. 30:205–223. [PubMed] [Google Scholar]
- Lord C, Rutter M, Le Couteur A. 1994. Autism diagnostic interview-revised: a revised version of a diagnostic interview for caregivers of individuals with possible pervasive developmental disorders. J Autism Dev Disord. 24:659–685. [DOI] [PubMed] [Google Scholar]
- Lorenzo-Seva U, Berge JMF. 2006. Tucker’s congruence coefficient as a meaningful index of factor similarity. Methodology. 2:57–64. [Google Scholar]
- McGlashan TH. 2001. Structured interview for prodromal syndromes (SIPS). New Haven: Yale University. [Google Scholar]
- Maynard TM, Haskell GT, Peters AZ, Sikich L, Lieberman JA, LaMantia AS. 2003. A comprehensive analysis of 22q11 gene expression in the developing and adult brain. Proc Natl Acad Sci U S A. 100:14433–14438. [DOI] [PMC free article] [PubMed] [Google Scholar]
- McDonald-McGinn DM, Sullivan KE, Marino B, Philip N, Swillen A, Vorstman J, Zackai E, Emanuel B, Vermeesch J, Morrow B, et al. 2016. 22q11.2 deletion syndrome. Nat Rev Dis Prim. 1:1–46. [DOI] [PMC free article] [PubMed] [Google Scholar]
- Meechan DW, Tucker ES, Maynard TM, LaMantia A-S. 2009. Diminished dosage of 22q11 genes disrupts neurogenesis and cortical development in a mouse model of 22q11 deletion/DiGeorge syndrome. Proc Natl Acad Sci. 106:16434–16445. [DOI] [PMC free article] [PubMed] [Google Scholar]
- Mous SE, Karatekin C, Kao C-Y, Gottesman II, Posthuma D, White T. 2014. Gyrification differences in children and adolescents with velocardiofacial syndrome and attention-deficit/hyperactivity disorder: a pilot study. Psychiatry Res Neuroimaging. 221:169–171. [DOI] [PubMed] [Google Scholar]
- Murphy KC, Jones LA, Owen MJ. 1999. High rates of schizophrenia in adults with velo-cardio-facial syndrome. Arch Gen Psychiatry. 56:940–945. [DOI] [PubMed] [Google Scholar]
- Pillai K. 1955. Some new test criteria in multivariate analysis. Ann Math Stat. 26:117–121. [Google Scholar]
- Scambler PJ, Kelly D, Lindsay E, Williamson R, Goldberg R, Shprintzen R, Wilson DI, Goodship JA, Cross IE, Burn J. 1992. Velo-cardio-facial syndrome associated with chromosome 22 deletions encompassing the DiGeorge locus. Lancet. 339:1138–1139. [DOI] [PubMed] [Google Scholar]
- Schaer M, Cuadra MB, Tamarit L, Lazeyras F, Eliez S, Thiran J-P. 2008. A surface-based approach to quantify local cortical Gyrification. IEEE Trans Med Imaging. 27:161–170. [DOI] [PubMed] [Google Scholar]
- Schaer M, Cuadra MB, Schmansky N, Fischl B, Thiran JP, Eliez S. 2012. How to measure cortical folding from MR images: a step-by-step tutorial to compute local Gyrification index. J Vis Exp. 10. [DOI] [PMC free article] [PubMed] [Google Scholar]
- Schaer M, Eric Schmitt J, Glaser B, Lazeyras F, Delavelle J, Eliez S. 2006. Abnormal patterns of cortical gyrification in velo-cardio-facial syndrome (deletion 22q11.2): an MRI study. Psychiatry Res. 146:1–11. [DOI] [PubMed] [Google Scholar]
- Schaer M, Ottet M-C, Scariati E, Dukes D, Franchini M, Eliez S, Glaser B, Chugani D, Ecker C. 2013. Decreased frontal gyrification correlates with altered connectivity in children with autism. Front Hum Neurosci. 7:1–13. [DOI] [PMC free article] [PubMed] [Google Scholar]
- Schmitt EJ, Vandekar S, Yi J, Calkins ME, Ruparel K, Roalf DR, Whinna D, Souders MC, Satterwaite TD, Prabhakaran K, et al. 2015. Aberrant cortical Morphometry in the 22q11.2 deletion syndrome. Biol Psychiatry. 78:135–143. [DOI] [PMC free article] [PubMed] [Google Scholar]
- Schneider M, Debbané M, Bassett AS, Chow EWC, Fung WLA, Bree MBM, Owen M, Murphy KC, Niarchou M, Kates WR, et al. 2014. Psychiatric disorders from childhood to adulthood in 22q11.2 deletion syndrome: results from the international Consortium on brain and behavior in 22q11.2 deletion syndrome. Am J Psychiatry. 171:627–639. [DOI] [PMC free article] [PubMed] [Google Scholar]
- Schreiner MJ, Lazaro MT, Jalbrzikowski M, Bearden CE. 2013. Converging levels of analysis on a genomic hotspot for psychosis: insights from 22q11.2 deletion syndrome. Neuropharmacology. 68:157–173. [DOI] [PMC free article] [PubMed] [Google Scholar]
- Ségonne F, Dale AM, Busa E, Glessner M, Salat D, Hahn HK, Fischl B. 2004. A hybrid approach to the skull stripping problem in MRI. Neuroimage. 22:1060–1075. [DOI] [PubMed] [Google Scholar]
- Snedecor G, Cochran W. 1989. Statistical Methods. 8th ed. Ames, Iowa: Iowa State University Press. [Google Scholar]
- Srivastava S, Buonocore MH, Simon TJ. 2012. Atypical developmental trajectory of functionally significant cortical areas in children with chromosome 22q11.2 deletion syndrome. Hum Brain Mapp. 33:213–223. [DOI] [PMC free article] [PubMed] [Google Scholar]
- Sun D, CRK C, Lin A, Forsyth JK, Kushan L, Vajdi A, Jalbrzikowski M, Hansen L, Villalon-Reina JE, Qu X, et al. 2018. Large-scale mapping of cortical alterations in 22q11.2 deletion syndrome: convergence with idiopathic psychosis and effects of deletion size. Mol Psychiatry. 1–13. [DOI] [PMC free article] [PubMed] [Google Scholar]
- Vorstman JAS, Morcus MEJ, Duijff SN, Klaassen PWJ, Heineman-De Boer JA, Beemer FA, Swaab H, Kahn RS, Van Engeland H. 2006. The 22q11.2 deletion in children: high rate of autistic disorders and early onset of psychotic symptoms. J Am Acad Child Adolesc Psychiatry. 45:1104–1113. [DOI] [PubMed] [Google Scholar]
- Wallace GL, Robustelli B, Dankner N, Kenworthy L, Giedd JN, Martin A, Wallace GL. 2013. Increased gyrification, but comparable surface area in adolescents with autism spectrum disorders. Brain. 136:1956–1967. [DOI] [PMC free article] [PubMed] [Google Scholar]
- Wechsler D. 1999. Wechsler abbreviated scale of intelligence. San Antonio (TX): Psychological Corporation. [Google Scholar]
- Welker W. 1990. Why does cerebral cortex fissure and fold? In: Jones E, et al., editors. Cerebral cortex. New York: Springer Sience+Business Media, pp. 3–136. [Google Scholar]
- Werling DM, Geschwind DH. 2013. Sex differences in autism spectrum disorder. Curr Opin Neurol. 26:146–153. [DOI] [PMC free article] [PubMed] [Google Scholar]
- Worsley K, Andermann M, Koulis T, Macdonald D, Evans A. 1999. Detecting changes in non-isotropic images. Hum Brain Mapp. 8:98–101. [DOI] [PMC free article] [PubMed] [Google Scholar]
- Yang D, Beam D, Pelphrey KA, Abdullahi S, Jou RJ, Yang DY-JY-J, Beam D, Pelphrey KA, Abdullahi S, Jou RJ. 2016. Cortical morphological markers in children with autism: a structural magnetic resonance imaging study of thickness, area, volume, and gyrification. Mol Autism. 7:11. [DOI] [PMC free article] [PubMed] [Google Scholar]
- Zilles K, Armstrong E, Schleicher A, Kretschmann H-J. 1988. The human pattern of gyrification in the cerebral cortex. Anat Embryol (Berl). 179:173–179. [DOI] [PubMed] [Google Scholar]
Associated Data
This section collects any data citations, data availability statements, or supplementary materials included in this article.