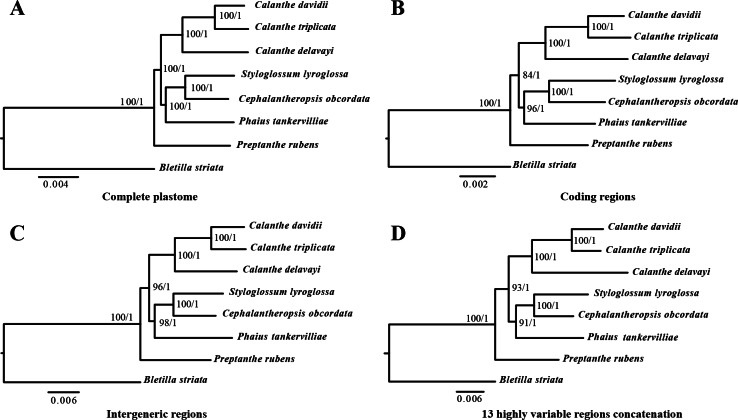
Figure 8. Phylognetic relationships of the seven Calanthe s.l. taxon constructed by four DNA data sets.
Including (A) whole plastome sequences, (B) coding regions, (C) intergeneric regions, and the (D) 13 highly variable regions concatenation with Maximum likelihood (ML), and Bayesian inferencee (BI) methods. ML topology shown with ML bootstrap support value/Bayesian posterior probability listed at each node.

