

Abstract
Risk preference theory argues that the gender gap in religiosity is caused by greater female risk aversion. Although widely debated, risk preference theory has been inadequately tested. Our study tests the theory directly with phenotypic and genetic risk preferences in three dimensions—general, impulsive, and sensation-seeking risk. Moreover, we examine whether the effect of different dimension of risk preference on the gender gap varies across different dimensions of religiosity. We find that general and impulsive risk preferences do not explain gender differences in religiosity, whereas sensation-seeking risk preference makes the gender gap in self-assessed religiousness and church attendance insignificant, but not belief in God, prayer, or importance of religion. Genetic risk preferences do not remove any of the gender gaps in religiosity, suggesting that the causal order is not from risk preference to religiosity. Evidence suggests that risk preferences are not a strong predictor for gender differences in religiosity.
Keywords: religiosity, risk preferences, genetic risk preferences, gender
INTRODUCTION
In most societies, women are more religious than men (Walter and Davie 1998, Stark 2002, Trzebiatowska and Bruce 2012, Hackett, Murphy, and McClendon 2016). For example, data from the U.S. General Social Survey show that about 61% of women read the Bible, pray privately, or mediate on a daily basis whereas about 43% of men do so (Maselko and Kubzansky 2006). A lively debate develops over the past two decades about whether this gender gap in religiosity is caused by differences in risk preference between men and women (e.g., Sullins 2006, Freese and Montgomery 2007, Roth and Kroll 2007, Collett and Lizardo 2009, Edgell, Frost, and Stewart 2017, Hoffmann 2009, Hoffmann 2019). Risk preference theory argues that irreligiousness is a form of risk taking because irreligiousness risks eternal punishment such as going to hell. Because women tend to be more risk averse than men, they are more religious (Miller and Hoffmann 1995, Miller and Stark 2002). Risk preference theory also argues that the biological risk aversion differs between men and women, thus accounting for the gender gap in religiosity. It further suggests that biological explanations might obviate socialization explanations for greater female religiousness. (Miller and Stark 2002, Stark 2002).
Despite progress made, there is no scholarly consensus on why this gap exists. Studies in the debate still rely primarily on indirect measures of risk. For example, Roth and Kroll (2007) use belief in life after death or belief in hell as a proxy for risk preference. Because both risk preference and biological risk preference are seldom tested directly, it is always possible to find an alternative theory. Further, alternative theories generally explain only part of the gender gap in religiosity. That is, gender differences in religiousness persist even after controlling for mother’s SES (Collett and Lizardo 2009), discrimination (Edgell, Frost, and Stewart 2017), income (Schnabel 2016), education and political conservatism (Baker and Whitehead 2016), or social context (Schnabel 2018). If we can assume that religiosity has more than one cause, showing that other factors explain part of the gender gap in religiosity does not disprove risk preference theory. In addition, many of the arguments used to critique risk preference theory are compatible with the theory. For example, Sullins (2006) shows that in some contexts the gender gap is small or reversed. However, this does not mean that risk preference is not at work. It merely suggests that either risk preference is not the only cause of the gap or that social context influences how risky irreligiosity is for men and women.
In this study, we directly gauge the impact of risk preference on the religiosity of men and women by three measures—general risk, impulsive risk, and sensation-seeking risk. This enables us to test whether different dimensions of risk preference influence the gender gap in religiosity differently. Our study also examines how risk preferences influence the gender gap for multiple dimensions of religiosity. Prior research shows that the gender gap varies for different measures of religiosity (Walter and Davie 1998). We measure religiosity by belief in God, prayer, importance of religion, self-assessed religiousness, and church attendance. These measures cover belief, identity, and the routine practices of both private and public religiosity. Analyzing the effect of risk preference on the gender gap for each of these measures of religiosity helps isolate probable mechanisms through which risk preference works. Finally, we directly test the biological explanation for the gender gap in religiosity using genetic data from the National Longitudinal Study of Adolescent to Adult Health (Add Health). We measure genetic risk preferences based on 41 genes discovered from transgenic and knock-out models of mouse (Maxson 2009).
The genetic data also help minimize problems with causal order. A weakness of the studies in the debate is that they pay little attention to causal order. That is, while risk preference might influence religiosity, religiosity might also influence risk preference. Because an individual’s genome is determined when the egg is fertilized and remains fixed over the life course (except for rare mutations), the effects of genetic risk preferences on religiosity are more likely to be mono-directional—from risk preference to religiosity. We stress that we do not mean to imply that social causes do not matter. We wish to test whether genetic risk preferences also matter and whether they helps explain the gap between the religiosity of men and women.
Risk Preference Theory and the Debate
In a broad review of literature on the topic, Miller and Stark (2002) find that there is little persuasive empirical evidence that socialization explains the gender gap in religiosity. Miller and colleagues argue that risk preference theory may be the answer (Miller and Stark 2002, Miller and Hoffmann 1995). Being religious may be a way to avoid the risk of punishment in the afterlife. Thus, “[o]ne can conceive of religious acceptance as risk-averse behavior and the rejection of religious beliefs as risk-taking behavior” (Miller and Hoffmann 1995:66). Past research shows that men are more likely than women to take risks (e.g., Hagan, Simpson, and Gillis 1988, Bromiley and Curley 1992, Zuckerman, Ball, and Black 1990, Forthun et al. 1999), and that men interpret identical circumstances as less risky than women (Roth, Schumacher, and Brähler 2005, Bell, Schoenrock, and O’Neal 2000). Thus, if risk aversion causes religiosity, then this gender difference in risk aversion may explain the gender difference in religiosity. Figure 1 helps orient our discussion. In Figure 1, Paths 3 and 4 correspond to Miller and Stark’s explanation, with some religious beliefs intensifying or diminishing the religious risk (Path 9).
Figure 1:
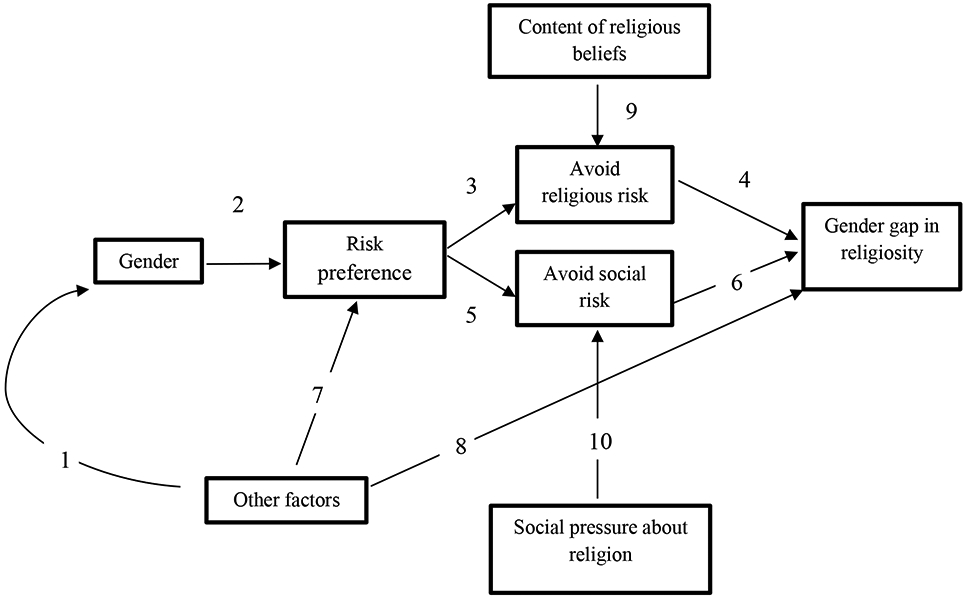
Modeling past research about risk preference and religiosity
Studies that evaluate risk preference theory assume one of the following two causal paths from gender to risk preference to religiosity: (a) through a theological mechanism (represented by Paths 3 and 4 in Figure 1) or (b) through a social mechanism (represented by Paths 5 and 6). Roth and Kroll (2007) assume a theological mechanism by arguing that being irreligious is risky only if a person believes that there are negative consequences such as posthumous punishment (Path 9 influences Paths 3 and 4). If a person does not believe in life after death, it is hard to connect risk preferences with religiosity. Risk perceptions should only exist among those who believe in an afterlife, and gender differences in religiosity should be larger among believers than nonbelievers. Using the General Social Survey (GSS) and World Values Survey (WVS) data, however, Roth and Kroll find the opposite: the gender gap in religiosity is larger and more significant among nonbelievers than among believers. Freese and Montgomery (2007) assume a similar theological mechanism based on belief in heaven and hell. They argue that risk preference theory leads to ambiguous predictions regarding the direction of the gender gap. For example, among individuals who believe in heaven but not hell, the authors claim that men should be more religious, whereas among individuals who believe in hell but not heaven, women should be more religious. Their analysis shows that the gender gap is no smaller among those who do not believe in hell. This finding is the opposite of what the authors contend risk preference theory predicts.
Alternatively, risk aversion might promote religiosity through a social mechanism. Miller and Hoffmann (1995) argue that parents hedge their bets by attending religious services. When individuals have children, they may start to attend church to help provide a moral education for their children because they fear their children may end up being immoral otherwise. Edgell and colleagues (2017) argue that women are more likely to be sanctioned for nonconforming behaviors than men. Thus, choosing to be nonreligious is more socially risky for women. To avoid stigma or social sanctioning, women tend to choose to be religious (Path 10 influences Paths 5 and 6). Drawing on power-control theory, Collett and Lizardo (2009) argue that gender differences in risk aversion are attributable to a social mechanism—gender socialization practices. Patriarchal families differentially socialize their sons and daughters with traditional gender values. Such differential socialization leads to a lower taste for risk among daughters but not for sons. The authors contend that the gender gap in religiousness is greater among women raised by mothers of lower socioeconomic status (SES) than by mothers of higher SES (SES is their proxy for patriarchy). In Figure 1, this argument can be viewed in several ways. Risk aversion could still cause the gender gap in religiosity, but patriarchy or SES also influences gender differences in risk preference (Path 7 in addition to other paths), and/or patriarchy or SES changes the social risk of irreligiousness for some women (Path 10 influences Paths 5 and 6). In other words, the critiques of both Edgel et al (2017) and Collett and Lizardo (2009) are compatible with a version of risk preference theory.
Limitations of Previous Research
So far, evaluations of risk preference theory have been admittedly unsatisfactory (Miller and Stark 2002, Freese and Montgomery 2007, Hoffmann 2019), because most studies including the studies reviewed above test the theory indirectly (see Table 1 in Hoffmann 2019 for a summary). Indirect tests do not provide strong evidence for or against risk preference theory (Hoffman 2009). At best, researchers test the theory using a single measure of risk preference, primarily with a sample of students. Miller and Hoffmann (1995) use data from a national sample of high school seniors and measure adventure seeking, that is, self-reported attraction to risk and danger. Ellis and colleagues (2016) use a sample of college students and average self-assessments of being a risk taker and of enjoying taking risks. Hoffman (2019) uses a sample of adolescents and constructs a latent risk-taking factor based on three questions—”You like to take risks;” “I like to test myself every now and then by doing something a little risky;” and “I get a real kick out of doing things that are a little dangerous.” Freese (2004) uses the WVS data and measures risk preference with a 10-point scale where 1 indicates “one should be cautious about making major changes” and 10 indicates “you will never achieve much in life unless you act boldly.”
Table 1.
Descriptive statistics and coding
| Variable | Coding | Wave III |
Wave IV |
|---|---|---|---|
| Belief in God (mean) |
Believe in God and always have yes-1; 0-no |
.84 | ---- |
| Prayer (mean and S.D.) |
Monthly frequency of private prayer when alone never-0, less than once a month-0.5, once a month-1, a few time a month-2, once a week-4, a few times a week-10, once a day-30, and more than once a day-60 |
17.49 (20.82) |
20.84 (22.84) |
| Importance (proportion) |
“How important is your religious faith to you?” more important than anything very important somewhat important not important |
.11 .43 .33 .13 |
.11 .43 .33 .13 |
| Self-assessed religiousness (proportion) |
“To what extent are you a religious person?” very religious moderately religious slightly religious not religious at all |
.13 .35 .35 .17 |
---- ---- ---- ---- |
| Attendance (mean and S.D.) |
Monthly frequency of religious service attendance never-0, a few times-0.2, several times-0.5, once a month-1, 2 or 3 times a month-2.5, once a week-4 and more than once a week-9 |
1.66 (2.52) |
1.60 (2.50) |
| Gender (mean) | woman-1; man-0 | .52 | ---- |
| Age (mean and S.D.) |
Age | 21.95 (1.70) |
28.44 (1.75) |
| Race/ethnicity (proportion) |
Asian Black Multiracial Other White |
.07 .17 .04 .03 .68 |
---- ---- ---- ---- ---- |
| Education (mean) | college or higher-1; otherwise-0 | .54 | .67 |
| Employment (mean) |
Currently employed yes-1; 0-no |
.71 |
.81 |
| Income (proportion) |
<15k 15k-50k >50k |
.37 .39 .25 |
.08 .60 .32 |
| Marital status (mean) |
Currently married yes-1; 0-no |
.18 |
.44 |
| Whether respondent has a child (mean) |
Has a child or children yes-1; 0-no |
.20 |
.50 |
| Raised religious (mean) |
Raised in religion yes-1; 0-no |
.90 |
---- |
| Religion (proportion) |
Black protestant Catholic Evangelical protestant Mainline protestant No religion Other religion |
.05 .25 .32 .09 .19 .10 |
.05 .25 .31 .09 .19 .11 |
| N | 2,148- 2,211 |
1,887- 2,010 |
The conclusions of these studies are mixed. Miller and Hoffman (1995) and Hoffman (2019) argue that risk preference theory is supported because the gender gap in religiosity declines after controlling for the risk measures. Freese (2004) and Ellis and colleagues (2016) argue that the theory is not supported because when they control for risk preference the reduction in the gender gap is small, insignificant, or negative. It is difficult to interpret these results. One reason is that these studies use different samples and measure risk and religiosity differently.
Specifying the type of risk preference and the measure of religiosity matters because, for example, the religious traditions that predominate in our U.S.-based sample (i.e., Catholic and Protestant Christian) have teachings about some types of risk, but not others. Christian groups may teach adherents to avoid some types of risk (e.g., drug use and sexual activity with multiple partners), while simultaneously advocating other types of risk (e.g., doing social service in dangerous places). Thus, the relationship between Christian teaching and risk preference is complex.
Moreover, the research on risk preference theory has paid little attention to causal order—although risk preference might influence religiosity, religiosity might also influence particular types of risk preference. By measuring genetic predispositions towards risk, this study attempts to circumvent this causal order problem. Genes are determined at the time of conception and remain fixed throughout life except for mutations (the mutation rate is about 1 to 200 mutated base pairs in the whole genome that consists of about 3 billion base pairs per generation). Genetic risk preferences are more likely to precede religiosity than the social variables used in previous analyses. In our analysis, the causal order is likely to go from genetic risk preferences to religiosity, not the other way around. If we find that genetic risk preferences reduce the gender gap in religiosity, this is evidence that biological differences explain some of the gender differences in religiosity and that risk aversion causes at least some religiousness. If we find that genetic risk aversion does not influence religiosity and/or does not significantly reduce the gender gap in religiosity, this is evidence against risk preference theory.
Other studies claim to disprove risk preference theory by showing that factors other than risk aversion are important. For example, women with high SES are less religious than women with low SES, and women with high SES are closer to the religiosity of high SES men (Baker and Whitehead 2016, Hastings and Lindsay 2013, Schnabel 2016). Schnabel (2018) finds that social context (i.e., Christian vs. Muslim and Jewish nations) can also affect the gender gap. However, these findings might mean that there are additional causes of religiosity that are correlated with gender (Path 8 in Figure 1) and/or that social context influences the amount of social pressure to be religious (Path 10 influences Paths 5 and 6). For example, if in Muslim and Orthodox Jewish communities men experience more social pressure to be religious then women do, Schanbel’s (2018) findings are compatible with risk preference theory. For risk preference theory to work, risk preference does not have to be the only cause of religiosity to have an equal impact in every context.
Varying Gender Gap in Religiosity
The concept of religiosity has multiple dimensions (Cornwall et al. 1986, Hartman and Hartman 2009). Previous studies find that gender differences in religiosity vary across dimensions of religiosity. De Vaus and McAllister (1987) find that the differences between men and women are larger for religious belief than for religious revelation, religious commitment, or church attendance. Feltey and Poloma (1991) also find that women report higher levels of prayer and intimacy with God, but not greater orthodoxy, importance of religion, or church attendance. Miller and Stark (2002) report that the gender gap in prayer is larger than the gender gap in Biblical authority, Bible reading, church attendance, and denominational loyalty. Roth and Kroll (2007) examine the gender gap in religiousness between believers in life after death and nonbelievers. Among nonbelievers the authors find a gender gap only in prayer and biblical authority.
Sullins (2006) goes a step further and proposes a typology to explain why the gender gap is larger for some measures of religiosity than for others. Sullins divides the different measures into “active” and “affective” religiousness and demonstrates that gender differences are smaller in “active” religiousness than in “affective” religiousness. Active religiousness includes church membership, church attendance, and church activities, while affective religiousness includes frequency of prayer, closeness to God, and a self-assessment of religiousness. Sullins argues that men disproportionately express their religiosity through action, and women disproportionately through affect.
Findings that the gender gap is larger for some measures of religiosity than for other measures suggest that the mechanisms that cause these varying gaps may differ. Moreover, particular types of risk preferences might influence some dimensions of religiosity, but not others. For example, social risk aversion (e.g., fear of what others will think) might influence the more public aspects of religiosity, but not the more private aspects. Conversely, theological risk aversion is likely to influence all forms of religiosity equally since God can see them all. In this study, using multiple measures of religiosity allows us to test this.
Debate about Biological Explanations for the Gender Gap
Risk preference theory typically emphasizes biological explanations for gender differences in risk preference. Miller and Stark (2002) find that gender differences in religiousness are similar between traditionalists and liberals, and between societies that advocate gender equality and those that do not. The authors speculate that biologically-based risk preference is the cause, as socialization explanations seems to fail. Drawing on research that suggests a biological component to criminal activity (Gottfredson and Hirschi 1990), Stark (2002) argues that biology influences risk preferences, and thus biology also influences differences in religiosity between men and women.
Sullins (2006) challenges the biological basis for risk preference theory by arguing that women are not universally more religious than men. For example, among Jews and Muslims, men are more religious than women. However, these counter examples may be caused by theology. In these religious traditions, men are required to attend public religious services while women are not. Moreover, subsequent research suggests that Muslim and Jewish women are generally more religious than men in other dimensions of religiosity such as daily prayer (Hartman 2016, Hartman and Hartman 2009). Variation in the gender gap among Jews and Muslims does not disprove risk preference theory. If religiosity is caused by more than one factor, biological risk preference might still influence differences in religiosity.
To date, empirical tests of the biological explanation proposed by risk preference theory have been indirect. For example, Ellis and colleagues (2016) measure the level of testosterone by the relative length of the second and fourth fingers, height, self-rated muscularity, self-rated physical strength, and self-rated athletic ability. The authors do not find evidence that the gender gap has a biological basis. However, as the authors acknowledge, the main limitations are the indirect measurement of testosterone and that testosterone is not equivalent to risk preference.
Taking advantage of significant progress in molecular genetics of risk preference, our study is the first to measure genetic predispositions towards risk preference to investigate links among risk preference, religiosity, and gender. We emphasize that if results show that genes influence risk preference and/or religiosity, it is not a deterministic relationship that would require these traits to have only one cause. Rather, both risk preference and religiosity are complex social phenomenon with numerous causes. Genetic risk aversion might be only one of numerous factors that work together to influence religiosity.
Genetic Root of Risk Preference
Twin studies suggest that genetic influences account for about 20% to 50% of the variation in various types of risk taking (e.g., Cesarini et al. 2009, Lin et al. 1998). Unlike rare Mendelian traits that are determined by a single gene (Glazier, Nadeau, and Aitman 2002), risk preference is a complex trait influenced by a large number of genes (Kreek et al. 2005). Some specific genes are associated with both risk taking and novelty seeking including Ankyrin repeat and kinase domain containing 1 (ANKK1), dopamine receptor D3 and D4 (DRD3 and DRD4) and a serotonin transporter region (5-HTTLPR) (Kreek et al. 2005, Kuhnen and Chiao 2009, Lusher, Chandler, and Ball 2001, Schinka, Letsch, and Crawford 2002, Primus et al. 1997). For example, an individual with two copies of the short allele of the 5-HTTLPR tends to take less risk than one with one or two copies of the long allele of the genotype (Cesarini et al. 2009). In addition, genetic variations affect the physiology of the dopaminergic and serotonergic systems, and this may account for differences in risk preference (CALDÚ and Dreher 2007, Hariri et al. 2002).
Studying rodents can help identify the genetic architecture for risk preference in humans. Approximately 99% of genes in mice have direct counterparts in human genes (Consortium 2002). In transgenic and knockout studies of mice, researchers can determine exactly which genes increase aggressive behavior. In addition, the phenotype of rodents can be measured more precisely, and the genetic background and environmental conditions can be controlled more easily among mice than among humans. Few studies examine the genetics of risk preference in mice, but there are a number of studies of aggression in mice (Maxson 2009). Correlation between risk-taking behavior and aggression has been found in both mice (Blaszczyk et al. 2000) and humans (Caspi et al. 1997). Given that humans and mice have similar biological pathways through which aggression is mediated (Nelson and Trainor 2007), it is feasible to use aggression-related genes discovered in mice to study risk taking in humans. In our analysis, we use 41 genes discovered in transgenic or knock-out models of mice (Maxson 2009) to calculate genetic predispositions towards general risk, impulsive risk, and sensation-seeking risk.
Hypotheses
The current study has three objectives: (1) to examine whether different types of risk preference explain the gender gap in different measures of religiosity; (2) to test the biological explanation of gender differences in religiosity; and (3) to use genetic data to help circumvent the causal order problem. According to risk preference theory, unless religious groups teach women to take more risks than men (which seems unlikely), when we control for self-reported risk preference the gender gap in religiosity should significantly diminish.
H1: If genetic risk preference reduces religiosity and men have a greater genetic predisposition to risk taking than women, when we control for genetic predispositions towards risk the gender gap in religiosity should significantly diminish.
As discussed above, while the association between general risk and religious teaching is ambiguous, both impulsive risk and sensation-seeking risk are likely to be negatively associated with religiosity. Therefore,
H2: Impulsive risk and sensation-seeking risk are more likely to reduce the gender gap than general risk.
Most aspects of religiosity have both a public and private component, but of the five measures of religiosity we use, church attendance is more publicly observable, whereas belief in God, private prayer, and importance of religion are less publicly observable. Self-assessed religiosity integrates both public and private aspects of religion (presumably, an individual’s assessment of his or her religiosity includes both public and private religious behaviors). If risk preference theory works through a theological mechanism such as risking eternal damnation, when we control for risk preference, the gender gap in religiosity should diminish for all forms of religiosity. If risk preference theory works through a social mechanism such as fear of being perceived as immoral, when we control for risk preference, the gender gap in religiosity diminishes primarily for the more publicly observable forms of religiosity, particularly church attendance and to a lesser extent self-assessed religiosity. Because past research suggests a theological mechanism is unlikely (Roth and Kroll 2007; Freese and Montgomery 2007), we hypothesize that
H3: Both self-reported and genetic predispositions to risk aversion will reduce the gender gap in religiosity, but especially for the more publicly observable forms of religiosity.
It should be noted that we view the public-private distinction as a continuum, not a distinct dichotomy.
DATA AND METHODS
Data
Data come from the genetic subsample of the National Longitudinal Study of Adolescent to Adult Health (Add Health). Add Health started as a school-based study of adolescents in grades 7-12 in the United States (Harris et al. 2009). A nationally representative sample of schools was selected in 1994-95. In-home interviews collected data on approximately 20,000 respondents. Respondents were interviewed in 1994-95 (Wave I) and followed up in 1995-96 (Wave II), 2001-02 (Wave III), and 2008-09 (Wave IV). During in-home interviews, respondents were asked about behaviors and traits including religiosity and personality. Saliva samples were collected and genotyped at Wave III. The genetic subsample consists of siblings and twins. The total number of respondents in the genetic subsample is 2,612. The Institute of Behavior Genetics at the University of Colorado, Boulder isolated DNA from buccal cells with an average yield of 58 ± 1 μg. The genotype data used in this analysis were based on an Illumina GoldenGate assay. The GoldenGate array targeted 1,536 single nucleotide polymorphisms, or SNPs. A total of 1,140 SNPs in 130 genes were successfully genotyped and survived cleaning. The number of respondents whose DNA was successfully genotyped was 2,2811.
Cross-nationally the gender gap is most consistent for Christians, but also exists in a weaker form for Eastern religions (e.g., Buddhism and Hinduism). There are few Buddhists and Hindus in the sample. For Muslims and Jews, previous research suggests that the gender gap is more complex; it varies for public versus familial or private religiosity (Sullins 2006, Hartman 2016, Hackett, Murphy, and McClendon 2016). Thus, to give a less complex test of risk preference theory, we limit our sample to Christians and the non-religious—dropping the small number of Jews, Muslims, Buddhists, and Hindus from the analysis. This choice minimizes variation in theological and social pressures about what is considered risky for men and for women. In Figure 1, this choice minimizes the ability of Paths 9 and 10 to alter the relationship between risk preference and religiosity.
Measures
The dependent variables are belief in God, monthly frequency of prayer, monthly frequency of religious service attendance, how important religious faith is to the respondent, and how religious the respondent is. Table 1 reports the coding for these variables. All religiosity variables were measured at Waves III and IV when respondents were about 22-29.
We code the three dimensions of risk preference so that higher values indicate higher levels of risk aversion. We measure general risk using a question from Wave III. Respondents were asked how strongly they agreed with the statement “I like to take risks.” Responses to this question were (1) strongly agree, (2) agree, (3) neither agree nor disagree, (4) disagree, and (5) strongly disagree. We measure impulsive risk according to the definition by Moeller et al. (2001). Moeller et al. define impulsivity as a predisposition toward unplanned reactions without consideration of consequences. We sum responses to three questions from Wave III. Respondents were asked how strongly they agreed with these statements: (1) “I go out of my way to avoid having to deal with problems in my life.” (2) “When making a decision, I go with my ‘gut feeling’ and don’t think much about the consequences of each alternative.” and (3) “I live my life without much thought for the future.” Responses to this question were (1) strongly agree, (2) agree, (3) neither agree nor disagree, (4) disagree, and (5) strongly disagree.
We measure sensation-seeking risk with Wave III data. Respondents were given seven pairs of sentences and asked to choose the sentence that best described them. The seven pairs are: (1) “I like wild, uninhibited parties” and “I like quiet parties with good conversation.” (2) “I often like to drink alcohol or smoke marijuana” and “I don’t like to drink alcohol or smoke marijuana.” (3) “I like to have new and exciting experiences and sensations, even if they are a little frightening, unconventional, or illegal” and “I am not interested in experience for its own sake.” (4) “I like to date people who are physically exciting” and “I like to date people who share my values.” (5) “A person should have considerable sexual experience before marriage” and “It’s better if two married people begin their sexual experience with each other.” (6) “If I had lots of money, I would fly around the world and have fun like some rich people do” and “Even if I had the money, I would not want to just fly around the world and have fun like some rich people do.” (7) “I feel best after having a couple of drinks” and “Something is wrong with people who need liquor to feel good.” The risk aversion propensity is the sum of the seven items. The sentence that indicates risk taking was assigned a value of 1, and the sentence that indicates risk aversion is assigned a value of 2.
These seven items come from the widely used Sensation Seeking Scale (Zuckerman 1979). The Sensation Seeking Scale (SSS) “aims to predict the propensity to engage in risk-taking behavior that has an element of thrill, sensation, or disinhibition” (Meertens and Lion 2008: 1507). The SSS is a predictor of high-risk activities (Zuckerman and Kuhlman 2000) and is associated with individual differences in cortical arousal thresholds and levels of enzymes and neurotransmitters affecting the central nervous system (Geen 1997).
Control variables are age, race/ethnicity, education, employment status, income, marital status, whether the respondent has a child or children, whether the respondent was raised in a religion, and religious affiliation. These control variables are similar to those in other studies evaluating risk preference theory (e.g., Roth and Kroll 2007). Missing values in the control variables are imputed using multiple imputation (Rubin 1987). We do not impute missing values in the religiosity and risk measures—the key variables in this study.
Analytical Strategy
We employ generalized estimating equation (GEE) models (Liang and Zeger 1986) to assess the effects of gender and risk preferences on religiosity. We use a logistic GEE model for the dichotomous dependent variable (belief in God), linear GEE models for the continuous dependent variables (frequency of prayer and religious service attendance), and ordered logit GEE models for the ordinal dependent variables (importance of religious faith and how religious the respondent is). We specify exchangeable working correlation structure to address the within-person correlations as well as within-family correlations. Equation (1) describes the basic structure of the GEE models.
| (1) |
where Religiosityijk is the religiosity measure for individual i from family j at Wave k. When modeling belief in God and how religious an individual reports to be, only data from Wave III are used because belief in God and degree of religiosity are measured at Wave III only.
To calculate the genetic risk scores, we select 41 autosomal genes because of their implication in aggression. A total number of 39 genes come from knock-out or transgenic studies of aggressive activity in mice. (Maxson and Canastar 2003, Maxson 2009). The CCKBR and AVPR1A genes in our genotype data have similar functions to those of the CCK2 and AVPR1B genes summarized by Maxson’s (2009). SNPs in these two genes are also included in the calculation. Maxson’s review (2009) points out that aggression in male mice might not be caused by the same genes that cause aggression in female mice. One reason for this difference is that female aggression may be related to hormonal changes or protection of offspring. For example, female mice may exhibit different levels of aggression during pregnancy or lactation. Therefore, some genes may affect both male and female mice, whereas other genes may affect only male or female mice. This suggests a potential interaction between the 41 genes and sex (see Appendix for information on the 41 genes). Our calculation is similar to the polygenic score approach proposed by Purcell and colleagues (2009) and takes into account the interaction with gender (see Appendix for details). Table 2 shows that the genetic risk aversion scores are all highly predictive of the self-reported risk aversion scores, suggesting that the genetic scores are a valid measure of risk preference.
Table 2.
Genetic risk aversion predicting self-reported risk aversion
| Coefficient | Standard error |
N | ||
|---|---|---|---|---|
| Model 1 | Dependent variable: self-reported general risk Independent variable: genetic general risk score |
.08** | .03 | |
| 2,211 | ||||
| Model 2 | Dependent variable: self-reported impulsive risk Independent variable: genetic impulsive risk score |
.06*** | .01 | |
| 2,210 | ||||
| Model 3 | Dependent variable: self-reported sensation-seeking risk Independent variable: genetic sensation-seeking risk score |
.17*** | .02 | |
| 2,138 |
p < .05
p < .01
p < .001 (two-tailed tests).
RESULTS
In Table 3, we test whether women are more risk averse than men. We find that risk aversion scores are higher for women. The mean gender differences in self-reported general risk, impulsive risk, and sensation-seeking risk are all statistically significant. Similarly, women have significantly higher genetic predispositions for all three types of risk aversion.
Table 3.
Gender differences in risk aversion
| General risk aversion score |
Impulsive risk aversion score |
Sensation-seeking risk aversion score |
|
|---|---|---|---|
| Self-reported score | |||
| Mean difference between women and men | .50*** | .34*** | 1.00*** |
| S.E. | .04 | .08 | .09 |
| Genetic score | |||
| Mean difference between women and men | .23*** | 4.84*** | 2.75*** |
| S.E. | .03 | .06 | .07 |
| N | 2,211 | 2,211 | 2,211 |
p < .05
p < 0.01
p < .001 (two-tailed tests).
Next, we evaluate risk preference theory. Table 4 presents results for gender and general risk. A positive coefficient indicates higher levels of religiousness. There are five sets of GEE models of religiosity in Table 4. The first set of models, Model 1, includes gender. The second set, Model 2, includes self-reported general risk aversion score. Model 3 includes both gender and self-reported general risk aversion score. Model 4 includes the genetic general risk aversion score. Model 5 includes both gender and the genetic general risk aversion score. All models include the control variables.
Table 4.
Effects of gender and general risk aversion on religiosity
| Dependent variable | Independent variable | Model 1 | Model 2 | Model 3 | Model 4 | Model 5 |
|---|---|---|---|---|---|---|
| Belief in God | Gender | |||||
| Woman (ref: man) | .42** | ---- | .41** | ---- | .40** | |
| (.13) | (.14) | (.13) | ||||
| Self-reported general risk | ||||||
| Risk aversion score | ---- | .06 | .02 | ---- | ---- | |
| (.06) | (.06) | |||||
| Genetic general risk | ||||||
| Risk aversion score | ---- | ---- | ---- | .10 | .06 | |
| (.09) | (.09) | |||||
| N | 2,184 | 2,184 | 2,184 | 2,184 | 2,184 | |
| Prayer | Gender | |||||
| Woman (ref: man) | 5.80*** | ---- | 5.84*** | ---- | 5.96*** | |
| (.75) | (.78) | (.77) | ||||
| Self-reported general risk | ||||||
| Risk aversion score | ---- | .52 | −0.08 | ---- | ---- | |
| (.36) | (.37) | |||||
| Genetic general risk | ||||||
| Risk aversion score | ---- | ---- | ---- | −0.14 | −0.71 | |
| (.48) | (.48) | |||||
| N | 4,212 | 4,212 | 4,212 | 4,212 | 4,212 | |
| Importance | Gender | |||||
| Woman (ref: man) | .29*** | ---- | .30*** | ---- | .30*** | |
| (.07) | (.08) | (.07) | ||||
| Self-reported general risk | ||||||
| Risk aversion score | ---- | .01 | −0.02 | ---- | ---- | |
| (.03) | (.03) | |||||
| Genetic general risk | ||||||
| Risk aversion score | ---- | ---- | ---- | .01 | −0.02 | |
| (.04) | (.05) | |||||
| N | 4,210 | 4,210 | 4,210 | 4,210 | 4,210 | |
| Self-assessed | Gender | |||||
| religiousness | Woman (ref: man) | .25** | ---- | .24** | ---- | .25** |
| (.09) | (.09) | (.09) | ||||
| Self-reported general risk | ||||||
| Risk aversion score | ---- | .06 | .03 | ---- | ---- | |
| (.04) | (.04) | |||||
| Genetic general risk | ||||||
| Risk aversion score | ---- | ---- | ---- | .04 | .01 | |
| (.06) | (.06) | |||||
| N | 2,199 | 2,199 | 2,199 | 2,199 | 2,199 | |
| Attendance | Gender | |||||
| Woman (ref: man) | .29** | ---- | .26** | ---- | .30*** | |
| (.09) | (.09) | (.09) | ||||
| Self-reported general risk | ||||||
| Risk aversion score | ---- | .09* | .06 | ---- | ---- | |
| (.04) | (.04) | |||||
| Genetic general risk | ||||||
| Risk aversion score | ---- | ---- | ---- | −0.04 | −0.07 | |
| (.06) | (.06) | |||||
| N | 4,217 | 4,217 | 4,217 | 4,217 | 4,217 | |
Notes: All models in this table control for age, race/ethnicity, education, current employment status, income, marital status, whether was raised in a religion, whether has a child, and religious affiliation.
Standard errors in parentheses.
p < .05
p < .01
p < .001 (two-tailed tests).
Model 1 shows that women are more religious than men on all five measures of religiosity. Model 2 suggests that self-reported general risk is not associated with religiousness except for church attendance. Individuals with higher general risk aversion scores are more likely to go to church. In Model 3, the coefficient for women remains statistically significant for every measure of religiosity, and remains virtually unchanged. On the other hand, the coefficients for self-reported general risk are not statistically significant for any regression. This suggests that general risk does not explain the gender gap. Similarly, Model 4 and Model 5 show that genetic general risk is not associated with any of the religiosity measures and does not explain the gender gap either.
Table 5 reports results based on impulsive risk. Models 1 through 5 in Table 5 are similar to those in Table 4. Model 2 show that impulsive risk aversion is positively associated with religiousness. Model 3 shows that the inclusion of impulsive risk explains almost none of the sex differences in religiosity. The genetic risk aversion scores are associated with religiosity in Model 4. But in Model 5 when gender is entered, the genetic impulsive risk coefficient becomes insignificant in general. The gender coefficient becomes insignificant for belief in God, importance of religion, and self-assessed religiousness, but this is primarily caused by collinearity (results of collinearity tests are available upon request). For frequency of prayer and church attendance, the coefficient for gender remains statistically significant when we control for genetic impulsive risk. Therefore, Table 5 suggests that the gender gap in religiousness is not caused by genetic impulsive risk. We also conduct a robustness analysis in which we use one of the three impulsive risk items at a time to test the effect of the item on religiosity. Results are similar.
Table 5.
Effects of gender and impulsive risk aversion on religiosity
| Dependent variable | Independent variable | Model 1 | Model 2 | Model 3 | Model 4 | Model 5 |
|---|---|---|---|---|---|---|
| Belief in God | Gender | |||||
| Woman (ref: man) | .42** | ---- | .40** | ---- | .13 | |
| (.13) | (.13) | (.29) | ||||
| Self-reported impulsive risk | ||||||
| Risk aversion score | ---- | .06 | .05 | ---- | ---- | |
| (.03) | (.04) | |||||
| Genetic impulsive risk | ||||||
| Risk aversion score | ---- | ---- | ---- | .08** | .06 | |
| (.02) | (.05) | |||||
| N | 2,183 | 2,183 | 2,183 | 2,183 | 2,183 | |
| Prayer | Gender | |||||
| Woman (ref: man) | 5.82*** | ---- | 5.63*** | ---- | 8.31*** | |
| (.75) | (.75) | (1.54) | ||||
| Self-reported impulsive risk | ||||||
| Risk aversion score | ---- | .78*** | .66*** | ---- | ---- | |
| (.20) | (.20) | |||||
| Genetic impulsive risk | ||||||
| Risk aversion score | ---- | ---- | ---- | .80*** | −0.52 | |
| (.13) | (.27) | |||||
| N | 4,211 | 4,211 | 4,211 | 4,211 | 4,211 | |
| Importance | Gender | |||||
| Woman (ref: man) | .29*** | ---- | .28*** | ---- | .21 | |
| (.07) | (.07) | (.14) | ||||
| Self-reported impulsive risk | ||||||
| Risk aversion score | ---- | .04* | .04 | ---- | ---- | |
| (.02) | (.02) | |||||
| Genetic impulsive risk | ||||||
| Risk aversion score | ---- | ---- | ---- | .05*** | .02 | |
| (.01) | (.03) | |||||
| N | 4,209 | 4,209 | 4,209 | 4,209 | 4,209 | |
| Self-assessed | Gender | |||||
| religiousness | Woman (ref: man) | .25** | ---- | .23** | ---- | .19 |
| (.09) | (.09) | (.17) | ||||
| Self-reported impulsive risk | ||||||
| Risk aversion score | ---- | .08*** | .07** | ---- | ---- | |
| (.02) | (.02) | |||||
| Genetic impulsive risk | ||||||
| Risk aversion score | ---- | ---- | ---- | .04** | .01 | |
| (.02) | (.03) | |||||
| N | 2,198 | 2,198 | 2,198 | 2,198 | 2,198 | |
| Attendance | Gender | |||||
| Woman (ref: man) | .29** | ---- | .27** | ---- | .32 | |
| (.09) | (.09) | (.18) | ||||
| Self-reported impulsive risk | ||||||
| Risk aversion score | ---- | .07** | .06** | ---- | ---- | |
| (.02) | (.02) | |||||
| Genetic impulsive risk | ||||||
| Risk aversion score | ---- | ---- | ---- | .04** | −.01 | |
| (.02) | (.03) | |||||
| N | 4,216 | 4,216 | 4,216 | 4,216 | 4,216 | |
Notes: All models in this table control for age, race/ethnicity, education, current employment status, income, marital status, whether was raised in a religion, whether has a child, and religious affiliation.
Standard errors in parentheses.
p < .05
p < .01
p < .001 (two-tailed tests).
Table 6 presents the association of gender and sensation-seeking risk with religiosity. Tables 6 and 4 share a similar structure and models. Model 2 shows that self-reported sensation-seeking risk is negatively associated with religiosity. In Model 3, after controlling for self-reported sensation-seeking risk aversion, the coefficients for the gender differences in self-assessed religiousness and church attendance become statistically insignificant. Gender differences in belief in God, prayer, and importance of religious faith remain statistically significant. However, in this case, causal direction is difficult to determine because religious teachings typically condemn many of the behaviors on the sensation-seeking risk scale (i.e., wild parties, illegal drug use, and pre-marital sex with multiple partners). Model 4 shows that genetic sensation-seeking risk aversion is positively associated with religiousness, but Model 5 shows that genetic sensation-seeking risk aversion does not explain the gender gap in religiosity. In sum, we find little evidence to support hypotheses 1, 2 or 3. As a robustness check, we try different statistical significance levels to calculate the genetic risk aversion scores. Results are similar.
Table 6.
Effects of gender and sensation-seeking risk aversion on religiosity
| Dependent variable | Independent variable | Model 1 | Model 2 | Model 3 | Model 4 | Model 5 |
|---|---|---|---|---|---|---|
| Belief in God | Gender | |||||
| Woman (ref: man) | .40** | ---- | .29* | ---- | .34 | |
| (.14) | (.14) | (.18) | ||||
| Self-reported sensation- seeking risk |
||||||
| Risk aversion score | ---- | .12*** | .10*** | ---- | ---- | |
| (.03) | (.03) | |||||
| Genetic sensation-seeking risk |
||||||
| Risk aversion score | ---- | ---- | ---- | .07* | .02 | |
| (.03) | (.04) | |||||
| N | 2,155 | 2,155 | 2,155 | 2,155 | 2,155 | |
| Prayer | Gender | |||||
| Woman (ref: man) | 5.68*** | ---- | 4.29*** | ---- | 5.10*** | |
| (.77) | (.78) | (1.01) | ||||
| Self-reported sensation- seeking risk |
||||||
| Risk aversion score | ---- | 1.71*** | 1.48*** | ---- | ---- | |
| (.18) | (.18) | |||||
| Genetic sensation-seeking risk |
||||||
| Risk aversion score | ---- | ---- | ---- | .95*** | .21 | |
| (.17) | (.23) | |||||
| N | 4,076 | 4,076 | 4,076 | 4,076 | 4,076 | |
| Importance | Gender | |||||
| Woman (ref: man) | .27*** | ---- | .17* | ---- | .23* | |
| (.07) | (.08) | (.09) | ||||
| Self-reported sensation- seeking risk |
||||||
| Risk aversion score | ---- | .13*** | .12*** | ---- | ---- | |
| (.02) | (.02) | |||||
| Genetic sensation-seeking risk |
||||||
| Risk aversion score | ---- | ---- | ---- | .05** | .02 | |
| (.02) | (.02) | |||||
| N | 4,076 | 4,076 | 4,076 | 4,076 | 4,076 | |
| Self-assessed | Gender | |||||
| religiousness | Woman (ref: man) | .25** | ---- | .10 | ---- | .20 |
| (.09) | (.09) | (.11) | ||||
| Self-reported sensation- seeking risk |
||||||
| Risk aversion score | ---- | .17*** | .17*** | ---- | ---- | |
| (.02) | (.02) | |||||
| Genetic sensation-seeking risk |
||||||
| Risk aversion score | ---- | ---- | ---- | .05* | .02 | |
| (.02) | (.03) | |||||
| N | 2,129 | 2,129 | 2,129 | 2,129 | 2,129 | |
| Attendance | Gender | |||||
| Woman (ref: man) | .26** | ---- | .05 | ---- | .25* | |
| (.09) | (.09) | (.11) | ||||
| Self-reported sensation- seeking risk |
||||||
| Risk aversion score | ---- | .23*** | .22*** | ---- | ---- | |
| (.02) | (.02) | |||||
| Genetic sensation-seeking risk |
||||||
| Risk aversion score | ---- | ---- | ---- | .04* | .01 | |
| (.02) | (.03) | |||||
| N | 4,081 | 4,081 | 4,081 | 4,081 | 4,081 | |
Notes: All models in this table control for age, race/ethnicity, education, current employment status, income, marital status, whether was raised in a religion, whether has a child, and religious affiliation.
Standard errors in parentheses.
p < .05
p < .01
p < .001 (two-tailed tests).
DISCUSSION AND CONCLUSION
To answer why women are more religious than men, researchers have offered different explanations. Risk preference theory posits that because women are more risk averse than men and religiousness can be viewed as a form of risk aversion, women are more religious. This has led to a lasting debate over the past two decades. However, previous research almost exclusively tests the theory indirectly, resulting in a limited understanding of the role of risk preference. Our study makes the following important contributions. We treat both risk preference and religiosity as multidimensional concepts, and directly test the relationships among them and gender. We take advantage of genetic data to directly test the biological explanation for gender differences in religiosity. Our results of genetic analysis also help address the causal order problem. Results suggest that women are more risk averse than men. However, we find little evidence to support risk preference theory among Christians and non-religious individuals in the United States.
If risk aversion promotes religiosity through a theological mechanism (e.g., fear of hell), we would expect (1) all three types of risk aversion to increase all five measures of religiosity, (2) controlling for risk aversion to reduce the gender gap in all five measures of religiosity, and (3) the reduction in the gender gap to be comparable for all measures of religiosity. The pattern should be consistent because there is little reason to suspect any form of religiosity is less visible to God. However, results do not support these three predictions. These findings are consistent with Roth and Kroll’s (2007) and Freese and Montgomery’s (2007) findings that the effect of risk preferences is not caused by fear of eternal punishment.
If risk aversion promotes religiosity though a social mechanism (e.g., fear of seeming immoral or fear of raising immoral children), then we would expect (1) all three types of risk aversion to increase the more public measures of religiosity, (2) the gender gap in religiosity to apply primarily or exclusively to the more public measures of religiosity, and (3) controlling for risk aversion to consistently reduce the gender gap in the more public measures of religiosity, but less so for the more private measures of religiosity (which on average are less easily observable by others). Our findings do not support these predictions.
If religious teachings influence risk aversion, we would expect the association between religiosity and risk aversion to vary systematically based on religious teaching about that type of risk. Our findings support this idea. Our sample consists only of Christians and the non-religious. This makes the theological content of the religion easier to discuss than if all religions in the data were included in the analytical sample. Christianity has no clear teaching about general risk. Thus, we would expect no relationship between religiosity and general risk. Our findings support this prediction. General risk aversion does not predict any form of religiosity and the gender gap exists for all forms of religiosity after general risk aversion is entered in the model.
Impulsive risk involves individuals’ concerns about both the consequence of their actions and long-term planning. Religious groups generally encourage adherents to consider the consequences of their actions and thus discourage impulsive risk. Moreover, religious groups typically encourage both men and women to be concerned about consequences. Thus, if religion influences impulsive risk, controlling for impulsive risk is unlikely to reduce the gender gap. We find that self-reported impulsive risk aversion is often associated with lower religiosity but does not remove the gender gap in religiosity. This fits what we would expect if religion shaped impulsive risk, rather than vice versa.
Sensation-seeking risk involves attitudes that Christianity and many other religions actively condemn. We find that self-reported sensation-seeking risk aversion is positively related to religiosity. It reduces the gender gap in self-assessed religiousness and church attendance. However, self-reported sensation-seeking risk is the type of risk most susceptible to reverse causation because of its strong moral/ethical content. It is plausible that highly religious individuals internalize church teachings against illegal drug use and having multiple pre-marital sex partners. Moreover, some Christian groups may be more concerned about maintaining the sexual purity of women than men (creating the possibility that controlling for sensation-seeking risk artificially reduces the gender gap in religiosity). Although sensation-seeking risk aversion is highly correlated with religiosity, it does not explain the gender gap in belief in God, prayer, or importance of religion. Future research might further investigate the reasons for this finding.
We find that no type of genetic risk aversion is positively associated with any form of religiosity after controlling for gender, and no form of genetic risk aversion removes the gender gap in religiosity by pulling the coefficient towards zero (as opposed to inflating the standard error). Because religious teachings can influence behavior but not genetic predispositions towards those behaviors, the pattern of coefficients for genetic risk aversion suggests that religiosity reduces particular types of risky behavior, not that risk aversion increases religiosity. Although self-reported sensation-seeking risk is associated with two measures of religiosity, these results do not hold for genetic sensation-seeking risk. This makes sense if religiosity influences sensation-seeking risk (religiosity can only influence behavior and attitudes, not genetics). However, this makes little sense if risk influences religiosity. Our findings suggest that the genetic results do not support risk preference theory.
Previous studies that have found support for risk preference theory have used cross-sectional samples of adolescents (Miller and Hoffman 1995, Hoffman 2019). The differences between these studies and our study (using a longitudinal sample of adults) may be related to sample and reverse causation. Adolescents live in a more structured environment than adults and have fewer choices they can make and a narrower set of risks they can take. Adolescents typically live with their parents, are financially supported by their parents, and are enrolled in school. Thus, the meaning of taking risks may differ between adolescents and adults. Moreover, longitudinal research suggests that religious teenagers are less likely to participate in sensation seeking activities, and that participation in these activities has a weaker or non-significant effect on later religiosity (Benda 1997, Desmond, Kikuchi, and Budd 2010, Mason and Windle 2002b, Pirutinsky 2014). The results in Hoffman (2019) can also be explained by this theory. Hoffman measures delinquency differently among the data from the Monitoring the Future (MTF), the National Survey of Drug Use and Health (NSDUH), and the National Survey of Youth and Religion (NSYR). In the MTF and NSDUH data, the author uses more extreme forms of delinquency (arson, gang fights, and stealing a car), while in the NSYR data he uses more common and less extreme forms of delinquency (being in a fight in the last three years, drunk in the past year, and used marijuana). Past research suggests the relationship between religiosity and getting drunk or using drug is stronger than that between religion and more extreme types of crime (Baier and Wright 2001, Johnson and Jang 2011). In the NSYR data, the gender gap in religiosity becomes insignificant after delinquent behavior is controlled (in this case mostly alcohol and drug activity). However, in the MTF and NSDUH data, the gender gap in religiosity remains after delinquent behavior is controlled (in this case arson, gang fights, and stealing a car). Moreover, the fact that controlling for behavior removes the gender gap in one single latent measure of religiosity in the NSYR data is likely due to reverse causation.
In addition, longitudinal analysis also helps us evaluate risk preference theory. Longitudinal research that simultaneously measures the impact of religiosity on sensation-seeking risk and the impact of sensation-seeking risk on religiosity does not seem to support risk preference theory. Earlier religiosity reduces the quantity and frequency of alcohol use (Mason and Windle 2002a, Kendler, Gardner, and Prescott 1997, Benda 1997, Hoffmann 2014) and drug use (Desmond, Kikuchi, and Budd 2010), and it delays pre-marital sex (Hardy and Raffaelli 2003). Conversely, alcohol use, drug use, criminal activity, and pre-marital sexual activity have either no effect or a weak effect on later religiosity (Hardy and Raffaelli 2003, Pirutinsky 2014, Kendler, Gardner, and Prescott 1997, Benda 1997).
Our study has several limitations. First, risk taking is a complex trait, suggesting that a large number of social and biological factors work together to influence risk aversion. When genetic predispositions towards risk are better understood and more data are available, we might develop a more precise measure of genetic risk aversion that takes into account genome-wide genetic markers, gene expression, and epigenetic markers. Second, the majority of our sample is Christians in the United States. We caution against generalizing our findings to other religion groups. Third, due to social desirability, respondents may feel pressure to report higher levels of religiosity than they have. If risk aversion is strongly related to over-reporting of religiosity, our estimates may be biased. Fourth, our sample consists of young adults. Research finds that religious participation but not religious importance suffers declines in young adulthood (Uecker, Regnerus, and Vaaler 2007). Our results might not generalize to older populations.
We do not consider the current study an end to the debate. Future research might continue to test the theory with other measures of risk preference and in other settings. Another direction might expand to the gender gap in more specific social locations that are related to religiosity, such as race/ethnicity (e.g., Taylor et al. 1996), generation (e.g., Bengtson et al. 2015), marriage, and employment (e.g., Becker and Hofmeister 2001). Further studies of gender, race, and religiosity might in turn help us understand the gender gap in religiosity.
Supplementary Material
Acknowledgements:
This research uses data from Add Health, a program project directed by Kathleen Mullan Harris and designed by J. Richard Udry, Peter S. Bearman, and Kathleen Mullan Harris at the University of North Carolina at Chapel Hill, and funded by grant P01-HD31921 from the Eunice Kennedy Shriver National Institute of Child Health and Human Development, with cooperative funding from 23 other federal agencies and foundations. Information on how to obtain the Add Health data files is available on the Add Health website (http://www.cpc.unc.edu/addhealth). No direct support was received from grant P01-HD31921 for this analysis. An NSF grant to Guang Guo supported the genotyping of the aggression-related genes in the genetic sample of Add Health (NSF’s Human and Social Dynamics program BCS-0826913). A Challenge Grant RC1 DA029425-01 to Guang Guo also provided support for the study. The authors thank Ted Mouw, Francois Nielsen, Mike Shanahan, Yang Yang, and the anonymous reviewers for their helpful comments on earlier drafts. We gratefully acknowledge support to Yi Li from the University of Macau (SRG2017-00108-FSS).
Footnotes
It would be helpful to review commonly used terminology. Genes are small sections of the chromosome that code for proteins. The human genome is composed of 22 pairs of autosomal chromosomes and one pair of sex chromosomes. The DNA sequence is composed of a chain of the nucleotide bases adenine (A), cytosine (C), guanine (G), and thymine (T), with A always pairing with T and C always pairing with G. An allele is a genetic variant form in a specific genetic locus on a chromosome. There are two alleles at each genetic locus, one from each parent (e.g., an individual may have AT and CG). Each pair of alleles represents the genotype of a specific gene. When more than 1% of a population does not carry the same nucleotide at a specific position in the DNA sequence, this variation can be classified as a SNP.
Contributor Information
YI LI, Department of Sociology, University of Macau.
ROBERT WOODBERRY, Institute for the Study of Religion, Baylor University.
HEXUAN LIU, School of Criminal Justice, University of Cincinnati.
GUANG GUO, Department of Sociology, University of North Carolina, Chapel Hill.
References
- Baier Colin J, and Wright Bradley RE. 2001. "“If you love me, keep my commandments”: A meta-analysis of the effect of religion on crime." Journal of Research in Crime and Delinquency 38 (1):3–21. [Google Scholar]
- Baker Joseph O, and Whitehead Andrew L. 2016. "Gendering (Non) Religion: Politics, Education, and Gender Gaps in Secularity in the United States." Social Forces 94 (4):1623–45. [Google Scholar]
- Becker Penny Edgell, and Hofmeister Heather. 2001. "Work, family, and religious involvement for men and women." Journal for the Scientific Study of Religion 40 (4):707–22. [Google Scholar]
- Bell Nicole S., Schoenrock Carol J., and O'Neal Keri K.. 2000. "Self-Monitoring and the Propensity for Risk." European Journal of Personality 14:107–19. [Google Scholar]
- Benda Brent B. 1997. "An examination of a reciprocal relationship between religiosity and different forms of delinquency within a theoretical model.” Journal of Research in Crime and Delinquency 34 (2):163–86. [Google Scholar]
- Bengtson Vern L, Silverstein Merril, Putney Norella M, and Harris Susan C. 2015. "Does religiousness increase with age? Age changes and generational differences over 35 years." Journal for the Scientific Study of Religion 54 (2):363–79. [Google Scholar]
- Blaszczyk Janusz W., Tajchert Katarzyna, Lapo wona, and Sadowski Bogdan. 2000. "Acoustic startle and open-field behavior in mice bred for magnitude of swim analgesia." Physiology & Behavior 70:471–76. [DOI] [PubMed] [Google Scholar]
- Bromiley Philip, and Curley Shawn P.. 1992. "Individual Differences in Risk Taking" In Risk-taking Behavior, edited by Yates J. Frank. New York: John Wiley & Sons. [Google Scholar]
- CALDÚ Xavier, and Dreher Jean-Claude. 2007. "Hormonal and Genetic Influences on Processing Reward and Social Information." Annals of the New York Academy of Sciences 1118:43–73. [DOI] [PubMed] [Google Scholar]
- Caspi Avshalom, Begg Dot, Dickson Nigel, Harrington HonaLee, Langley John, Moffitt Terrie E., and Silva Phil A.. 1997. "Personality differences predict health-risk behaviors in young adulthood: Evidence from a longitudinal study." Journal of Personality and Social Psychology 73 (5):1052–63. [DOI] [PubMed] [Google Scholar]
- Cesarini David, Dawes Christopher T., Johannesson Magnus, Lichtenstein Paul, and Wallace Bjoern. 2009. "Genetic variation in preferences for giving and risk-taking." Quarterly Journal of Economics 124 (2):809–42. [Google Scholar]
- Collett Jessica L., and Lizardo Omar. 2009. "A Power-Control Theory of Gender and Religiosity." Journal for the Scientific of Religion 48 (2):213–31. [Google Scholar]
- Consortium, Mouse Genome Sequencing. 2002. "Initial sequencing and comparative analysis of the mouse genome." Nature 420:520–62. [DOI] [PubMed] [Google Scholar]
- Consortium, The International Schizophrenia. 2009. "Common polygenic variation contributes to risk of schizophrenia and bipolar disorder." Nature 460 (6):748–52. [DOI] [PMC free article] [PubMed] [Google Scholar]
- Cornwall Marie, Albrecht Stan L., Cunningham Perry H., and Pitcher Brian L.. 1986. "The Dimensions of Religiosity: A Conceptual Model with an Empirical Test." Review of Religion Research 27 (3):226–44. [Google Scholar]
- Desmond Scott A, Kikuchi George, and Budd Kristen. 2010. "Does change in teenage religiosity predict change in Marijuana use over time?" Interdisciplinary Journal of Research on Religion 6. [Google Scholar]
- Edgell Penny, Frost Jacqui, and Stewart Evan. 2017. "From Existential to Social Understandings of Risk: Examining Gender Differences in Nonreligion." Social Currents:2329496516686619. [Google Scholar]
- Ellis Lee, Hoskin Anthony W, and Ratnasingam Malini. 2016. "Testosterone, Risk Taking, and Religiosity: Evidence from Two Cultures." Journal for the Scientific Study of Religion 55 (1):153–73. [Google Scholar]
- Feltey Kathryn M., and Poloma Margaret M.. 1991. "From Sex Differences to Gender Role Beliefs: Exploring Effects on Six Dimensions of Religiosity." Sex Roles 25:181–93. [Google Scholar]
- Forthun Larry F., Bell Nancy J., Peek Charles W., and Sun Sheh-Wei. 1999. "Religiosity, Sensation Seeking, and Alcohol/Drug Use in Denominational and Gender Contexts." Journal of Drug Issues 29:75–90. [Google Scholar]
- Freese Jeremy. 2004. "Risk Preferences and Gender Differences in Religiousness: Evidence from the World Values Survey." Review of Religion Research 46 (1):88–91. [Google Scholar]
- Freese Jeremy, and Montgomery James. 2007. "The Devil Made Her Do It: Evaluating Risk Preference as an Explanation of Sex Differences in Religiousness" In Advances in Group Processes: The Social Psychology of Gender, edited by Correll Shelley J., 187–230. Oxford: Elsevier. [Google Scholar]
- Geen RG 1997. "Psychophysiological approaches to personality" In Handbook of Personality Psychology, edited by Hogan J. Johnson and Briggs S. London: Academics Press. [Google Scholar]
- Glazier Anne M., Nadeau Joseph H., and Aitman Timothy J.. 2002. "Finding Genes That Underlie Complex Traits." Science 298 (5602):2345–49. [DOI] [PubMed] [Google Scholar]
- Gottfredson Micheal, and Hirschi Travis. 1990. A General Theory of Crime. Palo Alto, CA: Stanford University Press. [Google Scholar]
- Hackett Conrad, Murphy Caryle, and McClendon David. 2016. "The gender gap in religion around the world." Washington, DC: Pew Research Center. [Google Scholar]
- Hagan John, Simpson John, and Gillis AR. 1988. "Feminist Scholarship, Relational and Instrumental Control, and a Power-control Theory of Gender and Delinquency." British Journal of Sociology 39:301–36. [PubMed] [Google Scholar]
- Hardy Sam A, and Raffaelli Marcela. 2003. "Adolescent religiosity and sexuality: An investigation of reciprocal influences." Journal of Adolescence 26 (6):731–39. [DOI] [PubMed] [Google Scholar]
- Hariri Ahmad R., Mattay Venkata S., Tessitore Alessandro, Kolachana Bhaskar, Fera Francesco, Goldman David, Egan Michael F., and Weinberger Daniel R.. 2002. "Serotonin Transporter Genetic Variation and the Response of the Human Amygdala." Science 297:400–03. [DOI] [PubMed] [Google Scholar]
- Harris KM, Halpern CT, Whitsel E, Hussey J, Tabor J, Entzel P, and Udry JR. 2009. "The National Longitudinal Study of Adolescent Health: Research Design." http://www.cpc.unc.edu/projects/addhealth/design.
- Hartman Harriet. 2016. "Gender Differences in American Jewish Identity: Testing the Power Control Theory Explanation." Review of Religious Research:1–25. [Google Scholar]
- Hartman Harriet, and Hartman Moshe. 2009. Gender and American Jews: Patterns in work, education, and family in contemporary life: University Press of New England. [Google Scholar]
- Hastings Orestes P, and Lindsay D Michael. 2013. "Rethinking religious gender differences: The case of elite women." Sociology of Religion:srt048. [Google Scholar]
- Hoffmann John P. 2014. "Religiousness, social networks, moral schemas, and marijuana use: A dynamic dual-process model of culture and behavior." Social Forces 93 (1):181–208. [Google Scholar]
- Hoffmann John P. 2019. "Risk preference theory and gender differences in religiousness: A replication and extension." Journal for the Scientific Study of Religion 58 (1):210–30. [Google Scholar]
- Hoffmann John P. 2009. "Gender, Risk, and Religiousness: Can Power Control Provide the Theory?" Journal for the Scientific of Religion 48 (2):232–40. [Google Scholar]
- Johnson Byron R, and Jang Sung Joon. 2011. "Crime and religion: Assessing the role of the faith factor." Contemporary issues in criminological theory and research: The role of social institutions:117–49. [Google Scholar]
- Kendler Kenneth S, Gardner Charles O, and Prescott Carol A. 1997. "Religion, psychopathology, and substance use and abuse: A multimeasure, genetic-epidemiologic study." American Journal of Psychiatry 154 (3):322–29. [DOI] [PubMed] [Google Scholar]
- Kreek Mary Jeanne, Nielsen David A., Butelman Eduardo R., and LaForge K. Steven. 2005. "Genetic Influences on Impulsivity, Risk Taking, Stress Responsivity and Vulnerability to Drug Abuse an Addiction." Nature Neuroscience 8 (11):1450–57. [DOI] [PubMed] [Google Scholar]
- Kuhnen Camelia M., and Chiao Joan Y.. 2009. "Genetic Determinants of Financial Risk Taking." Plos ONE 4 (2):e4362. [DOI] [PMC free article] [PubMed] [Google Scholar]
- Liang Kung-Yee, and Zeger Scott L.. 1986. "Longitudinal data analysis using generalized linear models." Biometrika 73 (1):13–22. [Google Scholar]
- Lin Seth A. Eisen Nong, Lyons Michael J., Scherrer Jeffrey F., Griffith Kristin, True William R., Goldberg Jack, and Tsuang Ming T.. 1998. "Familial influences on gambling behavior: an analysis of 3359 twin pairs." Addiction 93 (9):1375–84. [DOI] [PubMed] [Google Scholar]
- Lusher JM, Chandler C, and Ball D. 2001. "Dopamine D4 receptor gene (DRD4) is associated with Novelty Seeking (NS) and substance abuse." Molecular Psychiatry 6 (5):497–99. [DOI] [PubMed] [Google Scholar]
- Maselko Joanna, and Kubzansky Laura D. 2006. "Gender differences in religious practices, spiritual experiences and health: Results from the US General Social Survey." Social science & medicine 62 (11):2848–60. [DOI] [PubMed] [Google Scholar]
- Mason W Alex, and Windle Michael. 2002a. "A longitudinal study of the effects of religiosity on adolescent alcohol use and alcohol-related problems." Journal of Adolescent Research 17 (4):346–63. [Google Scholar]
- Mason W Alex, and Windle Michael. 2002b. "Reciprocal relations between adolescent substance use and delinquency: A longitudinal latent variable analysis." Journal of Abnormal Psychology 111 (1):63. [DOI] [PubMed] [Google Scholar]
- Maxson SC, and Canastar A. 2003. "Conceptual and methodological issues in the genetics of mouse agonistic behavior." Hormones and Behavior 44:258–62. [DOI] [PubMed] [Google Scholar]
- Maxson Stephen C. 2009. "The Genetics of Offensive Aggression in Mice" In Handbook of Behavior Genetics, edited by Kim Yong-Kyu. New York ;London: Springer. [Google Scholar]
- Meertens Ree M., and Lion Rene. 2008. "Measuring an Individual's Tendency to Take Risks: The Risk Propensity Scale." Journal of Applied Social Psychology 38 (6):1506–20. [Google Scholar]
- Miller Alan S., and Hoffmann John P.. 1995. "Risk and Religion: An Explanation of Gender Differences in Religiosity." Journal for the Scientific of Religion 34 (1):63–75. [Google Scholar]
- Miller Alan S., and Stark Rodney. 2002. "Gender and Religiousness: Can Socialization Explanations Be Saved?" American Journal of Sociology 107 (6):1399–423. [Google Scholar]
- Moeller F Gerard, Barratt Ernest S, Dougherty Donald M, Schmitz Joy M, and Swann Alan C. 2001. "Psychiatric aspects of impulsivity." American Journal of Psychiatry 158 (11):1783–93. [DOI] [PubMed] [Google Scholar]
- Nelson Randy J., and Trainor Brian C.. 2007. "Neural mechanisms of aggression." Nature Reviews Neuroscience 8:536–46. [DOI] [PubMed] [Google Scholar]
- Pirutinsky Steven. 2014. "Does religiousness increase self-control and reduce criminal behavior? A longitudinal analysis of adolescent offenders." Criminal Justice and Behavior 41 (11):1290–307. [Google Scholar]
- Primus Renee J., Thurkauf Andrew, Xu Jing, Yevich Eileen, Mcinerney Sean, Shaw Kenneth, Tallman John F., and Gallager Dorothy W.. 1997. "Localization and Characterization of Dopamine D4 Binding Sites in Rat and Human Brain by Use of the Novel, D4 Receptor-Selective Ligand [3H]NGD 94-1." Journal of Pharmacology and Experimental Therapeutics 282 (2):1020–27. [PubMed] [Google Scholar]
- Roth Louise Marie, and Kroll Jeffrey C.. 2007. "Risky Business: Assessing Risk Preference Explanations for Gender Differences in Religiosity." American Sociological Review 72 (2):205–20. [Google Scholar]
- Roth Marcus, Schumacher Jörg, and Brähler Elmar. 2005. "Sensation Seeking in the Community: Sex, Age, and Sociodemographic Comparisons on a Representative German Population Sample." Personality and Individual Differences 39:1261–71. [Google Scholar]
- Rubin DB 1987. Multiple Imputation for Nonresponse in Surveys. New York: John Wiley and Sons. [Google Scholar]
- Schinka JA, Letsch EA, and Crawford FC. 2002. "DRD4 and novelty seeking: Results of meta-analyses." American Journal of Medical Genetics 114 (6):643–48. [DOI] [PubMed] [Google Scholar]
- Schnabel Landon. 2016. "The gender pray gap: Wage labor and the religiosity of high-earning women and men." Gender & Society 30 (4):643–69. [Google Scholar]
- Schnabel Landon. 2018. "More religious, less dogmatic: Toward a general framework for gender differences in religion." Social science research 75:58–72. [DOI] [PubMed] [Google Scholar]
- Stark Rodney. 2002. "Physiology and Faith: Addressing the "Universal" Gender Difference in Religious." Journal for the Scientific of Religion 41 (3):495–507. [Google Scholar]
- Sullins D Paul. 2006. "Deconstructing Universality, Constructing Complexity." American Journal of Sociology 112 (3):838–80. [Google Scholar]
- Taylor Robert Joseph, Linda M Chatters Rukmalie Jayakody, and Levin Jeffrey S. 1996. "Black and White differences in religious participation: A multisample comparison." Journal for the Scientific Study of Religion:403–10. [Google Scholar]
- Trzebiatowska Marta, and Bruce Steve. 2012. Why are women more religious than men?: Oxford University Press. [Google Scholar]
- Uecker Jeremy E, Regnerus Mark D, and Vaaler Margaret L. 2007. "Losing my religion: The social sources of religious decline in early adulthood." Social Forces 85 (4):1667–92. [Google Scholar]
- Vaus David de, and McAllister Ian. 1987. "Gender Differences in Religion: A Test of the Structural Location Theory." American Sociological Review 52:472–81. [Google Scholar]
- Walter Tony, and Davie Grace. 1998. "The Religion of Women in the Modern West." British Journal of Sociology 49 (4):640–60. [Google Scholar]
- Zuckerman Marvin. 1979. Sensation seeking: Beyond the optimal level of arousal. Hillsdale, NJ: Lawrence Erlbaum. [Google Scholar]
- Zuckerman Marvin, Ball Samuel, and Black James. 1990. "Influences of Sensation Seeking, Gender, Risk Appraisal, and Situational Motivation on Smoking." Addictive Behavior 15:209–20. [DOI] [PubMed] [Google Scholar]
- Zuckerman Marvin, and Kuhlman DM. 2000. "Personality and Risk-taking: Common Biosocial Factors." Journal of Personality 68:999–1029. [DOI] [PubMed] [Google Scholar]
Associated Data
This section collects any data citations, data availability statements, or supplementary materials included in this article.