

Abstract
Previous studies on Abusive Head Trauma (AHT) suggest incidence may vary by geographic location and there is limited information regarding population-based risk factors on this form of child maltreatment. This study provides new knowledge regarding these two aspects using the population of the US state of Washington born between 1999 and 2013. We used a linked administrative dataset comprised of birth, hospital discharge, child protective services (CPS) and death records to identify the scale and risk factors for AHT for the state population using quantitative survival methods. We identified AHT using diagnostic codes in hospital discharge records defined by the US Centers for Disease Control. A total of 354 AHT hospitalisations were identified and the incidence for the state was 22.8 per 100 000 children under the age of one. Over 11 per cent of these children died. Risk factors included a teenaged mother at the time of birth, births paid for using public insurance, child’s low birth weight, and maternal Native American race. The strongest risk factor was a prior CPS allegation, a similar finding to a California study on injury mortality. The practice and policy implications of these findings are discussed.
Keywords: abusive head trauma, linked administrative data, prevalence, risk factors
Introduction
Abusive head trauma (AHT) is a severe form of child maltreatment that often has serious or even fatal medical consequences such as neurological, cognitive and developmental impairments (Barlow et al., 2005; Duhaime et al., 1996; Parks et al., 2012). AHT was estimated to cost over $69 million annually in the USA between 2006 and 2011 (Peterson et al., 2015). AHT typically occurs around three months of age (Parks et al., 2012). Two studies in Japan, however, found two peaks of incidence at two and eight months (Fujiwara et al., 2008; Yamaoka et al., 2020).
To improve surveillance of AHT, the Centers for Disease Control (CDC) convened a panel of experts to develop a uniform definition using the International Classification of Diseases (ICD) diagnostic codes (Parks et al., 2012). In the USA, ICD codes are required for reimbursement by health insurers, including Medicare and Medicaid, resulting in their omnipresence in hospital records (Schnitzer et al., 2011). The ICD-9 codes used to define AHT have high sensitivity and specificity (91.5% and 96.2%, respectively), suggesting validity to identify cases of AHT, i.e. ‘The ICD-9 codes used to define AHT have high sensitivity and specificity... suggesting validity to identify cases of AHT’] (Berger et al., 2015). Shanahan et al. (2013) used this definition to calculate the incidence of AHT nationally, across the major geographical regions in the USA, and within the state of North Carolina. The authors identified an incidence of 38.8 per 100 000 children under the age of one nationally. At the regional level, they found a range of incidence between a low of 29.1 (Northeast) and a high of 48.1 (Midwest) per 100 000 children under the age of one. For the state of North Carolina, the calculated incidence was 29.7 per 100 000 under the age of one. A study in Alaska also applied the CDC definition of AHT, finding the incidence for children under the age of one to be 56.0 per 100 000 children and 34.4 per 100 000 children under the age of two (Parrish et al., 2013).
Other US-based studies have calculated population-based incidence rates. A North Carolina study identified the incidence of inflicted traumatic brain injury for children under the age of two to be 17.0 per 100 000 (Keenan et al., 2003). A West Virginia study that followed the same coding criteria as the North Carolina study found an incidence of 36.6 per 100 000 for children under age one and 21.9 per 100 000 for children under age two (Emrick et al., 2019). Ellingson et al. (2008) estimated national incidence rates of inflicted traumatic brain injury using a sample of US hospitalisations. They found rates of 27.5 per 100 000 children under the age of one for the years 1997 and 2000 and a rate of 32.2 per 100 000 in the year 2003.
In addition to advances in measuring AHT, a Pennsylvania study that used child protective services (CPS) records to ascertain cases of AHT examined sociodemographic characteristics on birth records to identify risk factors for AHT (Kesler et al., 2008). Identified risk factors included child male sex, young parental age, parental race, late prenatal care start, and child low birth weight. Other research indicates that a prior CPS report is an independent risk factor for general injury mortality before the age of five in a population-based study in California (Putnam-Hornstein, 2011). Even when the study adjusted for sociodemographic variables, the prior CPS report was the strongest predictor for injury mortality.
Public health provides a useful framework for child maltreatment prevention (Covington, 2013; Klika et al., 2017). Such an approach involves a four-step process that starts with 1) surveillance to define the problem in the population followed by 2) the identification of risk and protective factors in order to 3) develop and test prevention strategies which are then 4) adopted widely (CDC, 2015).
Linked datasets that include information from multiple sources are a critical public health tool that can significantly improve the surveillance and identification of risk factors of severe and fatal child maltreatment (Putnam-Hornstein et al., 2013). While this approach has held great promise, its usage is limited to one study of AHT in Alaska focused on calculating incidence (Parrish et al., 2013). Other studies of AHT have typically relied on prospective examinations of samples at one or more hospitals to calculate an incidence rate (Barlow and Minns, 2000; Keenan et al., 2003; Shanahan et al., 2013; Yamaoka et al., 2020). Thus, this study aimed to add new knowledge about the incidence and risk factors of AHT through the use of a linked administrative dataset for the entire population of Washington state, USA.
Aims
This study adds new population-based knowledge regarding AHT incidence and risk factors using a public health approach to calculate the incidence and identify risk factors for the population of Washington state. Specifically, the aims of this study were to: 1) identify the incidence for children under the age of one and timing of AHT through age five among the population of children born in Washington state inclusive of years 1999 to 2013; 2) determine how many children hospitalised for AHT died; 3) identify the sociodemographic risk factors for AHT in this population; and 4) examine if a prior CPS report was a risk factor for AHT.
Methods
Data
This study used a unique population-based dataset of linked administrative birth, hospital discharge, CPS and death records. The study included all children born in Washington state from 1999 through 2013 (N = 1 271 416), the most recent data available to the researchers. The study was limited to hospitalisations for children under the age of five to align with the CDC definition. The dataset includes all hospitalisations in the state during this same time period, which is 332 676 unique hospitalisations. This study is part of a larger parent study that has approval through the Washington state Institutional Review Board.
Measures
The study identified AHT hospitalisations using ICD-9 diagnostic codes. We used the ICD-9 codes defined by the CDC for non-fatal abusive head trauma for children under five years old (Parks et al., 2012). Table 1 presents the specific codes. If co-occurring exclusion codes, indicating accidents or falls, were present, cases were not identified as AHT, as prescribed by the CDC (Parks et al., 2012). Some children (24) had multiple hospitalisations with AHT diagnoses. As it was unclear from the data if the subsequent hospitalisations were related to the first AHT admission or not, only the first AHT hospitalisation was used.
Table 1.
ICD-9-CM codes for defining non-fatal abusive head trauma in children under the age of 5 years
| ICD-9 Injury Code | Injury Code | ||
|---|---|---|---|
| Narrow Definition | Broad Definition | ICD-9 External Cause of Injury Code | |
| Definite or presumptive abusive head trauma | 781.0–781.4, 781.8, 800, 801, 803, 804.1–804.4, 804.6–804.9, 850, 851, 852.0–852.5, 853.0, 853.1, 854.0, 854.1, 925.1, 950.0–950.3, 959.01, 995.55* | 781.0–781.4, 781.8, 800, 801, 803, 804.1–804.4, 804.6–804.9, 850, 851, 852.0–852.5, 853.0, 853.1, 854.0, 854.1, 925.1, 950.0–950.3, 959.01, 995.55* | E960.0, E967, E968.1, E968.2, E968.8, E968.9, 995.50**, 995.54, 995.59** |
| Probable abusive head trauma | All of those above (except 995.55) | All of those above (except 995.55) | E987, E988.8, E988.9 |
Does not require a cause (E) code.
Exclude case in the presence of a fall or accident code
ICD-9-CM: International Classification of Diseases, Ninth Revision, Clinical Modification
We included several sociodemographic variables from the birth record. Maternal race/ethnicity was a categorical variable consisting of white, black, Hispanic, Native American, Asian/Pacific Islander and other/unknown. White was used as the reference category as it was the largest race/ethnicity category for the study. We constructed a child’s sex as a binary variable, either male or female. Female was treated as the referent category as previous research has indicated that male children are at higher risk for maltreatment-related hospitalisations (Mason et al., 2018). We included the mother’s age at the time of birth. Specifically, we divided the mother’s age into four categories for the descriptive analysis: 19 years and younger, 20–24, 25–29, and 30 or more years. We used a binary variable for the inferential statistical models, indicating that the mother was a teenager at the time of birth in order to use the same type of variable throughout the model, which improves the interpretation of the results. We defined parity, or the number of live births the mother experienced before the current birth, as a binary variable indicating the child to be the mother’s first-born child or a subsequent birth. This construction of parity is the same as the California injury mortality study (Putnam-Hornstein, 2011) and other studies using linked administrative data (Prindle et al., 2018; Rebbe et al., 2019).
We define birth payment based on the health insurance used to pay for the birth, according to the birth records. The birth payment was categorised as private if we found the payment labeled as ‘private insurance’ or ‘self-pay’. The other category, public insurance, included public forms of health insurance, most prominently, Medicaid. As the study years occurred before the implementation of the Affordable Care Act in 2014, this is likely a more accurate measure of poverty than more recent uses of health insurance as a poverty proxy. Private insurance was treated as the referent category as it was the largest category in the population.
We also included a categorical variable indicating the trimester prenatal care was started by the mother, as indicated on the birth records. There were four categories: first trimester, second trimester, third trimester, and no prenatal care recorded. We used a binary variable for the inferential statistical models indicating late (third trimester) or no prenatal care. Prenatal care started in the first or second trimester was the referent category as the majority of births in this period had prenatal care starts in this category.
The infant’s birth weight was converted to a binary variable as either low birth weight, as indicated below 2500 grammes, or normal birth weight, those of at least 2500 grammes, a typical construction for this variable (Mason et al., 2018; Putnam-Hornstein and Needell, 2011).
We also used the CPS records to identify if the child had been the subject of a CPS report (whether screened in or not) before the hospitalisation admission date related to AHT, i.e. We specifically modeled contact with CPS as a time-varying covariate. This construction of a prior CPS report is the same as in the California injury mortality study (Putnam-Hornstein, 2011). For children who were not associated with an AHT hospitalisation, CPS report is indicated if one occurred before the child’s fifth birthday, the age cutoff for the CDC definition of AHT.
Statistical Methods
Descriptive Analyses.
We conducted all analyses using R version 3.6.1 (R Core Team, 2019). For the statistical methods, we include all AHT hospitalisations regardless of CDC diagnosis classification (i.e., definitive, probable, narrow and broad). The first step in our analysis was to conduct a visual assessment of the child’s age in months at the time of the AHT hospitalisation.
We calculated incidence rates for children under the age of one by each birth year, and as a total for the 15 years of the study. Specifically, we divide the number of AHT hospitalisations by the number of births in a given year(s). Rates were then multiplied by 100 000.
We next examined the distributions of sociodemographic factors among the entire population of children born in Washington state from 1999–2013 and between the children who had a hospitalisation diagnosis of AHT and those who did not. We additionally examined prior CPS reports and all of the previously reported sociodemographic variables from the birth records. Finally, we calculate the frequency and percentages by variable, using chi-square to assess differences in the expected and observed frequencies for each sociodemographic variable.
Inferential Analyses.
We used survival methods to examine the associations between AHT hospitalisations and a prior CPS report and the sociodemographic variables from the birth record. Specifically, we used Cox proportional hazard models with the prior CPS report modeled as a time-varying covariate to take into consideration that a child’s prior CPS status could change over time. The adjusted model equation is:
where:
Results
Our results indicate that 354 children were hospitalised before the age of five with an AHT diagnosis. The majority (81.9% or 290) of the AHT hospitalisations occurred during the first year of the child’s life. The number of children aged between 12 and 23 months at the time of AHT hospitalisation was 33 (9.3 %), while 31 children were older than 23 months (8.8%). Based on the 1 271 065 children born in the state during the study period and the 290 children who experienced AHT before reaching age one, we found an incidence of 22.8 per 100 000 children under age one. Of the 354 children with AHT hospitalisations, more than 88 per cent (or 312) had a diagnosis classified by the CDC as definitive or presumptive. The majority (74.0% or 262) had diagnoses classified as narrow by the CDC.
Of the children diagnosed with AHT, 11.7 per cent (37) had an associated death certificate. The majority (86.5%) of the children who died did so within two weeks of their AHT admission. Most of the main cause of death codes were associated with assaults, with three-quarters of the deaths listing Y09, assault by unspecified means. The distribution of sociodemographic variables between all children experiencing AHT and those experiencing an AHT-related death did not find statistically significant differences except for two categories. First, male children comprised 73.0 per cent of those who died compared to 56.2 per cent of all AHT hospitalisations (Χ2 = 3.99, p = .045). Second, the distribution of maternal race/ethnicity differed with children with Native American mothers comprising 18.9 per cent of AHT deaths and just 5.6 per cent of all AHT hospitalisations, while children with Hispanic mothers were 10.8 per cent of AHT deaths and 17.5 per cent of all AHT hospitalisations (X2 = 16.34, p = .006). Further results are available on request.
Figure 1 presents the distribution of the age of the child in months at the time of the AHT hospital admission among hospital admissions that occurred in this first year. We observe two peaks in the distribution of the data, one for children aged two to three months and a second for children aged eight months. To examine if the observed modes were statistically present, we ran a dip test of unimodality (Hartigan and Hartigan, 1985) using the R package diptest (Maechler, 2016) on the distribution of age by months for first year AHT hospitalisations. The dip statistic was 0.07, with a p-value of less than .001, which indicated significant multimodality.
Figure 1.
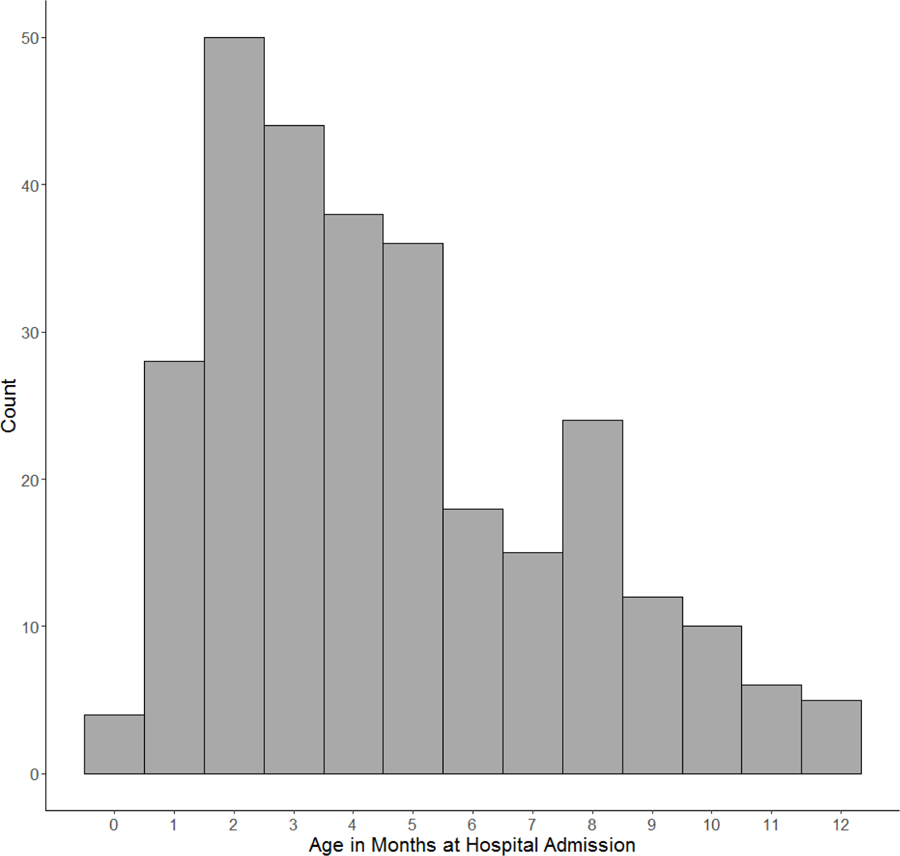
Histogram of child’s age in months at AHT hospital admission for cases in the first year.
AHT: Abusive head trauma
Table 2 presents the counts and rates of AHT under the age of one. The incidence per 100 000 for AHT ranged from a low of 11.2 in 2003 to a high of 34.6 in 2009. Notably, while five of the first seven birth years (1999–2005) had rates below 20 per 100 000, the subsequent eight birth years (2006–2013), did not go below 22.4 per 100 000. Indeed, four of the most recent eight years in the study had rates above 29 per 100 000.
Table 2.
Distribution of AHT incidence by Birth Year, Washington state, 1999–2013
| Birth Year | Births | Count AHT Hospitalisations < 1 year of age | Incidence < 1 year of age per 100 000 |
|---|---|---|---|
| 1999 | 79 616 | 9 | 11.3 |
| 2000 | 80 947 | 14 | 17.3 |
| 2001 | 79 568 | 13 | 16.3 |
| 2002 | 79 078 | 20 | 25.3 |
| 2003 | 80 563 | 9 | 11.2 |
| 2004 | 81 858 | 18 | 22.0 |
| 2005 | 82 904 | 10 | 12.1 |
| 2006 | 87 335 | 28 | 32.1 |
| 2007 | 89 480 | 20 | 22.4 |
| 2008 | 90 911 | 22 | 24.2 |
| 2009 | 89 712 | 31 | 34.6 |
| 2010 | 87 026 | 24 | 27.6 |
| 2011 | 87 560 | 26 | 29.7 |
| 2012 | 87 876 | 26 | 29.6 |
| 2013 | 86 982 | 20 | 23.0 |
| Total: | 1 271 416 | 290 | 22.8 |
AHT: Abusive head trauma
Table 3 presents the distribution of the sociodemographic and prior CPS report variables by AHT status. More than 20 per cent of children hospitalised for AHT had experienced a CPS report prior to the AHT hospitalisation, while only about 15 per cent of the population who did not experience AHT were associated with a CPS report prior to their fifth birthday. Maternal racial differences were observed between the general population and the population diagnosed with AHT. Specifically, we observed children whose mothers’ race was black or Native American in the AHT population at about twice the rate of the general population. Children experiencing AHT were more likely to have mothers who were teenagers at the time of their birth, have their births paid for using public insurance, and to be low birth weight than the general population. Full results are presented in Table 3.
Table 3.
Distribution and chi-square results on sociodemographic variables by AHT status.
| All Births |
No AHT |
AHT |
|||||
|---|---|---|---|---|---|---|---|
| 1 271 419 | 1 271 065 | 354 | |||||
| N | % | n | % | n | % | Χ2 | |
| CPS Report | 14.86 (p < .001) | ||||||
| Not Occurred | 1 079 202 | 84.9 | 1 078 928 | 84.9 | 274 | 77.4 | |
| Present | 192 217 | 15.1 | 192 137 | 15.1 | 80 | 22.6 | |
| Maternal Race/Ethnicity | 35.13 (p < .001) | ||||||
| White | 840 356 | 66.1 | 840 146 | 66.1 | 210 | 59.3 | |
| Black | 59 762 | 4.7 | 59 731 | 4.7 | 31 | 8.8 | |
| Hispanic | 203 385 | 16.0 | 203 323 | 16.0 | 62 | 17.5 | |
| Native American | 28 787 | 2.3 | 28 767 | 2.3 | 20 | 5.6 | |
| Asian/Pacific Islander | 120 485 | 9.5 | 120 457 | 9.5 | 28 | 7.9 | |
| Other/Unknown | 18 644 | 1.5 | 18 641 | 1.5 | 3 | 0.8 | |
| Child Sex | 3.27 (p = .071) | ||||||
| Female | 619 573 | 48.7 | 619 418 | 48.7 | 155 | 43.8 | |
| Male | 651 846 | 51.3 | 651 647 | 51.3 | 199 | 56.2 | |
| Maternal Age | 233.00 (p < .001) | ||||||
| <= 19 years | 102 942 | 8.1 | 102 855 | 8.1 | 87 | 24.6 | |
| 20–24 years | 295 316 | 23.2 | 295 174 | 23.2 | 142 | 40.1 | |
| 25–29 years | 361 060 | 28.4 | 360 980 | 28.4 | 80 | 22.6 | |
| 30+ years | 511 561 | 40.2 | 511 516 | 40.2 | 45 | 12.7 | |
| Birth Payment | 58.49 (p < .001) | ||||||
| Public | 444 914 | 35.0 | 444 721 | 35.0 | 193 | 54.5 | |
| Private | 826 505 | 65.0 | 826 344 | 65.0 | 161 | 45.5 | |
| Prenatal Care | 14.90 (p = .002) | ||||||
| 1st trimester | 666 769 | 52.4 | 666 615 | 52.4 | 154 | 43.5 | |
| 2nd trimester | 403 985 | 31.8 | 403 856 | 31.8 | 129 | 36.4 | |
| 3rd trimester | 70 231 | 5.5 | 70 200 | 5.5 | 31 | 8.8 | |
| None | 130 434 | 10.3 | 130 394 | 10.3 | 40 | 11.3 | |
| Parity | 3.37 (p = .067) | ||||||
| First birth | 519 097 | 40.8 | 518 935 | 40.8 | 162 | 45.8 | |
| Non-first birth | 752 322 | 59.2 | 752 130 | 59.2 | 192 | 54.2 | |
| Infant Birth Weight | 27.82 (p < .001) | ||||||
| Low (<2500 g) | 82 714 | 6.5 | 82 666 | 6.5 | 48 | 13.6 | |
| Normal (2500+) | 1 188 705 | 93.5 | 1 188 399 | 93.5 | 306 | 86.4 | |
AHT: Abusive head trauma
The Cox proportional hazards model results indicate that the estimated hazard of an AHT hospitalisation for children who experience a CPS report is three times that of children who have not been reported to CPS. Similarly, the estimated hazard of an AHT hospitalisation for children whose mothers are teenagers at the time of their birth is almost three times higher than children whose mothers were at least 20 years old at the time of birth. The estimated hazard for children who had low birth weights, had mothers with Native American identified as their race, and whose births were paid for using public insurance were almost twice that of children who weighed at least 2500 grammes, whose mothers were white, and whose births were paid for using private insurance, respectively. The full Cox proportional hazard model results are presented graphically in Figure 2.
Figure 2.
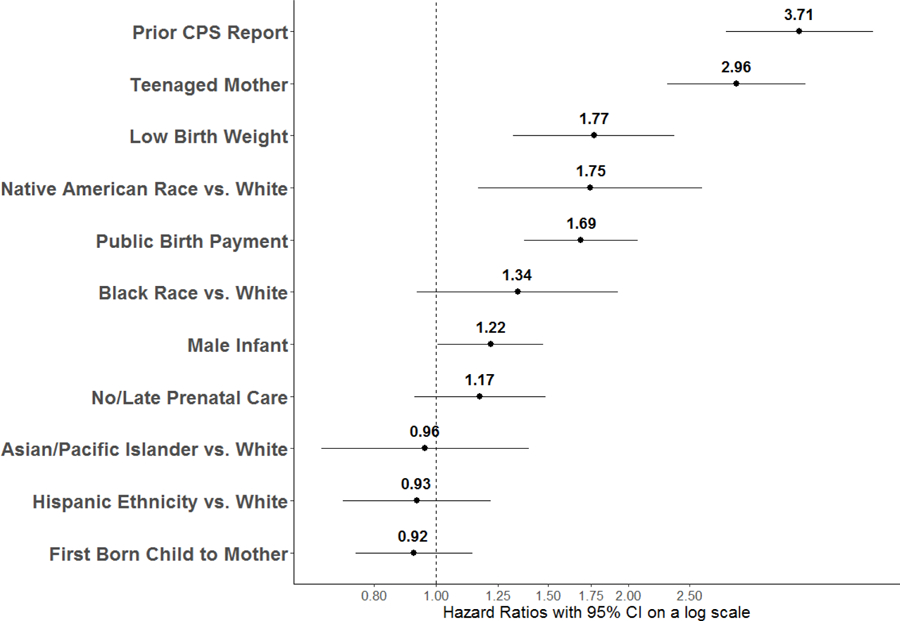
Cox proportional adjusted hazard model results for abusive head trauma.
Discussion
This study employed population-based linked administrative data to examine the incidence and risk factors of AHT. The results presented here can be applied in the development and implementation of prevention programmes, congruent with a public health approach for prevention.
Specifically, this study identified an incidence of 22.8 per 100 000 children under age one for Washington state for the years 1999–2013. This rate is lower than previous studies that also used the CDC criteria (Parrish et al., 2013; Shanahan et al., 2013). The results here are similar to the rates identified in Shanahan et al. (2013) for the Northeast region, which ranged from a low of 22.1 per 100 000 to a high of 27.9 per 100 000 between 2000 and 2009. While this study’s results are based in Washington state, which is not in the Northeast, it is part of the West region, which is a heterogeneous group including the states of California, Montana, Oregon, New Mexico and Colorado. It may be that Washington state has more in common demographically with the Northeastern states than the Western states. The differences with the Alaskan results may reflect actual differences between the populations, but may also have to do with the sources of data. The Alaska study included data sources beyond hospital discharge records to identify AHT including a trauma registry, a surveillance tool for child abuse and neglect, Medicaid records and multiple sources of death records (Parrish et al., 2013). This is in contrast to the current study and the Shanahan et al. (2013) study which relied on hospital discharge data to identify cases of AHT. The Alaska study concluded that they were able to identify 49 per cent more AHT cases by examing the multiple data sources. Therefore, the higher incidence found in Alaska may be the product of linking multiple data sources to identify cases of AHT.
Our study identified two peaks in the age of children in the age distribution of AHT. This is similar to the findings in Japan (Fujiwara et al., 2008; Yamaoka et al., 2020). The first peak has previously been attributed to the timing of crying in infants (Lee et al., 2007). The second peak around eight months had previously been identified as a unique finding for the population of Japan (Yamaoka et al., 2020). This finding implies that this second peak may not be isolated to Japan, indicating the need for further exploration in additional populations and enhanced understanding of the explanation for this timing. Practitioners should be aware that based on this finding, and those in Japan, AHT may not always coincide with crying patterns.
The risk factors identified in this study provide new knowledge about who is at risk of AHT. The finding of a prior CPS report as the strongest predictor of experiencing AHT is congruent with the California findings for injury mortality (Putnam-Hornstein, 2011). This finding supports the argument that a prior CPS report is ‘an independent signal of risk’ (Putnam-Hornstein, 2011, p. 172). Consequently, prevention and support services targeted at all children who are the subject of a CPS report, regardless of the results of the investigation, could greatly reduce the occurrence of severe and fatal child maltreatment, including AHT. This effect, however, should be interpreted in light of the overlapping effect of maternal age. Given the potential for maternal age to impact the likelihood of CPS involvement, future research should focus on potential interactions between these two risk factors. For readers who are unfamiliar with event history modeling, this finding does not at all suggest a causal relationship between contact with the CPS system and AHT. Similar to the findings of Putnam-Hornstein (2011), CPS reports in this study can be viewed as an indicator of the sorts of familial and environmental risk factors that increase a child’s risk of AHT or other injuries, but which are not well measured by variables in administrative datasets. In other words, the children who are reported to CPS are per se at increased risk of AHT. They do not become at risk of AHT because of CPS reports.
Some of the sociodemographic variables from the birth records identified as risk factors are similar to the findings in previous studies. Public health insurance has been found to be a risk factor in a number of studies of AHT (Ellingson et al., 2008; Niederkrotenthaler et al., 2013; Ettaro et al., 2004) and in our present study. Our finding that the children of young mothers are at increased risk of AHT is congruent with studies in Alaska (Parrish et al., 2013), North Carolina (Keenan et al., 2003) and Pennsylvania (Kesler et al., 2008). These findings are in line with previous research that identified sociodemographic risk factors from birth records for CPS involvement (Putnam-Hornstein and Needell, 2011) and maltreatment hospitalisation (Mason et al., 2018). The consistency of these variables across a number of child maltreatment outcomes as risk factors, increase the need for them to be used as targets in maltreatment prevention programming by practitioners and policymakers.
Despite the strengths and advancements of this study, there are at least three limitations. First, we do not have access to the military hospitals in the state. As there are a few military installations located in Washington state, we are unable to capture the cases of AHT at the medical facilities attached to these military hospitals. However, previous research using Department of Defense birth and infant records found a similar incidence of AHT when compared to civilian populations and similar risk factors (male child and young maternal age) (Gumbs et al., 2013). Second, our data did not contain hospitalisation records for the full five years for all children born in the dataset. Thus, while AHT typically does occur in the first year of life and we limited our calculations of AHT incidence to the first year, there are likely cases we are missing for the risk factor analysis (which included all instances of AHT under age five) due to the absence of these data. Third, in regards to the deaths, we only examined if children with an AHT hospitalisation then died. It is likely that there were some children who experienced AHT and died but were not hospitalised. Not including these instances of AHT likely underestimates the incidence of AHT.
Conclusion
Through the use of a linked administrative dataset, this study examined the incidence and risk factors of AHT for the population of Washington state over a 15-year period. We found an incidence of 22.8 per 100 000 children under the age of one with two peaks occurring at two and eight months. The use of multiple data sources enabled the examination of a broader array of risk factors than could be found in medical records alone. Indeed, we found that children with a prior CPS report had an estimated hazard of AHT three times that of children who did not have a CPS report. Additionally, risk factors identified on birth records including teenaged mother and low birth weight were identified. Congruent with a public health approach, these risk factors can be used in the development and implementation of AHT prevention efforts.
Key Practitioner Messages:
A risk factor of AHT includes a prior CPS report, regardless of the findings of the CPS report.
Two peaks of AHT were found, one at two months and another at eight months.
Prevention programming can target sociodemographic information available on birth records including teenaged mothers, low birth weight and births paid for with public insurance.
Funding:
This work was supported by Steve and Connie Ballmer Family Giving, Casey Family Programs, and the Stuart Foundation. Partial support for this research came from a Eunice Kennedy Shriver National Institute of Child Health and Human Development research infrastructure grant, P2C HD042828, to the Center for Studies in Demography & Ecology at the University of Washington.
Contributor Information
Rebecca Rebbe, University of Southern California Suzanne Dworak-Peck School of Social Work, Los Angeles, CA, USA.
Joseph A. Mienko, Center for Social Sector Analytics & Technology, University of Washington School of Social Work, Seattle, WA, USA
Melissa L. Martinson, University of Washington School of Social Work, Seattle, WA, USA
References
- Barlow K, Minns R. 2000. Annual incidence of shaken impact syndrome in young children. The Lancet 356(9241): 1571–1572. 10.1016/S0140-6736(00)03130-5 [DOI] [PubMed] [Google Scholar]
- Barlow K, Thomson E, Johnson D, Minns R. 2005. Late neurologic and cognitive sequelae of inflicted traumatic brain injury in infancy. Pediatrics 116(2): e174–e185. 10.1542/peds.2004-2739 [DOI] [PubMed] [Google Scholar]
- Berger RP, Parks S, Fromkin J, Rubin P, Pecora PJ. 2015. Assessing the accuracy of the International Classification of Diseases codes to identify abusive head trauma: A feasibility study. Injury Prevention 21(e1): e133–7. 10.1136/injuryprev-2013-040924 [DOI] [PMC free article] [PubMed] [Google Scholar]
- Centers for Disease Control and Prevention (CDC). 2015. The public health approach to violence prevention. Available: https://www.cdc.gov/violenceprevention/publichealthissue/publichealthapproach.html [1 May 2020].
- Covington T 2013. The public health approach for understanding and preventing child maltreatment: A brief review of the literature and a call to action. Child Welfare 92(2): 21–39. [PubMed] [Google Scholar]
- Duhaime A, Christian C, Moss E, Seidl T. 1996. Long-term outcome in infants with the shaking-impact syndrome. Pediatric Neurosurgery 24(6): 292–298. 10.1159/000121058 [DOI] [PubMed] [Google Scholar]
- Ellingson K, Leventhal J, Weiss H. 2008. Using hospital discharge data to track inflicted traumatic brain injury. American Journal of Preventive Medicine 34(4): S157–S162. 10.1016/j.amepre.2007.12.021 [DOI] [PubMed] [Google Scholar]
- Emrick BB, Smith E, Thompson L, Mullett C, Pino E, Snyder K, Kroll M-A, Ayoubi S, Phillips J, Istfan S, Welch CA, McJunkin JE. 2019. Epidemiology of abusive head trauma in West Virginia children. Child Abuse & Neglect 93: 215–221. 10.1016/j.chiabu.2019.05.011 [DOI] [PMC free article] [PubMed] [Google Scholar]
- Ettaro L, Berger R, Songer T. 2004. Abusive head trauma in young children: Characteristics and medical charges in a hospitalized population. Child Abuse & Neglect 28(10): 1099–1111. 10.1016/j.chiabu.2004.06.006 [DOI] [PubMed] [Google Scholar]
- Fujiwara T, Okuyama M, Miyasaka M. 2008. Characteristics that distinguish abusive from nonabusive head trauma among young children who underwent head computed tomography in Japan. Pediatrics 122(4): e841–7. 10.1542/peds.2008-0387 [DOI] [PubMed] [Google Scholar]
- Gumbs GR, Keenan HT, Sevick CJ, Conlin AMS, Lloyd DW, Runyan DK, Ryan MAK, Smith TC. 2013. Infant abusive head trauma in a military cohort. Pediatrics 132(4): 668–676. 10.1542/peds.2013-0168 [DOI] [PubMed] [Google Scholar]
- Hartigan J, Hartigan P. 1985. The dip test of unimodality. The Annals of Statistics 13(1): 70–84. 10.1214/aos/1176346577 [DOI] [Google Scholar]
- Keenan HT, Runyan DK, Marshall SW, Nocera MA, Merten DF, Sinal SH. 2003. A population-based study of inflicted traumatic brain injury in young children. JAMA 290(5): 621–626. 10.1001/jama.290.5.621 [DOI] [PubMed] [Google Scholar]
- Kesler H, Dias M, Shaffer M, Rottmund C, Cappos K, Thomas N. 2008. Demographics of abusive head trauma in the Commonwealth of Pennsylvania. Journal of Neurosurgery. 1(5): 351–356. 10.3171/PED/2008/1/5/351 [DOI] [PubMed] [Google Scholar]
- Klika JB, Lee S, Lee JY. 2017. Prevention of child maltreatment In: The APSAC Handbook on Child Maltreatment (4th ed.), Klika JB & Conte JR (Eds.). Sage: Thousand Oaks, CA. [Google Scholar]
- Lee G, Barr G, Catherine G, Wicks G. 2007. Age-related incidence of publicly reported shaken baby syndrome cases: Is crying a trigger for shaking? Journal of Developmental & Behavioral Pediatrics 28(4): 288–293. 10.1097/DBP.0b013e3180327b55 [DOI] [PubMed] [Google Scholar]
- Maechler M 2016. diptest: Hartigan’s dip test statistic for unimodality - corrected. R package version 0.75–7. Available: https://CRAN.R-project.org/package=diptest [1 May 2020].
- Mason SM, Schnitzer PG, Danilack VA, Elston B, Savitz DA. 2018. Risk factors for maltreatment-related infant hospitalizations in New York City, 1995–2004. Annals of Epidemiology 28(9): 590–596. 10.1016/j.annepidem.2018.05.010 [DOI] [PMC free article] [PubMed] [Google Scholar]
- Niederkrotenthaler T, Xu L, Parks S, Sugerman D. 2013. Descriptive factors of abusive head trauma in young children—United States, 2000–2009. Child Abuse & Neglect 37(7): 446–455. 10.1016/j.chiabu.2013.02.002 [DOI] [PubMed] [Google Scholar]
- Parks SE, Annest JL, Hill HA, Karch DL. 2012. Pediatric abusive head trauma: Recommended definitions for public health surveillance and research. Centers for Disease Control and Prevention: Atlanta, GA: Available: https://www.cdc.gov/ViolencePrevention/pdf/PedHeadTrauma-a.pdf [1 May 2020]. [Google Scholar]
- Parrish J, Baldwin-Johnson C, Volz M, Goldsmith Y. 2013. Abusive head trauma among children in Alaska: A population-based assessment. International Journal of Circumpolar Health 72(1): 1–8. 10.3402/ijch.v72i0.21216 [DOI] [PMC free article] [PubMed] [Google Scholar]
- Peterson C, Xu L, Florence C, Parks S. 2015. Annual cost of U.S. hospital visits for pediatric abusive head trauma. Child Maltreatment 20(3): 162–169. 10.1177/1077559515583549 [DOI] [PMC free article] [PubMed] [Google Scholar]
- Prindle J, Hammond I, Putnam-Hornstein E. 2018. Prenatal substance exposure diagnosed at birth and infant involvement with child protective services. Child Abuse & Neglect 76: 75–83. 10.1016/j.chiabu.2017.10.002 [DOI] [PubMed] [Google Scholar]
- Putnam-Hornstein E 2011. Report of maltreatment as a risk factor for injury death: A prospective birth cohort study. Child Maltreatment 16(3): 163–174. 10.1177/1077559511411179 [DOI] [PubMed] [Google Scholar]
- Putnam-Hornstein E, Needell B. 2011. Predictors of child protective service contact between birth and age five: An examination of California’s 2002 birth cohort. Children and Youth Services Review 33(11): 2400–2407. 10.1016/j.childyouth.2011.07.010 [DOI] [Google Scholar]
- Putnam-Hornstein E, Wood JN, Fluke J, Yoshioka-Maxwell A, Berger RP. 2013. Preventing Severe and Fatal Child Maltreatment: Making the Case for the Expanded Use and Integration of Data. Child Welfare 92(2): 59–75. [PubMed] [Google Scholar]
- R Core Team. 2018. R: A language and environment for statistical computing. R Foundation for Statistical Computing: Vienna, Austria: https://www.R-project.org/. [Google Scholar]
- Rebbe R, Mienko J, Brown E, Rowhani-Rahbar A. 2019. Child protection reports and removals of infants diagnosed with prenatal substance exposure. Child Abuse & Neglect 88: 28–36. 10.1016/j.chiabu.2018.11.001 [DOI] [PMC free article] [PubMed] [Google Scholar]
- Schnitzer PG, Slusher PL, Kruse RL, Tarleton MM. 2011. Identification of ICD codes suggestive of child maltreatment. Child Abuse & Neglect 35(1): 3–17. 10.1016/j.chiabu.2010.06.008 [DOI] [PubMed] [Google Scholar]
- Shanahan ME, Zolotor AJ, Parrish JW, Barr RG, Runyan DK. 2013. National, regional, and state abusive head trauma: Application of the CDC algorithm. Pediatrics 132(6): e1546–53. 10.1542/peds.2013-2049 [DOI] [PMC free article] [PubMed] [Google Scholar]
- Yamaoka Y, Fujiwara T, Fujino Y, Matsuda S, Fushimi K. 2020. Incidence and age distribution of hospitalized presumptive and possible abusive head trauma of children under 12 months old in Japan. Journal of Epidemiology 30(2): 91–97. 10.2188/jea.JE20180094 [DOI] [PMC free article] [PubMed] [Google Scholar]