Abstract
Purpose:
Stereotactic radiosurgery (SRS) has become a standard of care for patients’ with brain metastases (BMs). However, the manual multiple BMs delineation can be time-consuming and could create an efficiency bottleneck in SRS workflow. There is a clinical need for automatic delineation and quantitative evaluation tools. In this study, building on our previous developed deep learning-based segmentation algorithms, we developed a web-based automated BMs segmentation and labeling platform to assist the SRS clinical workflow.
Method:
This platform was developed based on the Django framework, including a web client and a back-end server. The web client enables interactions as database access, data import, and image viewing. The server performs the segmentation and labeling tasks including: skull stripping; deep learning-based BMs segmentation; and affine registration-based BMs labeling. Additionally, the client can display BMs contours with corresponding atlas labels, and allows further postprocessing tasks including: (a) adjusting window levels; (b) displaying/hiding specific contours; (c) removing false-positive contours; (d) exporting contours as DICOM RTStruct files; etc.
Results:
We evaluated this platform on 10 clinical cases with BMs number varied from 12–81 per case. The overall operation took about 4–5 min per patient. The segmentation accuracy was evaluated between the manual contour and automatic segmentation with several metrics. The averaged center of mass shift was 1.55 ± 0.36 mm, the Hausdorff distance was 2.98 ± 0.63 mm, the mean of surface-to-surface distance (SSD) was 1.06 ± 0.31 mm, and the standard deviation of SSD was 0.80 0.16 mm. In addition, the initial averaged false-positive over union (FPoU) and false-negative rate (FNR) were 0.43 ± 0.19 and 0.15 ± 0.10 respectively. After case-specific postprocessing, the averaged FPoU and FNR were 0.19 ± 0.10 and 0.15 ± 0.10 respectively.
Conclusion:
The evaluated web-based BMs segmentation and labeling platform can substantially improve the clinical efficiency compared to manual contouring. This platform can be a useful tool for assisting SRS treatment planning and treatment follow-up.
Keywords: brain metastases, stereotactic radiosurgery, segmentation
1. INTRODUCTION
Brain metastases (BMs) represent the most common brain cancers with a median survival of 11 months.1 Its incidence has increased with the advanced therapy technology and prolonged cancer survival. An estimated 20–40% of all cancer patients in the United States have brain metastases.2,3
Whole brain radiotherapy (WBRT), irradiating the entire brain, is a standard of care for patients with more than three BMs. Stereotactic radiosurgery (SRS), delivering high dose to a small target volume with fast dose fall-off within the brain, is often chosen for patients with limited size and limited number (<3) BMs.4–6 Recently, SRS has been considered as a less toxic alternative to WBRT for patients with BMs > 3,7 since several clinical trials has demonstrated that cognitive function decline was found more frequent with WBRT than with SRS while no difference in overall survival was found between these two regimens.8,9 High quality SRS treatment outcome requires accurate target delineation for: a) high-quality treatment planning to ensure tumoricidal dose to the target and minimal dose to nearby critical structures and normal tissue; and b) post-treatment follow-up to quantitatively evaluate tumor progression or regression. However, in current clinical practice, physicians have to manually delineate and label the BMs. This process is highly time-consuming especially in patients with mBMs, where manual contouring and labeling is proportional to number of tumors. In some extreme cases in which the number of BMs is up to a hundred, this process could take hours. Therefore, the automation of mBMs segmentation and labeling has become an urgent need in the clinic.
Brain tumor segmentation has been a prevalent research topic for decades, and various algorithms have been proposed.10–13 However, those algorithms cannot be directly applied into SRS for clinical use. For example, some of these methods require the integration of multimodality images,10,14–16 but the SRS treatment often only acquires T1-weighted MRI with Gadolinium contrast (T1c) to accommodate clinical workflow. In addition, some methods are threshold-based or region-based.17 However, BMs are often small in sizes, which can be missed in theses algorithms. Furthermore, some of these algorithms are only applicable in the 2D images,16,18,19 or are not fully automated and require manual interactions.20–23 For example, Havaei et al. proposed a kNN-based brain tumor segmentation algorithm which requires manual selection of voxels.22
Recently, more BMs auto-detection and segmentation algorithms are developed.24–29 For the algorithms focusing on the BMs auto-detection task,28,29 manual input to contour the BMs is still needed after the auto-detection. Among the studies focusing on BMs segmentation task,24–27 Chitphakdithai et al. utilized longitudinal scans to segment and track BMs volume changes.25 With the requirement of a time series of scans and image registration, this algorithm could be a good tool for treatment follow-up, but maybe difficult to be adopted in SRS treatment as series images might not be available. Losch et al. investigated and applied deep convolutional networks (with varied network settings) on the detection and segmentation of BMs.26 This initial investigation achieved reasonable results, but its performance could be further improved, especially on the computational time. Charron et al. adapted the DeepMedic30 model and explored using single and multimodal MRIs to segment BMs.24 So far there is still no commercial available tool for automatic BMs delineation and labeling in SRS, as well as the treatment response evaluation.
To address the clinical need, the goal of our study is to develop an accurate automated BMs segmentation tool to improve the efficiency of SRS treatment. Our group has previously proposed a deep learning-based BMs segmentation algorithm utilizing single T1c image modality for SRS applications.31 Based on this algorithm, we developed a web-based automatic brain metastases segmentation and labeling platform with post-processing functions, which could offer substantial clinical time savings and improvement in workflow efficiency.
2. MATERIALS AND METHODS
Figure 1 illustrates the framework of this web-based BMs segmentation and labeling platform. In current stage, this platform is developed and used in our own institution behind institutional network firewall to avoid HIPPA violation. It consists of a web client side and a back-end server side. The client side is developed in HTML and JavaScript, and could be launched with any common web browsers. Once under the institutional internal network, certified users can access the web client via the server IP/Port address. This web-based design allows the users to utilize the developed tools without software installation on local computers. This web client enables the user interactions such as database access, image visualization, and task selection, etc. The back-end server is developed based on the Django framework32 in Python. This server side is responsible of executing the tasks received from the web client, for instance, data format conversion, BMs segmentation and labeling, postprocessing, etc. As is demonstrated in the Fig. 1, the overall workflow of this platform can be described in the following process:
FIG. 1.
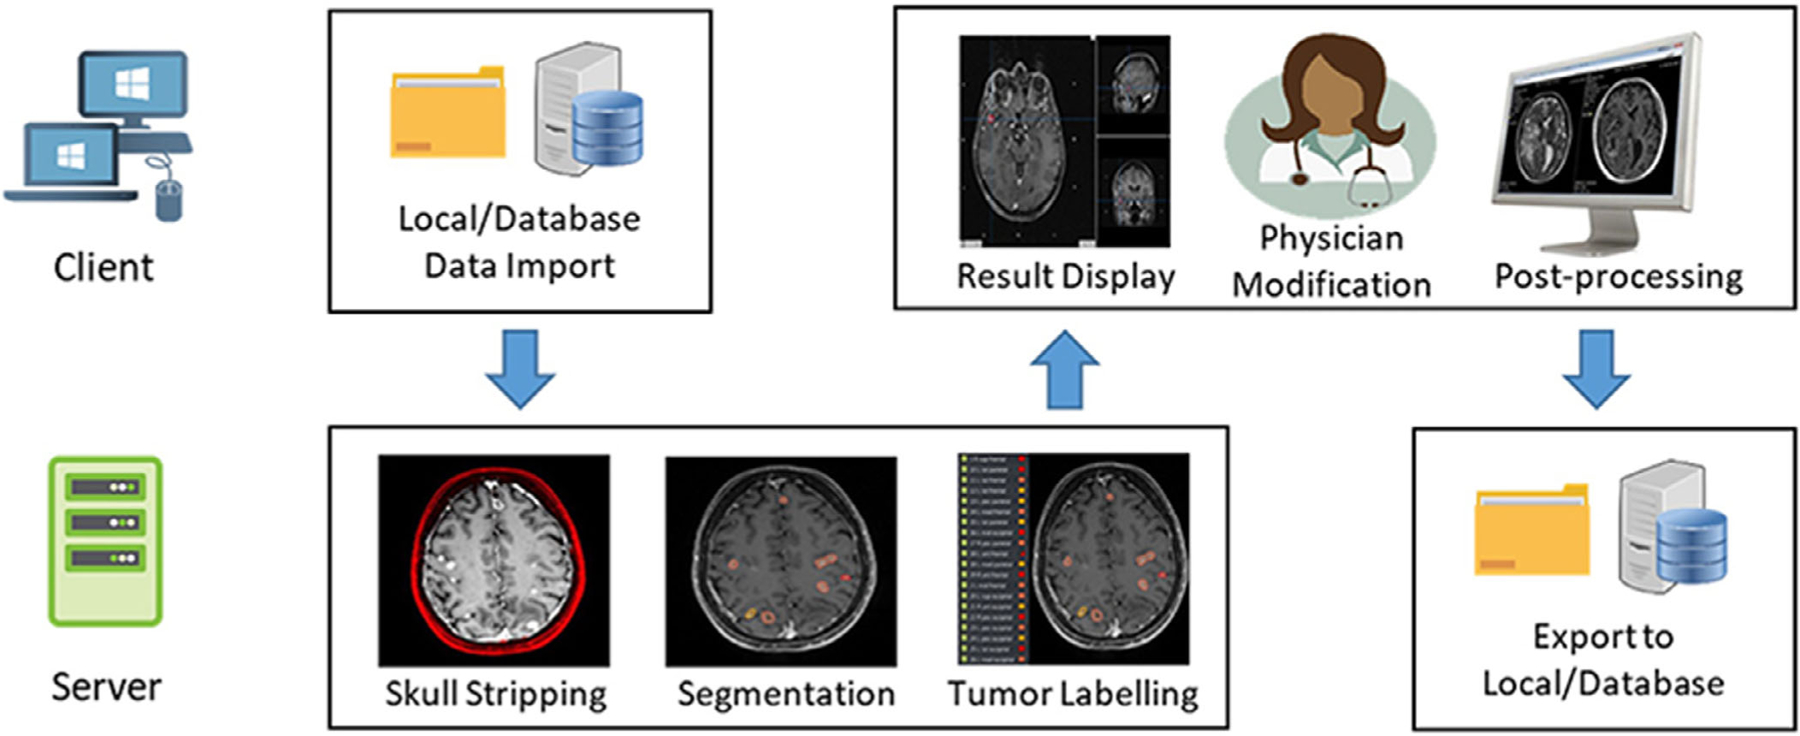
The overall workflow of this web-based BMs segmentation and labeling platform.
Users import images from local folder or database through the web client;
After receiving the imported data from the client, the back-end server performs tasks including skull stripping, BMs segmentation, and labeling, and then sends the results back to the client;
The web client displays the received segmentation results, and allows the users to conduct further modification as well as postprocessing;
Once finished the postprocessing, the server exports the modified segmentation as DICOM RTStruct file into a local folder or to the DICOM server.
2.A. Database design
Database design is essential in the construction of this platform for managing patient data. In clinic, the patient data usually contains two main components, the DICOM images and the nonimage clinical parameters. These two components supports each other and are inseparable for clinical use. For efficient database management, two kinds of database structures are implemented in this platform: Orthanc33 and MongoDB.34
Orthanc is an open-source, lightweight, and standalone DICOM server for healthcare and medical research. Our platform utilizes the Orthanc for storing the DICOM images. For the clinical data, another open-source database MongoDB is implemented in the platform. MongoDB is a document-oriented non-SQL database, which is powerful in processing the clinical parameters. The clinical parameters, such as primary histology, prior SRS, prior WBRT, are usually nonrelational and unstructured data, thus making the JSON format preferred in our implementation. Within the database, data are stored as key-value pairs. Patient ID is set as the key to connect these two database and link all the clinical parameters.
Once uploaded in this platform, patient data will be stored in the platform database. Users can import images from this database or the local folder for different tasks. In addition, this database also allows the users to conduct follow-up evaluation utilizing the patient treatment history stored in the database. For patient confidentiality and data security purpose, the web client access is required to be under the secured network environment with valid individual credential.
2.B. Interface design
The layout design of the client interface is demonstrated in the [Fig. 2(a)], with detailed zoom-in views provided in [Figs. 2(b)–2(d)]. In general, this interface mainly contains three components including a task bar [Fig. 2(b)], a task-related function list [Fig. 2(c)], and a 3D image viewer function list [Fig. 2(d)]:
FIG. 2.
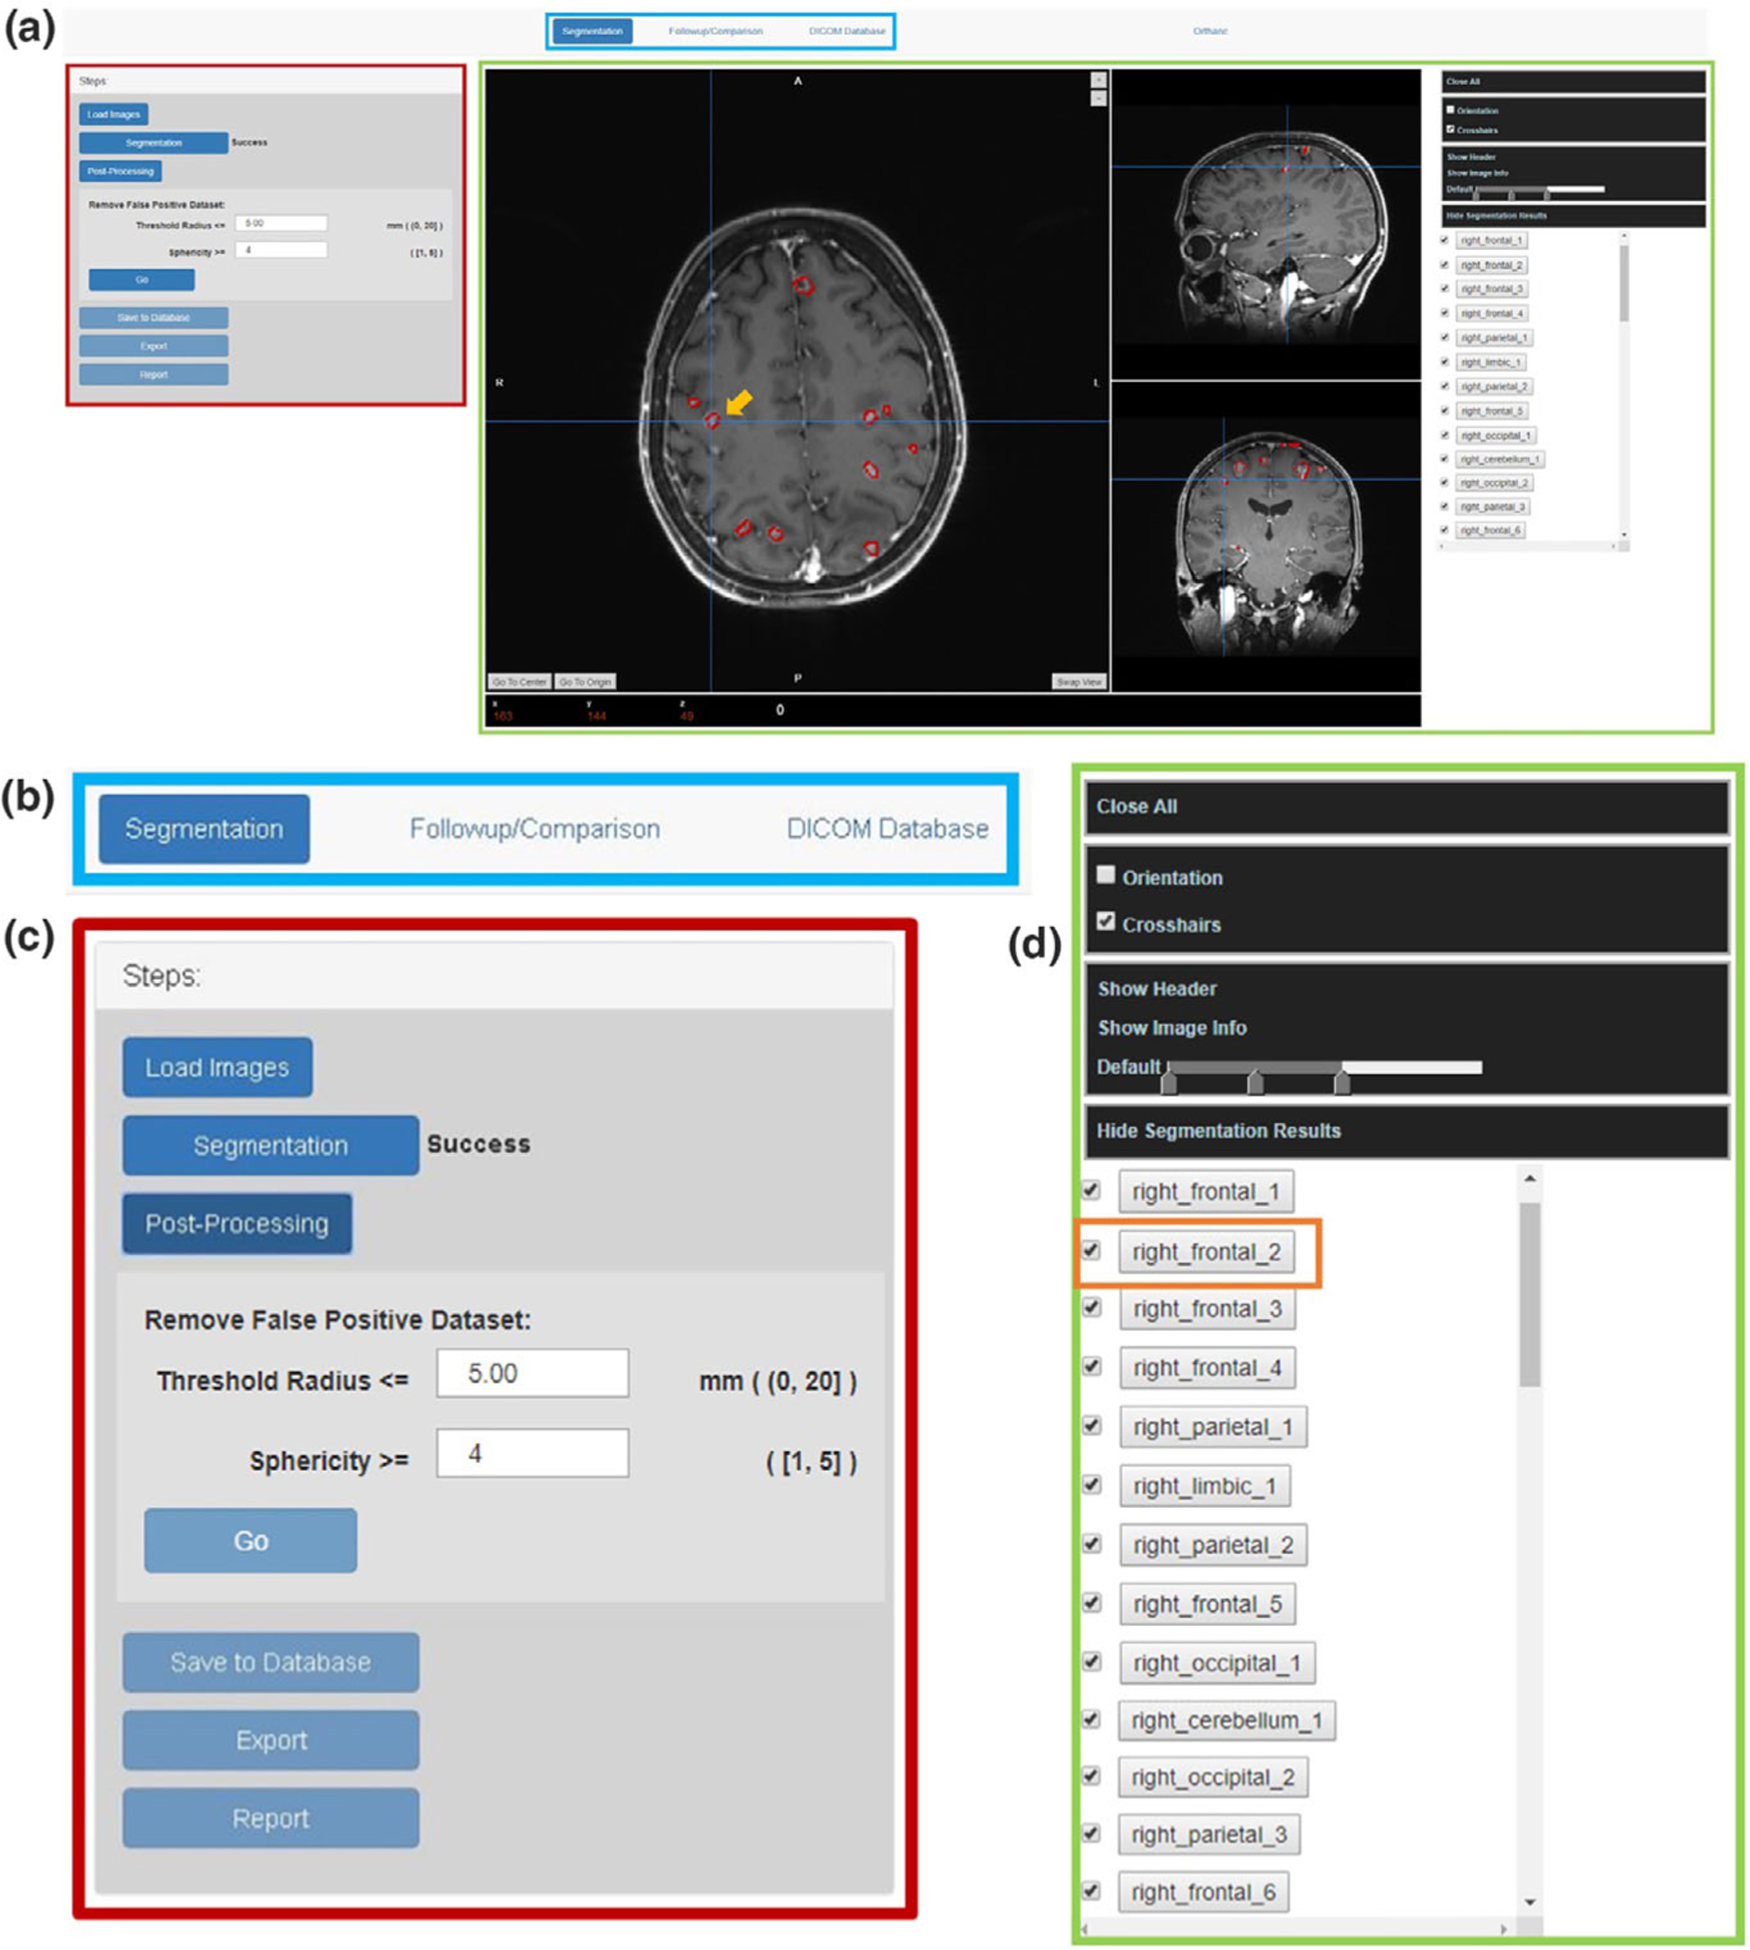
The layout design of the platform interface: (a) the overall the interface design; (b) The task bar design; (c) The tasked-based function list; (d) the 3D image viewer function list.
Navigating through the task bar (blue box in [Fig. 2(a)]), users can select tasks among segmentation, follow-up comparison, or database access.
The left side of the interface (marked with the red box in [Fig. 2(a)]) is the task-related function list. For instance, the segmentation-related functions include image upload, BMs segmentation, false-positive contour removal, results export, and report generation.
The right side of this interface (marked with the green box in [Fig. 2(a)]) implements a 3D image viewer which displays the imported images as well as the segmentation results. A list of the segmented BMs with corresponding atlas labels will also be displayed there after the completeness of the segmentation task. This imager viewer also provides basic viewer functions including change the window levels, show image orientation, read crosshair coordinates, read the DICOM header, and hide/display specific tumor contours, etc.
As in the case shown in [Fig. 2(a)], the automatic-segmented BMs contours are displayed in red and overlaid with the cross-section images in the interface. Each BMs are labeled based on their anatomical locations, and will be listed on the right side of the interface [Fig. 2(d)]. For example, in the 3D image viewer, the segmentation pointed by the crosshair with the orange arrow in [Fig. 2(a)] is corresponding to the label ‘right_frontal_2’ marked with orange box in the tumor label list in [Fig. 2(d)]. The tumor label list allows the users to locate or review a specific segmentation, and to hide or select tumor segmentation from the list. By clicking one tumor label from the list, the crosshair will jump to the center of that tumor to guide the users locate the target.
2.C. Backbone algorithms
2.C.1. BMs segmentation
Previously our group has developed an automatic BMs segmentation algorithm with a deep learning algorithm, En-DeepMedic, based on T1c image only.31 Concentric local and global 3D image patches will be extracted from the input image volumes and then utilized in the En-DeepMedic CNN architecture to accurately segment mBMs.
We incorporate the above segmentation algorithm along with other necessary preprocessing procedures into this platform, thus ensuring this platform be robust for conducting the BMs auto-segmentation task in clinical SRS cases. The segmentation workflow implemented in the platform can be described in the following steps:
Convert the original DICOM images into Nifti format, and resample into the resolution of 1mm3;
Strip skull using robust learning-based MRI brain extraction system (ROBEX);35
Segment BMs with the En-DeepMedic network;
Resample the segmentation results back to the original resolution.
During the segmentation, a sign will be displayed next to the segmentation button in the function list [Fig. 2(c)] to indicate the status of the process as ‘Processing’, ‘Success,’ or ‘Failed’. After the segmentation task is completed, the platform will proceed the BMs labeling process introduced as below.
2.C.2. BMs labeling
In clinical practice, physician will label each BMs contour based on its anatomical location within the brain. This process is essential for treatment planning and treatment follow-up by identifying each tumor. To mimic and automate this manual labeling process, we designed an affine registration-based algorithm to automatically label BMs contours. The general idea of this algorithm is to map the patient’s brain into a common brain atlas and to label each BMs based on its location in the atlas.
In this platform, we utilized the Talairach (TAL) atlas36 as the template for BMs labeling. The TAL atlas is a 3-dimensional coordinate system of the human brain, which can be used to map the orientation of brain structures independent from individual variations in size or shape. It provides a hierarchy of anatomical regions based on volume-occupant with corresponding labels indicating the hemisphere level, lobe level, gyrus level, tissue level, and cell level correspondence. Considering the actual clinical need in radiation oncology, in this platform, the original five-level label from the TAL atlas is condensed to a two-level label, indicating only the hemisphere and lobe of the BMs location in the TAL atlas. Table I lists the simplified labels used in the platform.
TABLE I.
A list of the simplified TAL atlas label for BMs labeling.
| Hemisphere level | Lobe level | Label name |
|---|---|---|
| Left/right cerebrum | Frontal | left_frontal |
| Insula | left_insula | |
| Cingulate | left_cingulate | |
| Limbic | left_limbic | |
| Occipital | left_occipital | |
| Parietal | left_parietal | |
| Sublobar | left_sub_lobar | |
| Thalamus | left_thalamus | |
| Temporal | left_temporal | |
| Cerebellum | left_cerebellum | |
| Brainstem | Midbrain | brainstem_midbrain |
| Pons | brainstem_pons | |
| Medulla | brainstem_medulla | |
| Inter-hemispheric | / | inter_hemispheric |
| Occipital | inter_hemispheric_occipital | |
| Sublobar | inter_hemispheric_sub_lobar | |
| Frontal | inter_hemispheric_frontal | |
| Limbic | inter_hemispheric_limbic |
Accurately mapping the patient data into the TAL atlas is crucial for the BMs labeling process. However, the TAL atlas is not an MRI-like intensity-based brain atlas, which can cause errors when registering patient images with TAL atlas. Considering this potential problem, we incorporate another commonly used brain atlas into the labeling process, which is the MNI standard space.37 The MNI space is a brain atlas model generated by averaging 305 T1 MRI brains. The transformation between the MNI space and the TAL space has already been investigated by many research groups.38–40 Therefore, using MNI space as a co-registration bridge between TAL space and patient data, it could obtain more accurate transformation than directly registering TAL space and patient data together.
In the registration process, affine registration is chosen in this task for time-efficiency sake and avoiding unexpected distortion caused by inaccurate deformation in certain regions.41–43 The [Fig. 3(a)] shows the original skull-stripped images and the [Fig. 3(b)] is the MNI template used for registration. The deformable registration results and the affined registration results are shown in the [Figs. 3(c) and 3(d)] respectively. The deformable registration could cause deformation of the brain tissue, as shown in this case (marked in the red box in the [Fig. 3(c)]). Although the deformable method can better fit the individual images into the template regarding the overall size and shape, the internal distortion can cause more unexpected errors when finding the atlas locations of each segmentation.
FIG. 3.
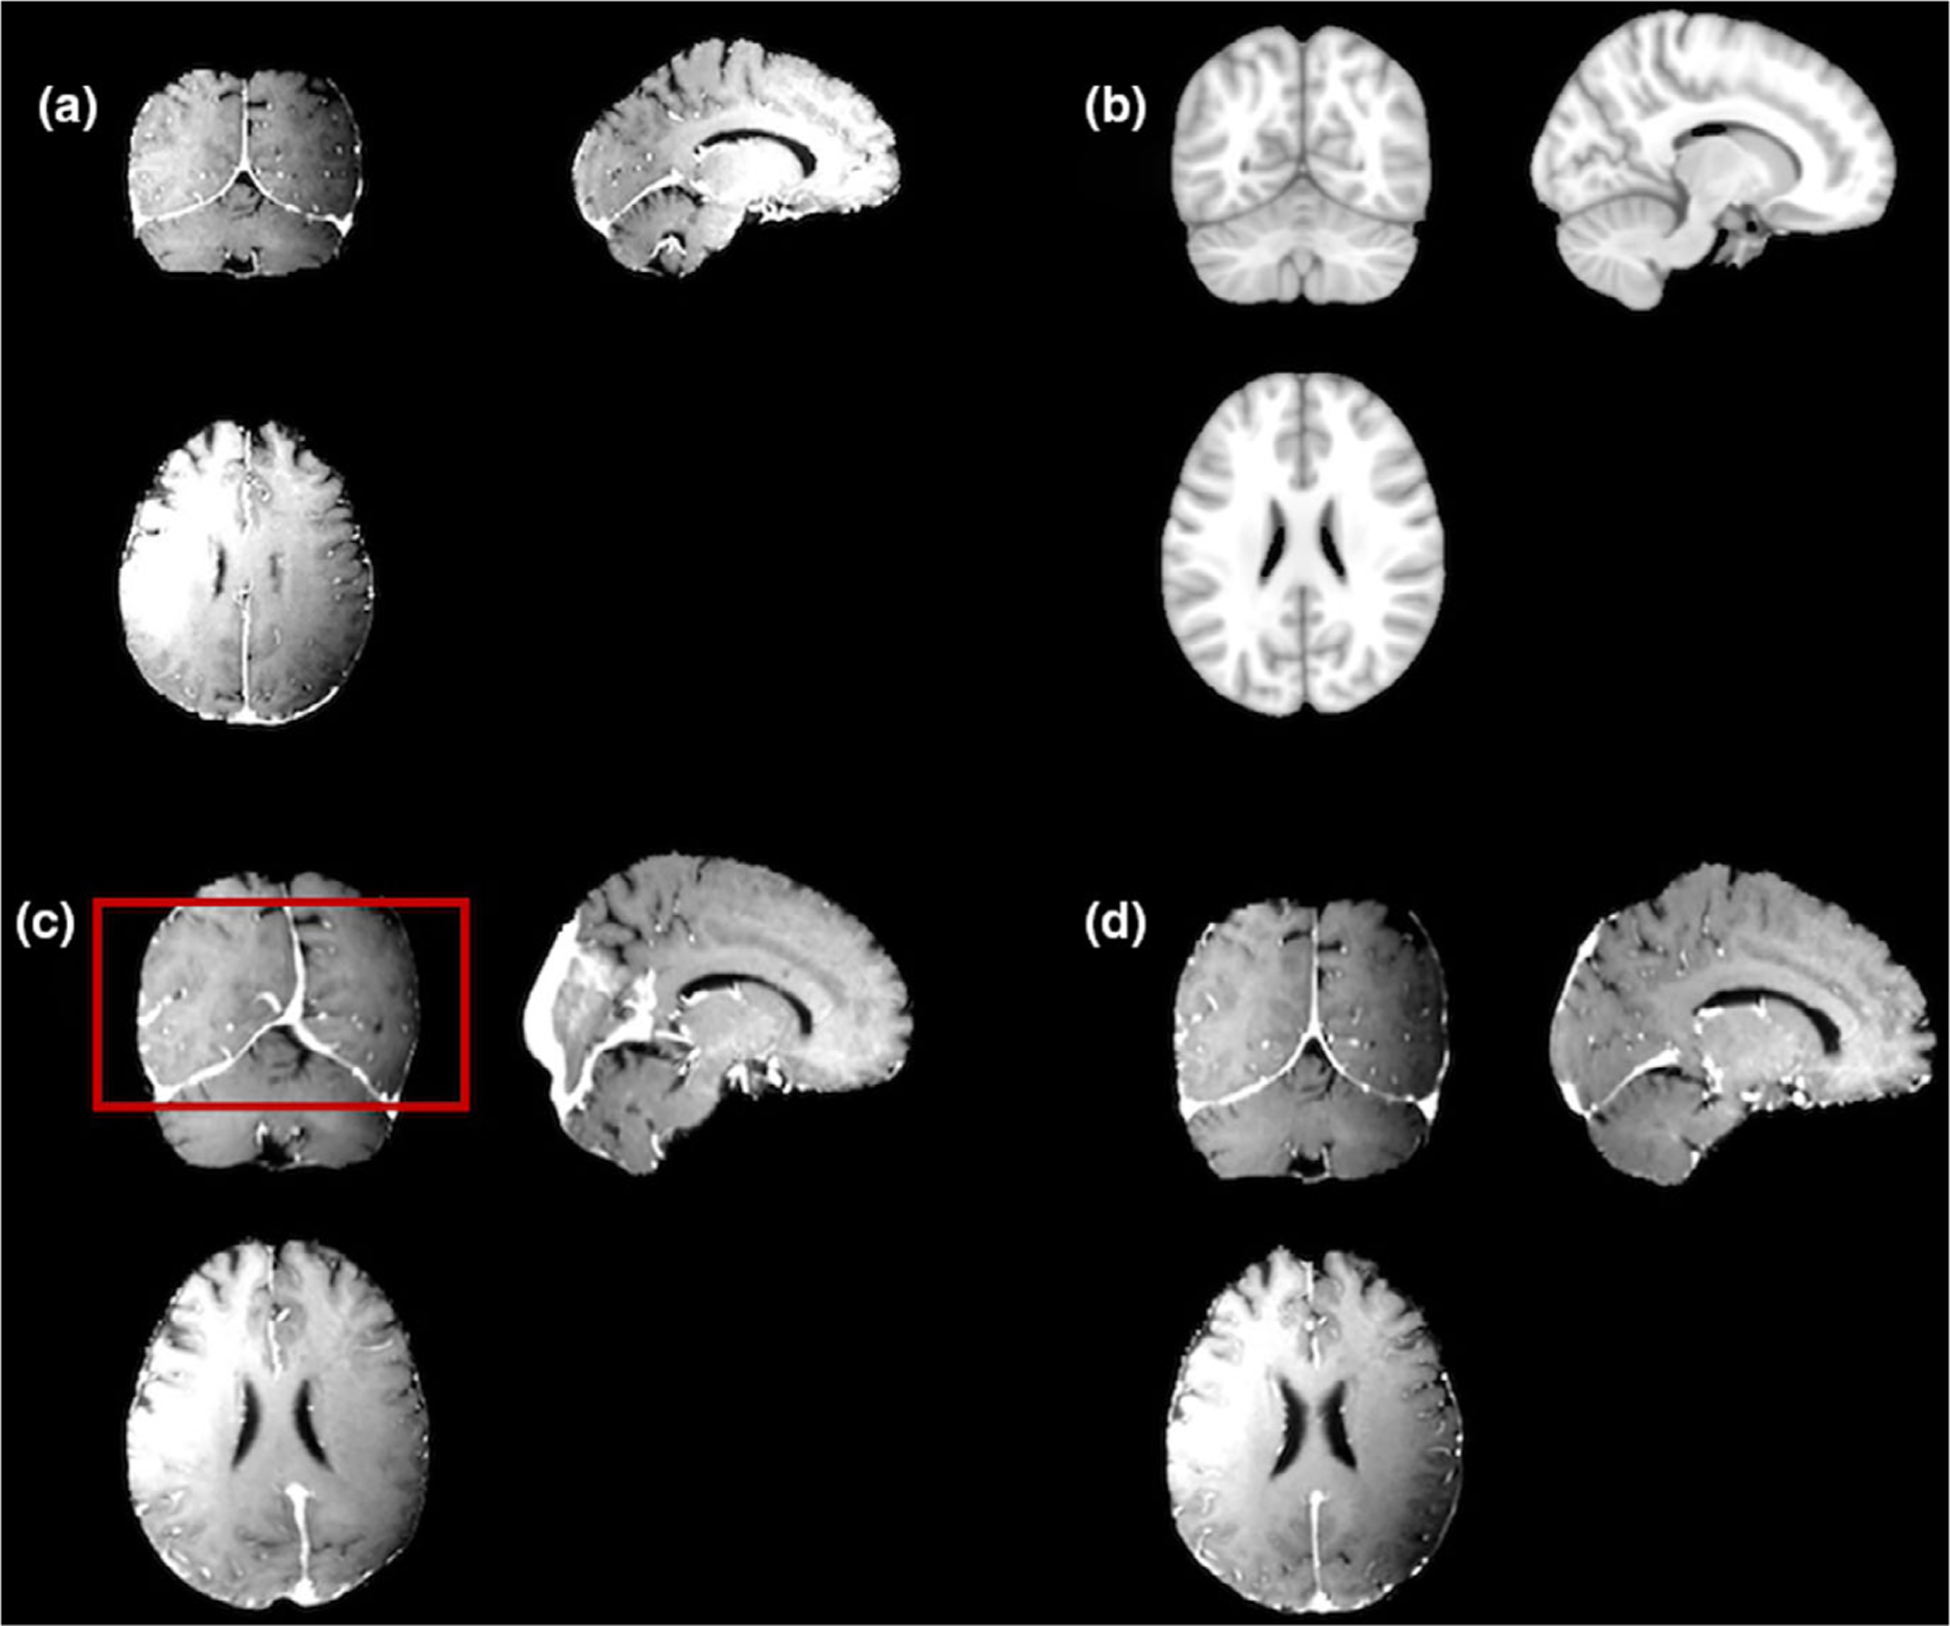
A comparison of the affine registration and deformable registration results: (a) a sample patient T1c images; (b) the target MNI template; (c) the deformable registration result; (d) the affine registration result.
Figure 4 demonstrates the workflow for the automated BMs labeling strategy. The overall labeling process can be summarized as:
FIG. 4.

The workflow of the automatic BMs labeling process.
Register the original T1c image to the MNI standard space via affine registration to obtain the transformation matrix T1, while the transformation T0 between MNI atlas and the TAL atlas is already known;40
Register the segmentation to the TAL atlas utilizing the transformation matrix T1* T0;
Find the center of mass (COM) of each BMs segmentation in the TAL coordinate system;
For every BMs, find the corresponding atlas label of the COM coordinates in the TAL atlas;
For the BMs with the same atlas locations, sort and number each contour based on the COM location in the superior-inferior direction; For contours failed in finding a label, name and number each contour as ‘tumor 1’ to ‘tumor N’.
When the BMs labeling process is completed, the web client will display the BMs segmentation with atlas labels listed for reviewing.
2.C.3. Postprocessing/ False-positive removal
The BMs segmentation algorithm implemented in this platform is sensitive to intensity variations in the T1c images.31 Thus, the segmentation result might contain false-positive contours in the superior sagittal sinus or other confluences of sinuses, which contains the flow contrast agent and presents high intensity in the images.
However, the BMs and the cranial sinuses hold different geometric characteristics. Specifically, BMs treated in SRS usually have small volumes and rounded shapes, whereas the segmented sinuses present more irregularity in the shape. To quantify this irregularity, we adopt the sphericity metric calculated by the volume of convergence and the surface area of volume to evaluate each segmentation’s geometric characteristics.44,45 Thus, a false-positive removal strategy has been made and applied in this platform by using user-defined sphericity and radius thresholds to exclude the false-positive segmentations. As is shown in the [Fig. 2(c)], users can remove the irregular segmentation which has the sphericity smaller than the desired threshold or which has a radius larger than the desired threshold. The range of the sphericity threshold is set as from 1 to 5, and the selectable range for the tumor radius threshold can be from 0.0 to 20.0 mm.17 This planform provides another postprocessing function for better viewing experience, where users can remove or recover the corresponding BM segmentation, respectively, by checking or unchecking the tumor atlas label listed in the interface [Fig. 2(d)].
Once after the postprocessing and the users are satisfied with the results, the segmentation results can be exported for planning and stored in the database for the treatment follow-up.
3. RESULTS
3.A. Demo case
The Fig. 5 and Fig. 6 shows one demo case using patient data, with 50 BMs to demonstrate the detailed implementation of this platform. Once the users import the images and choose the segmentation function in the menu, the platform will begin the segmentation task and then display the results as well as the tumor labels in the web client. This whole process will take about 4–5 minutes.
FIG. 5.
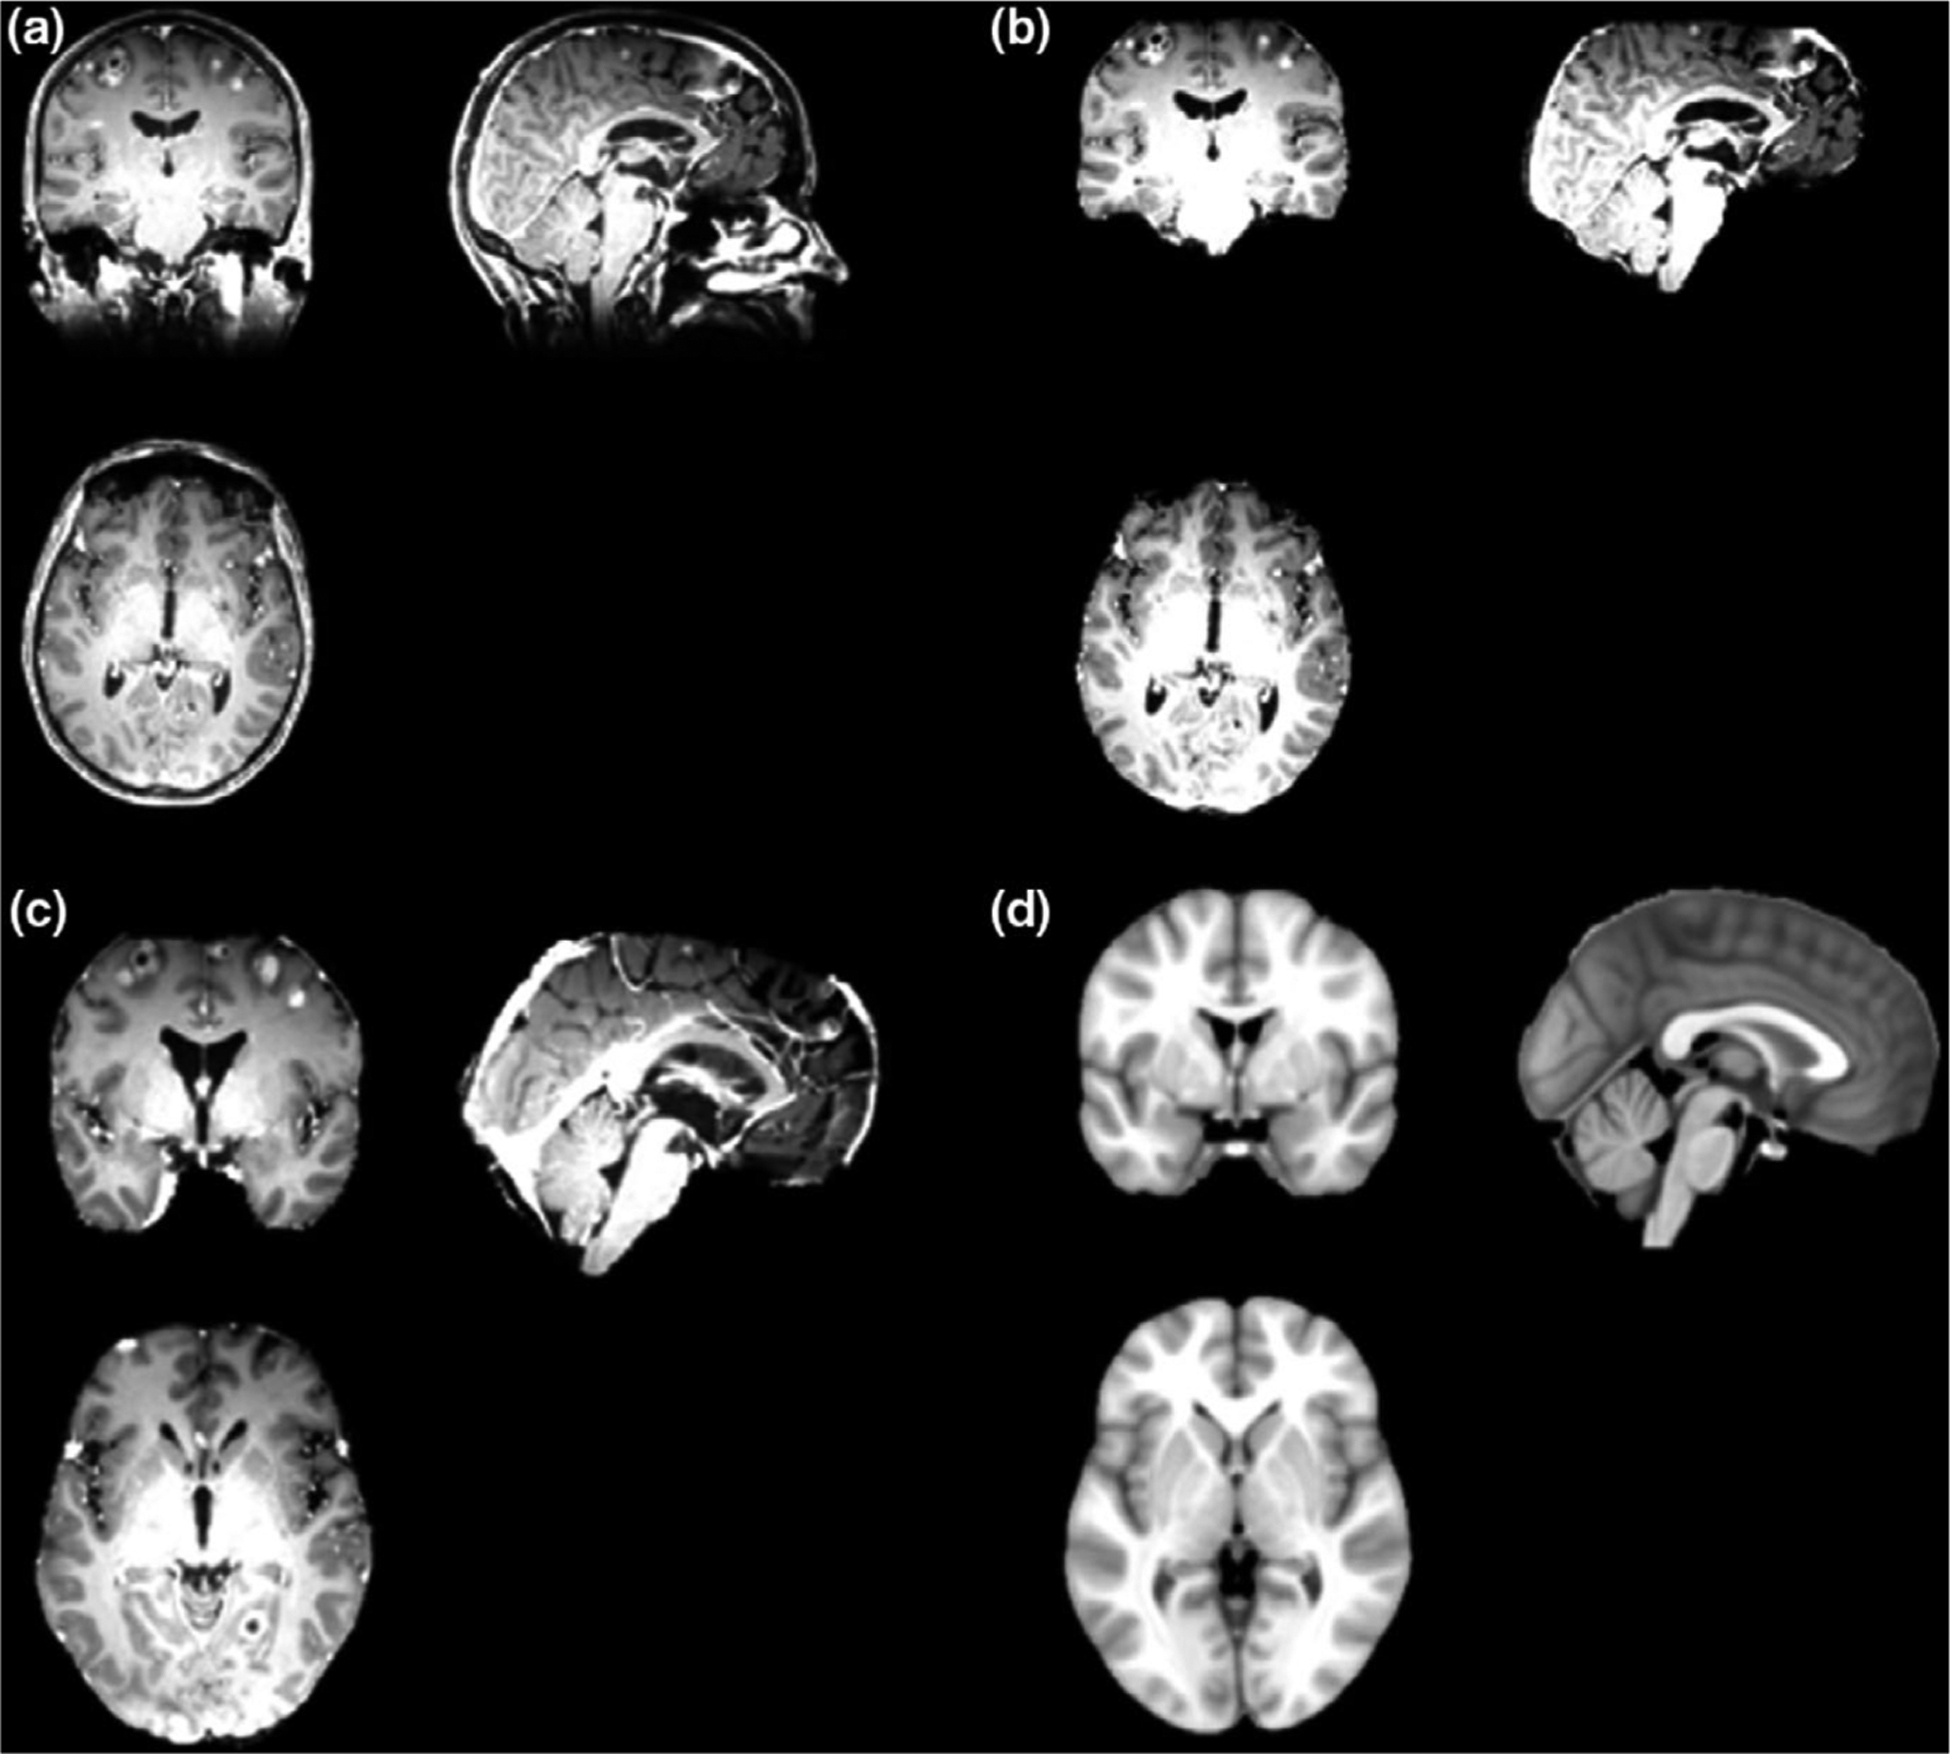
Demo case of the skull stripping and affine registration process: (a) a sample patient MRI images as original input; (b) skull-stripped images after preprocessing; (c) images after affine registration; (c) the MNI template in affine registration.
FIG. 6.
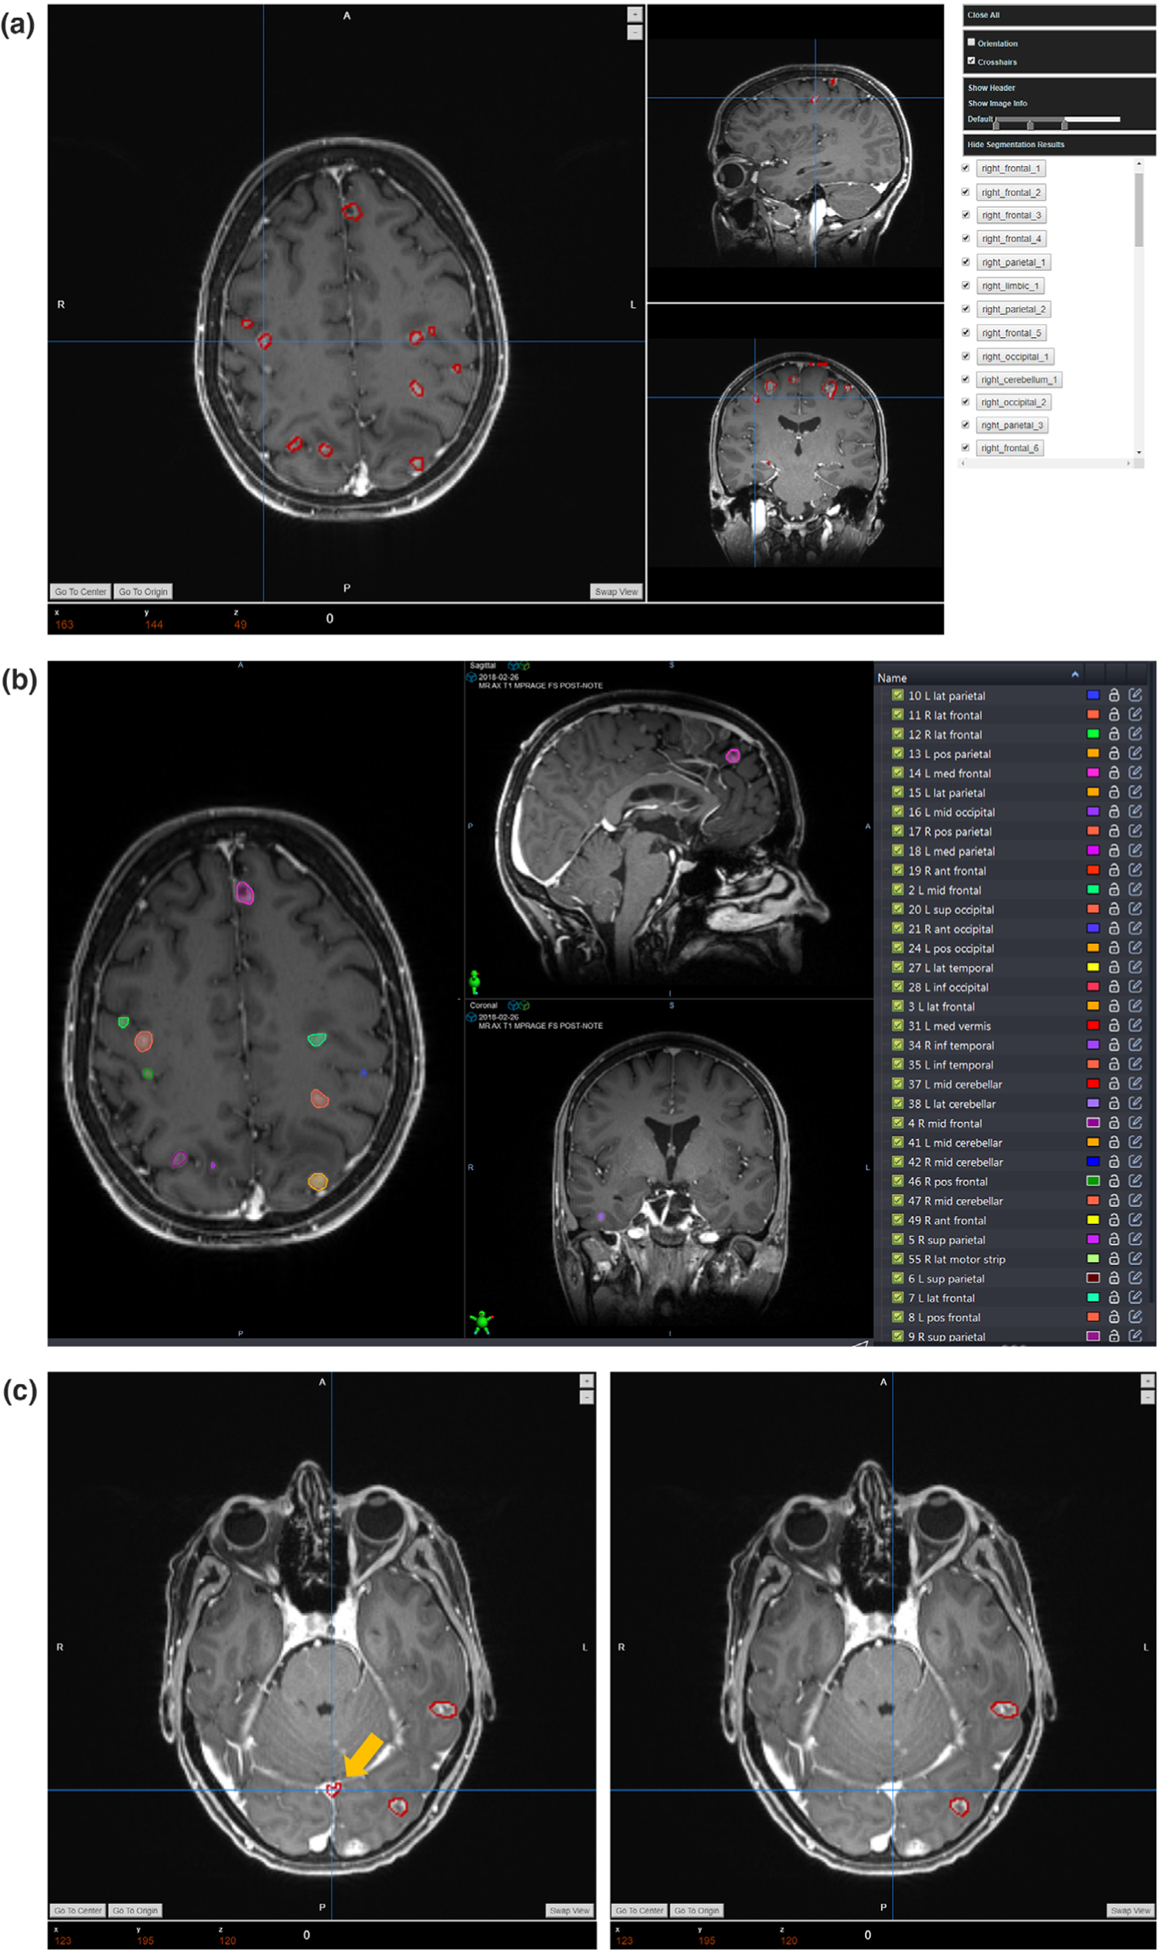
Demo case of the segmentation and postprocessing results: (a) the initial segmentation and labeling results; (b) the corresponding manual clinical contour; (c) illustration of the false-positive removal process.
The [Fig. 5(a)] shows the original DICOM image as the input and [Fig. 5(b)] displays the skull-stripped images after the preprocessing procedure and transformed into the Nifti format. This skull-stripping step will be conducted as the first step in the segmentation step. Then the skull-stripped image will be utilized in the segmentation and labeling algorithms. As is described in the section 2.C.2, in the labeling process, the patient data will be affine-registered into the MNI template for finding the atlas location of each BMs. Figure 5(c) demonstrate the registration results compared with the target MNI template in [Fig. 5(d)].
The initial segmentation results with corresponding atlas labels will be displayed in the interface as is shown in the [Fig. 6(a)] for review. For this demo patient data, this platform segments out 61 segmentations in total, which are all listed in the tumor list with the atlas labels. For a rough comparison, the manual contour is also displayed in the [Fig. 6(b)]. However, the initial results might contain false-positive segmentations. After the review, users can choose the postprocessing function in the menu to remove the false-positive results. In this demo case, we set the removal threshold in this function as the sphericity no smaller than four or the radius no larger than 5 mm. The [Fig. 6(c)] demonstrates the performance of this removal strategy, in which the left side is the initial segmentation, and the right side presents the results after the postprocessing. It can be found that the false positive segmentation of one sinus, pointed by the yellow arrow, is removed from the results while maintaining other true-positive BMs segmentations. After this false-positive removal processing, 42 segmentations are kept considering as the true segmentations for the following manual review.
3.B. Segmentation accuracy
We evaluated the segmentation accuracy of this platform in 10 patient data with number of mBMs varying from 12 to 81. Six different evaluation metrics are implemented to assess the performance: center-of-mass-shift (COMS), Hausdorff distance (HD), the mean and the standard deviation of surface to surface distance (SSD), false positive over union (FPoU), and false negative rate (FNR). In all these evaluation metrics, manual segmentation is used as ground truth.
COMS represents the shift of the tumor center; ideally it will become 0 when the segmentation result is perfectly matched with the ground truth contour. It can be estimated by the formula below:
| (1) |
where Δx, Δy, and Δx is the center-of-mass distance from the tumor volume in auto-segmentation to the tumor volume in the ground truth contour.
HD measures the greatest value of all the distances from a point on one contour set to the closest point on the other contour set. It can be calculated by the formula below:
| (2) |
| (3) |
where the SA represents the auto segmentation surface, and the SGT represents the surface of the ground truth clinical contour. The terms pA and pGT are the points in the set SA and SGT respectively.
SSD measures the shortest Euclidean distance between two known surfaces. In this assessment, we calculate the mean value of the SSD (MSSD) and the standard deviation of the SSD (SDSSD) between the auto-segmentations and the ground truth contours to evaluate the accuracy. The term d(pA; SGT) in Equation (4) represents the shortest Euclidean distance from a point in the segmentation contour to the ground truth contour surface:
| (4) |
| (5) |
| (6) |
In addition to the above four metrics, the false-positive over Union (FPoU) and the false-negative rate (FNR) of the auto-segmentation before and after the postprocessing are also evaluated to demonstrate the accuracy of this segmentation platform:
| (7) |
| (8) |
where the FPoU is calculated by the ratio of the number of false-positive BMs segmentations over the total number of BMs from auto-segmentation and ground truth. And the FNR is calculated as the ratio of the number of unsegmented BMs by auto-segmentation over the total number of BMs in the ground truth.
The evaluation results for 10 patient data are listed in the Table II. The postprocessing is conducted by setting personalized removal threshold to minimize the FPoU while keeping the FNR unchanged for each subject. ‘Pre-’ in Table II represents the original metrics before the postprocessing. And ‘Post-’ represents the evaluation of results after the false-positive removal process. The values of these metrics are acceptable and demonstrate that this platform can accurately segment the BMs with small error. Details regarding these quantitative results will be discussed in the following discussion section.
TABLE II.
Quantitative evaluation of the segmentation accuracy.
| Patient | Number of BMs | COMS/mm | HD/mm | MSSD/mm | SDSSD/mm | Pre-FNR | Pre-FPoU | Post-FNR | Post-FPoU |
|---|---|---|---|---|---|---|---|---|---|
| 1 | 19 | 0.89 | 1.86 | 0.60 | 0.56 | 0.21 | 0.32 | 0.21 | 0.17 |
| 2 | 12 | 1.47 | 2.67 | 0.90 | 0.96 | 0.08 | 0.70 | 0.08 | 0.25 |
| 3 | 23 | 1.53 | 3.20 | 1.39 | 0.77 | 0.04 | 0.68 | 0.04 | 0.34 |
| 4 | 15 | 1.84 | 3.99 | 0.99 | 1.11 | 0.00 | 0.63 | 0.00 | 0.29 |
| 5 | 40 | 1.62 | 2.97 | 0.96 | 0.76 | 0.08 | 0.42 | 0.08 | 0.22 |
| 6 | 16 | 1.49 | 3.42 | 1.57 | 0.81 | 0.13 | 0.47 | 0.13 | 0.30 |
| 7 | 30 | 1.01 | 2.13 | 0.67 | 0.59 | 0.20 | 0.30 | 0.20 | 0.09 |
| 8 | 54 | 1.98 | 3.42 | 1.34 | 0.87 | 0.22 | 0.17 | 0.22 | 0.08 |
| 9 | 50 | 1.91 | 3.22 | 1.09 | 0.82 | 0.30 | 0.34 | 0.30 | 0.12 |
| 10 | 81 | 1.72 | 2.96 | 1.13 | 0.79 | 0.26 | 0.23 | 0.26 | 0.07 |
| Mean(SD) | 34 ± 22 | 1.55 ± 0.36 | 2.98 ± 0.63 | 1.06 ± 0.31 | 0.80 ± 0.16 | 0.15 ± 0.10 | 0.43 ± 0.19 | 0.15 ± 0.10 | 0.19 ± 0.10 |
3.C. Labeling accuracy
We evaluate the labeling accuracy by comparing the physician’s manual labels with the automatically generated atlas labels on 10 patients. Figure 7 compares the manual and auto-generated labels in one demo case for qualitative evaluation. Note that the order of the labels in these two lists is not the same. This labeling result is from the same patient data demonstrated in the Section 3.A. We can find that these auto-generated labels are in consistence with the manual labels in a similar fashion. The quantitative evaluation regarding the accuracy of the BMs labels in these 10 patient data are listed in the Table III. A case will be considered as correct if not only the BMs get assigned with a label, but also the label can accurately reflect the location of the BMs. For example, though the BMs labeled as ‘right_frontal_6’ in the platform (red box in [Fig. 7(a)]) was named as ‘R lat motor strip’ by physician (red box in [Fig. 7(b)]), we still consider this case as correct since the motor strip is located at the frontal lobe.
FIG. 7.
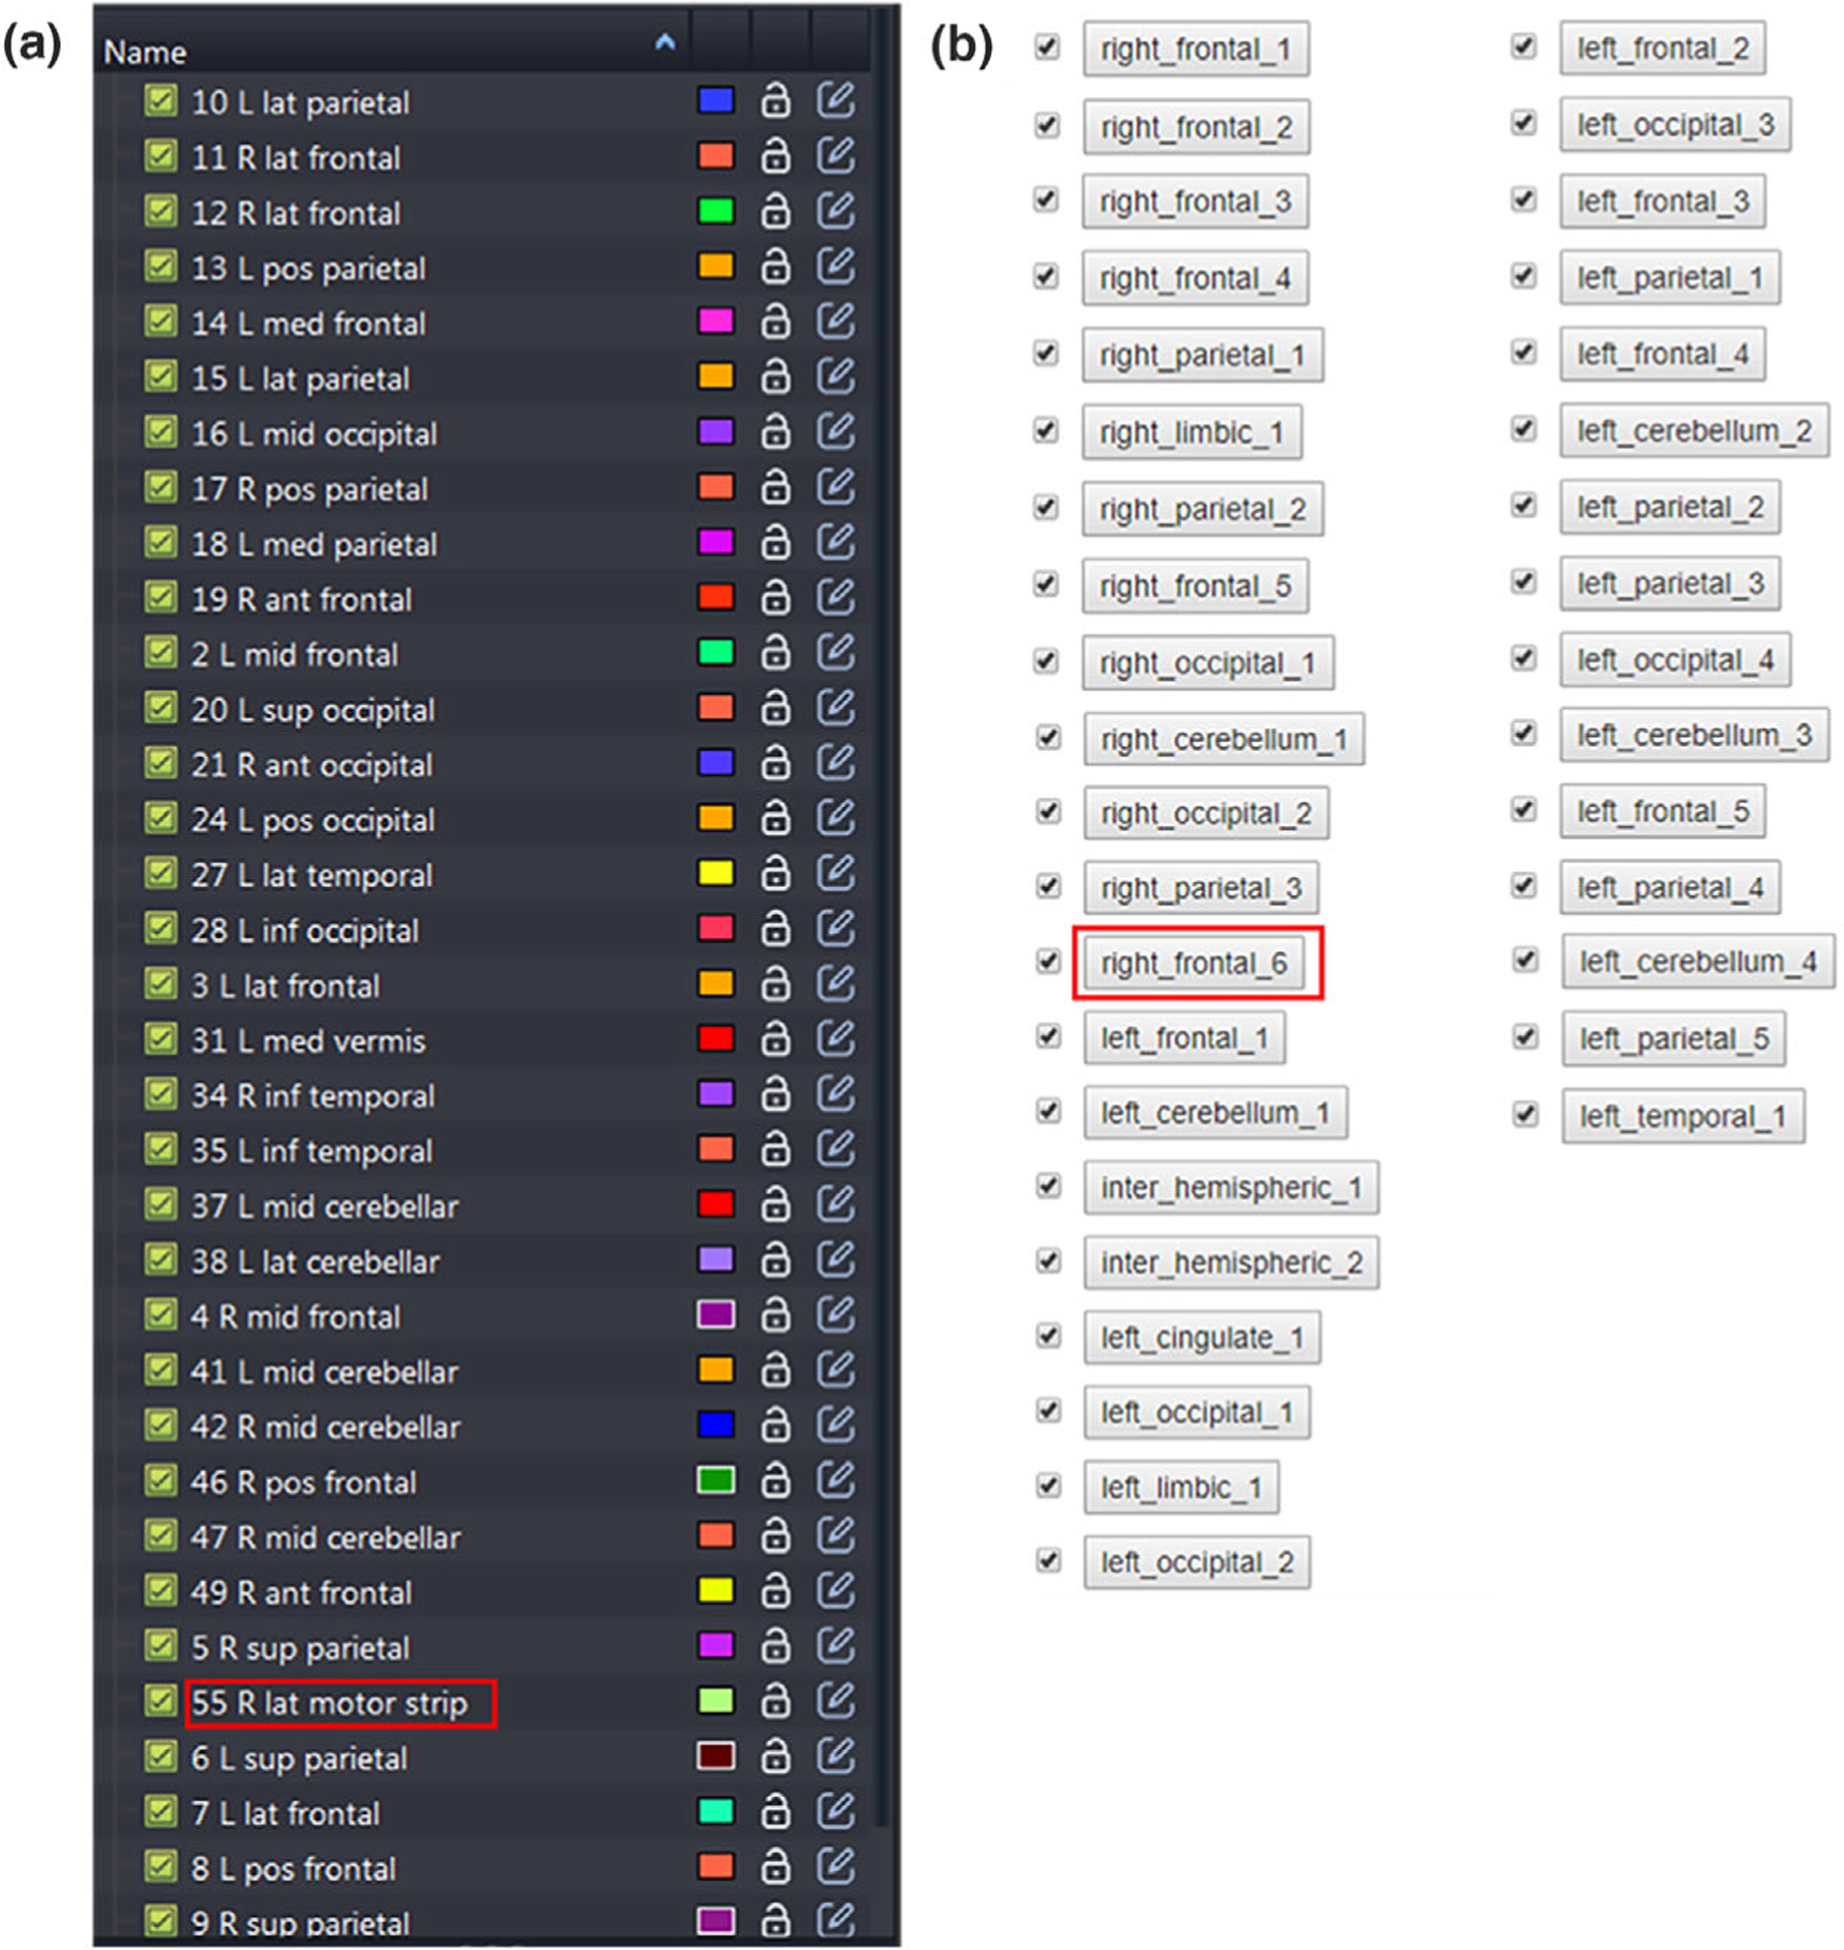
A comparison of (a) the manual atlas labels and (b) the auto atlas labels.
TABLE III.
Quantitative evaluation of the labeling accuracy.
| Patient | Number of BM with labels | Number of BMs without labels | Label accuracy (%) |
|---|---|---|---|
| 1 | 15 | 0 | 100 |
| 2 | 11 | 0 | 100 |
| 3 | 22 | 0 | 100 |
| 4 | 14 | 1 | 100 |
| 5 | 34 | 3 | 100 |
| 6 | 14 | 0 | 100 |
| 7 | 23 | 1 | 100 |
| 8 | 40 | 2 | 100 |
| 9 | 33 | 2 | 100 |
| 10 | 57 | 3 | 100 |
| Mean | 26 ± 15 | 1 ± 1 | 100 |
4. DISCUSSION
In this work, we developed and evaluated a web-based brain metastases segmentation and labeling platform with interactive postprocessing and evaluation functions. Based on the qualitative and quantitative evaluation, this platform performs well on the patient data with great consistency compared with the physicians’ manual contours and labels.
From the demo case demonstrated in the section 3.A, it can be found qualitatively that our platform can accurately segment mBMs and label them based on their corresponding locations. The auto-segmentations and labels match well with the clinical contours and clinical labels. For the quantitative evaluation, as is shown in the Table II, our platform can accurately segment the BMs from T1c images with a mean COMs of 1.55 ± 0.36 mm, a mean HD of 2.98 ± 0.63 mm, and a mean MSSD and SDSSD of 1.06 ± 0.31 mm and 0.80 ± 0.16 mm, respectively, among these 10 clinical patient data contain mBMs from 12 to 81. These values demonstrate that our auto-segmentation results are all acceptable and are in great consistency with the clinical contours. This platform can handle various clinical cases with different number of mBMS and still keeps good accuracy and sensitivity. In addition to the accuracy and sensitivity, the time takes for this platform to segment and label one patient data is as fast as 4 min. Compared with the manual contouring which usually takes 30 min or more, this platform will bring time saving in the clinical practice. Besides, the overall design of this platform is simple and easy to use. It incorporates various functions for the follow-up comparison, DICOM header information display, window level adjustment, etc., which are helpful regarding the user experience and can help to improve the overall workflow efficiency. In future work, we will develop some tools to allow users to access the quality of segmentation results to facilitate independent algorithms evaluation, and further improve the platform based on users’ feedback. This platform has only been validated for internal usage within our institution as the segmentation model was trained with our internal dataset. As a future work to extend the application into external institutions and sites, further investigation and validation is needed to ensure the robustness among patient data with varied scanners and protocols.
From Table II, we can find that the averaged FPoU of the segmentation is 0.43 ± 0.19, and the averaged FNR is 0.15 ± 0.10 for the tested 10 patient data. Both of metrics are calculated based on the initial results without applying the postprocessing implemented in the platform. After the postprocessing with the personalized case-specific removal thresholds, the averaged FPoU becomes 0.19 ± 0.10 demonstrating the effectiveness of this false-positive removal strategy, with the averaged FNR kept unchanged as 0.15 ± 0.10.
We notice that the main causes of the most false-positive cases are the inaccurate skull-stripping as well as the influence of cranial sinuses. Fig. 8 shows some examples of the false-positive cases. From the [Fig. 8(a)] we can find that the false positive contours are all located at the places with the appearance of the venous sinuses. Since the image modality utilized in this platform is the T1c images, the injected contrast agents can cause the veins becoming bright in the images, thus further causing the false-positive segmentations. In addition to the blood vessel, the imperfect skull-stripping can also lead to the false-positive segmentations. As is shown in the [Fig. 8(b)], the left image is the skull-stripping results. In the red box of this image, the truncated pattern indicates the errors caused by the skull removal process. And the right image in the [Fig. 8(b)] shows the corresponding false-positive segmentations caused by this imperfect removal. As pointed by the yellow arrow, the false-positive result appears at the slice where the brain tissue is truncated by the skull-stripping process. In this platform, we have introduced a false-positive removal function by setting threshold in the geometry characteristics, since the veins and the BMs usually present differently in shape and volume. Although this criteria can largely improve the overall false-positive rate, it is not robust enough to precisely distinguish the BMs and the false-positive results. As a future plan, we will improve the segmentation algorithm by incorporating the brain vessels regional information to further reduce the false-positive rate. As for the skull-stripping procedure, our platform currently implements the algorithm ROBEX,35 which is widely used in the neuroscience research. However, our standard MRI data modality in SRS treatment is T1c, in which the veins under the skull will displays as bright compared with standard T1 images. To remove the wrong segmentation caused by skull-stripping, we will develop a skull-stripping method targeting in the T1c modality in the future.
FIG. 8.
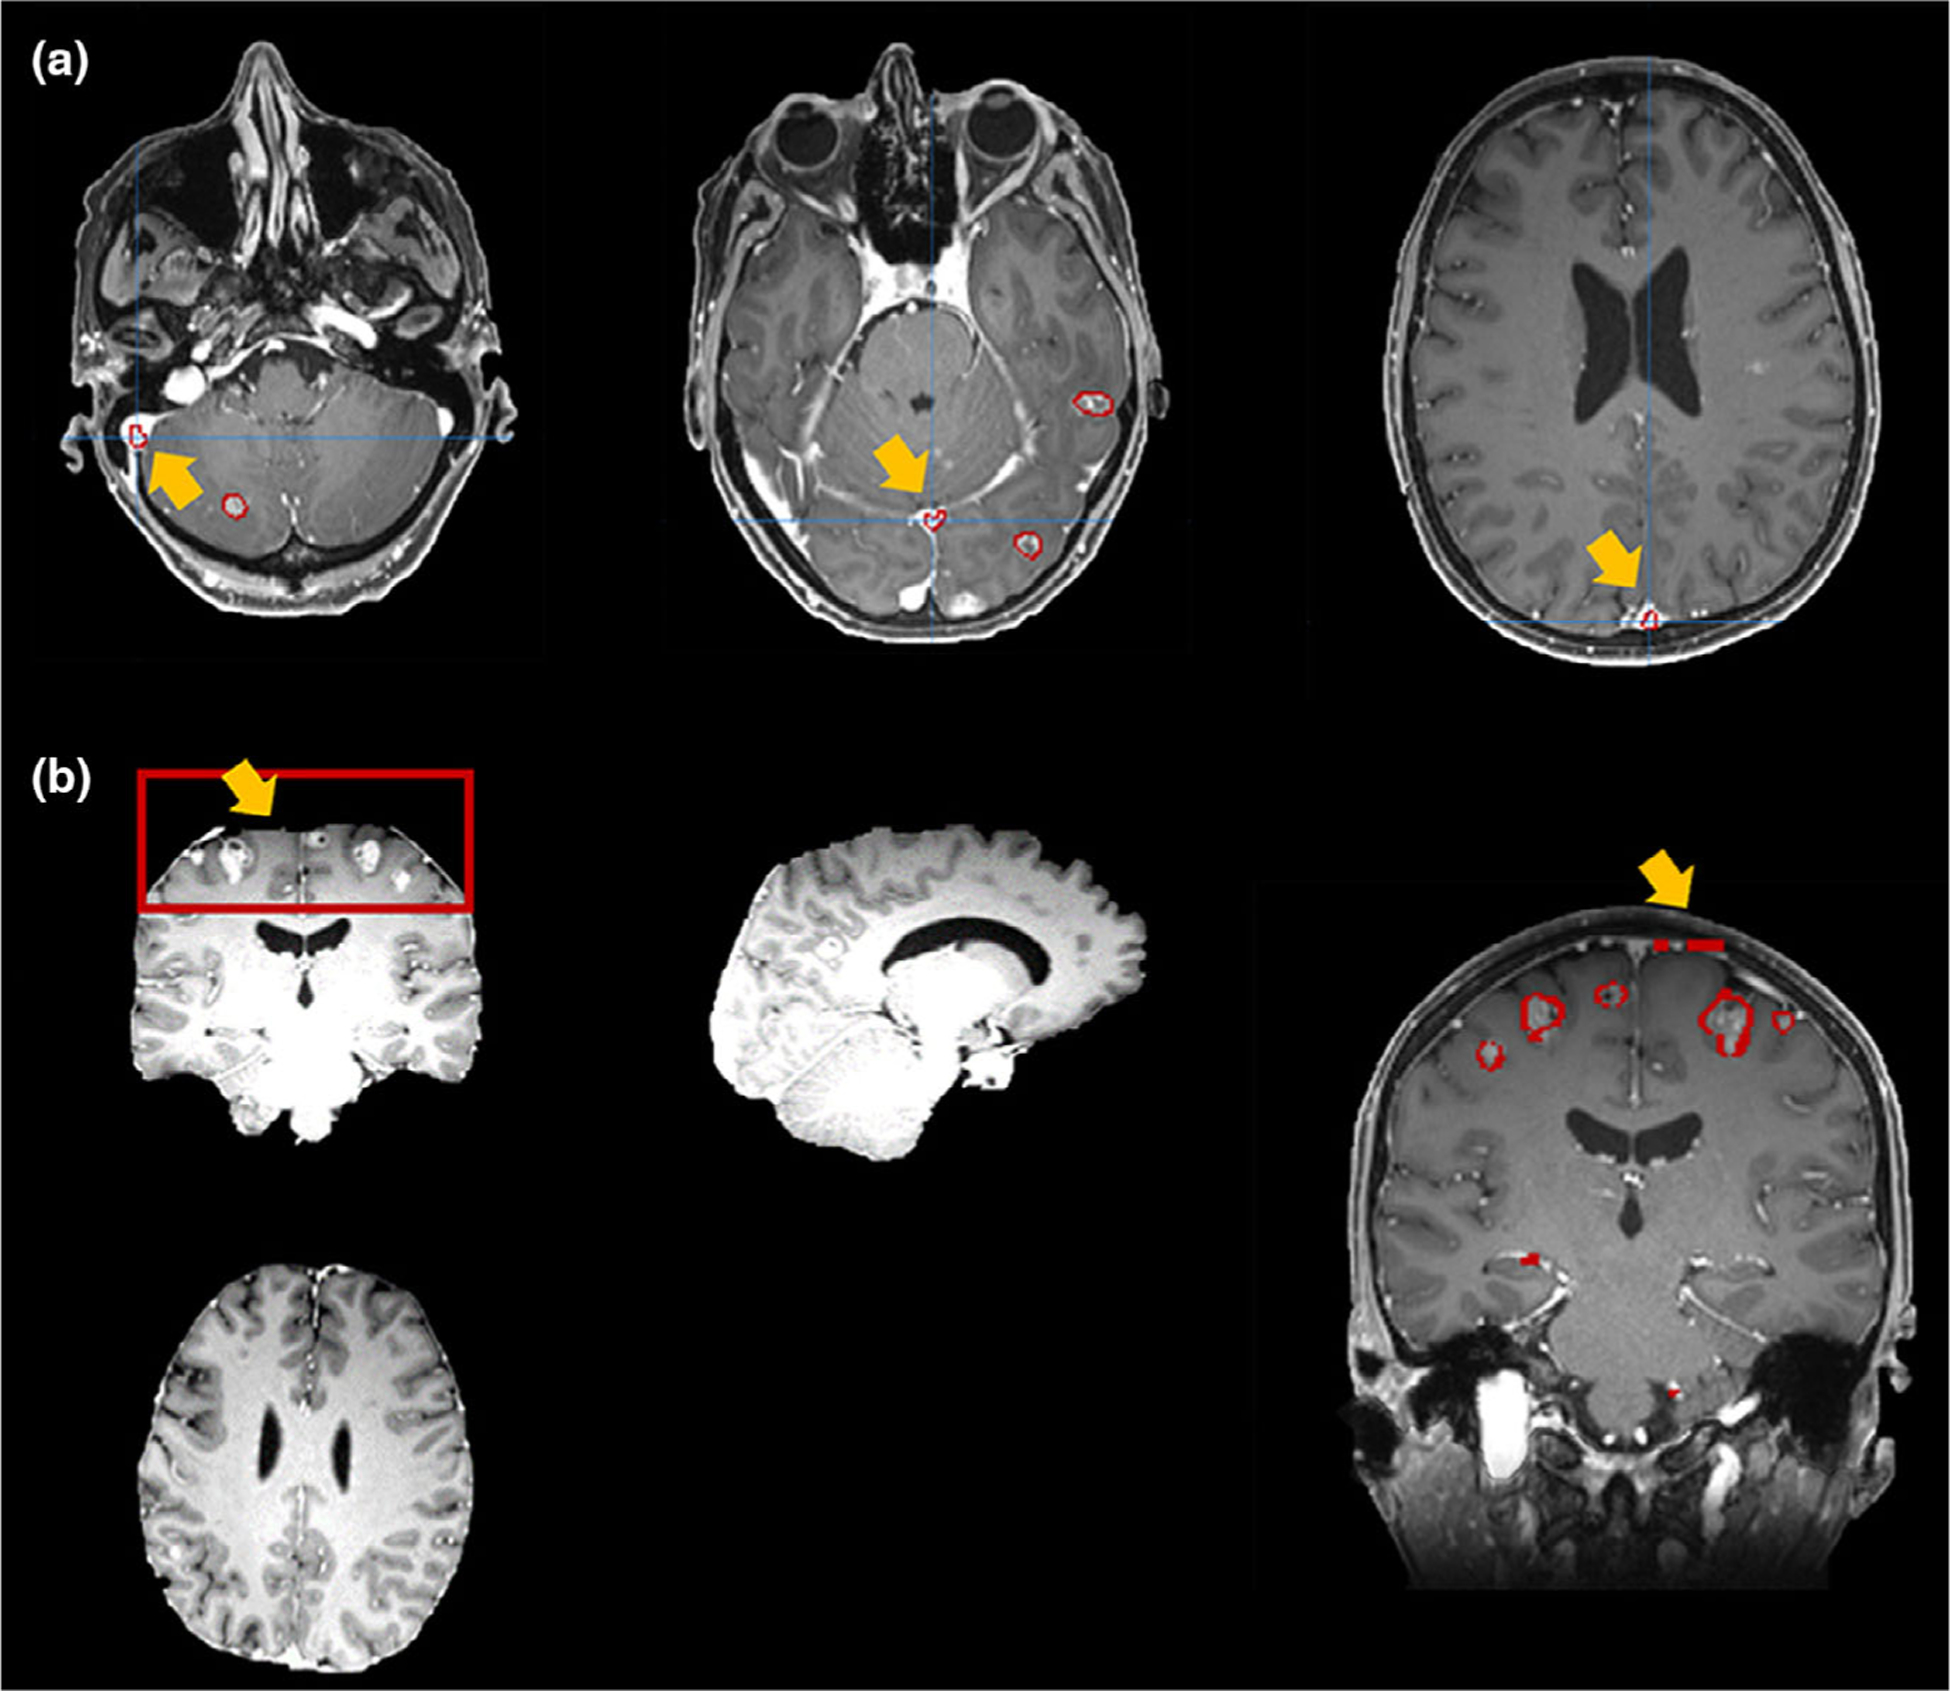
Examples of false-positive segmentations caused by: (a) cranial sinuses; (b) imperfect skull-removal.
The false-negative rate or the tumor detectability of our platform is mainly influenced by the low contrast and small volumes. The segmentation algorithm implemented in this platform is a deep-learning based voxel-wise classification strategy, which utilizes both local and global image features.31 If a metastases only contains few voxels and presents a low contrast with the neighboring tissue, this network might fail to classify it as tumor based on its relationship between neighboring voxels. For the cases shown in the Fig. 9, these BMs marked by yellow arrows have a small volume with low contrast, thus causing the failure in segmentation. In addition to the contrast and volume, one possible reason for the undetected BMs is that our training data of the segmentation model and the testing data used in this platform have different imaging protocols. One solution could be including new protocol data into the training data set to improve the accuracy. More practical solution will be developing a transfer learning module to handle different protocol data, thus the platform can have the mobility to be adopted by other institutions using different imaging protocols.
FIG. 9.
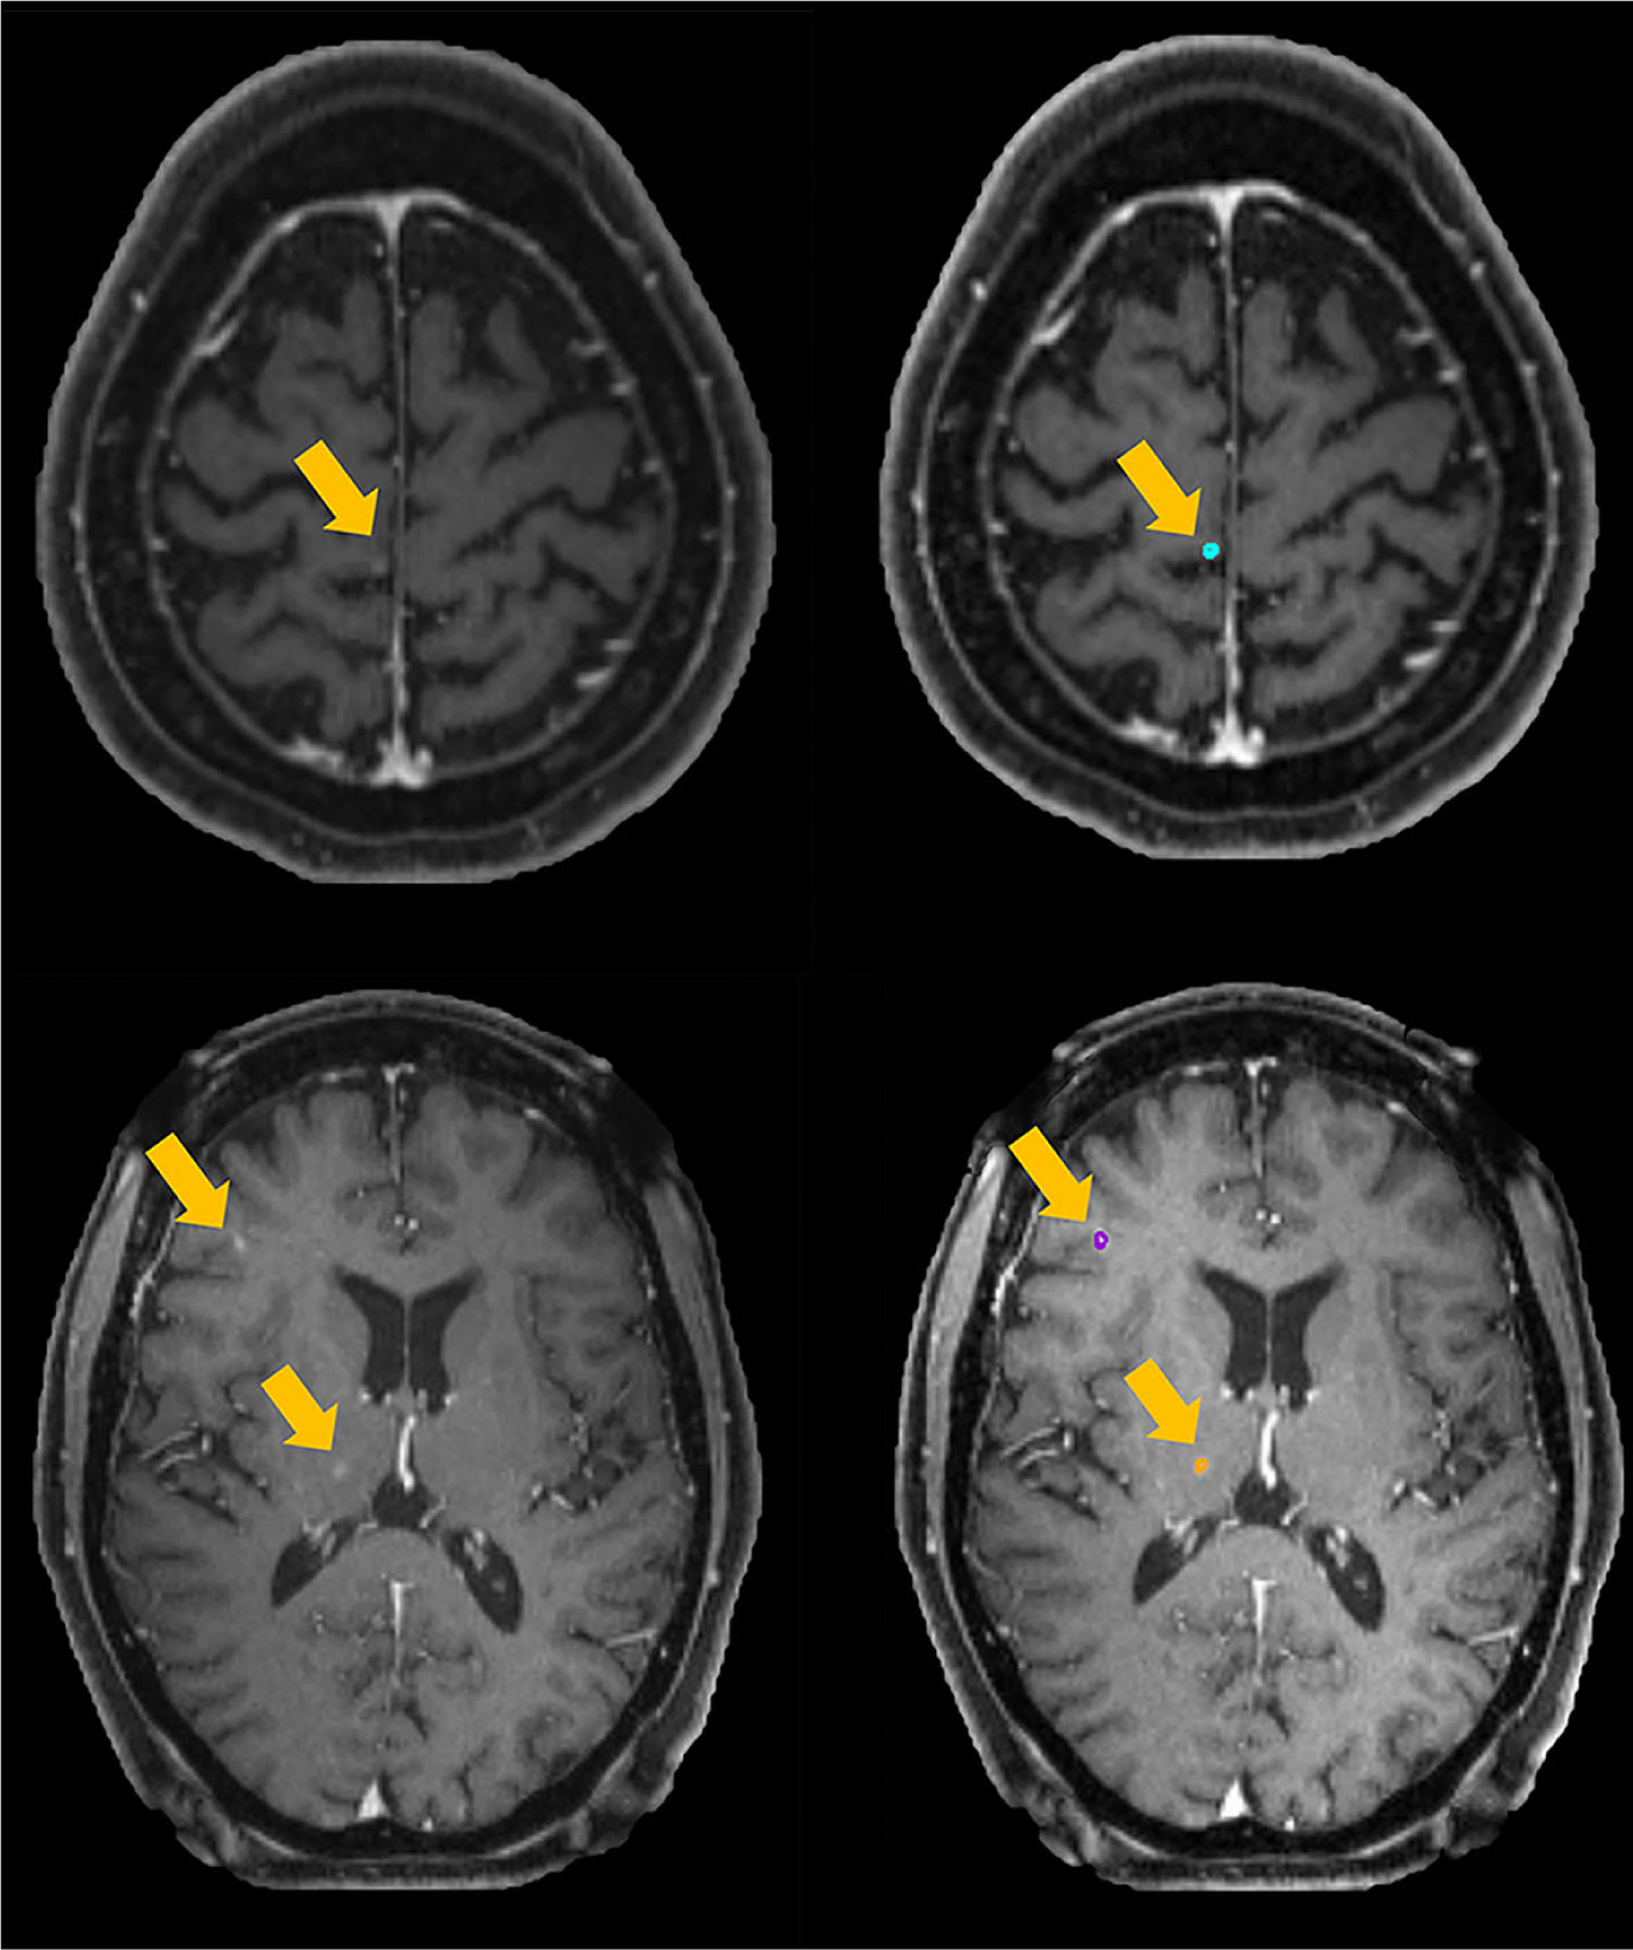
Examples of false-negative results.
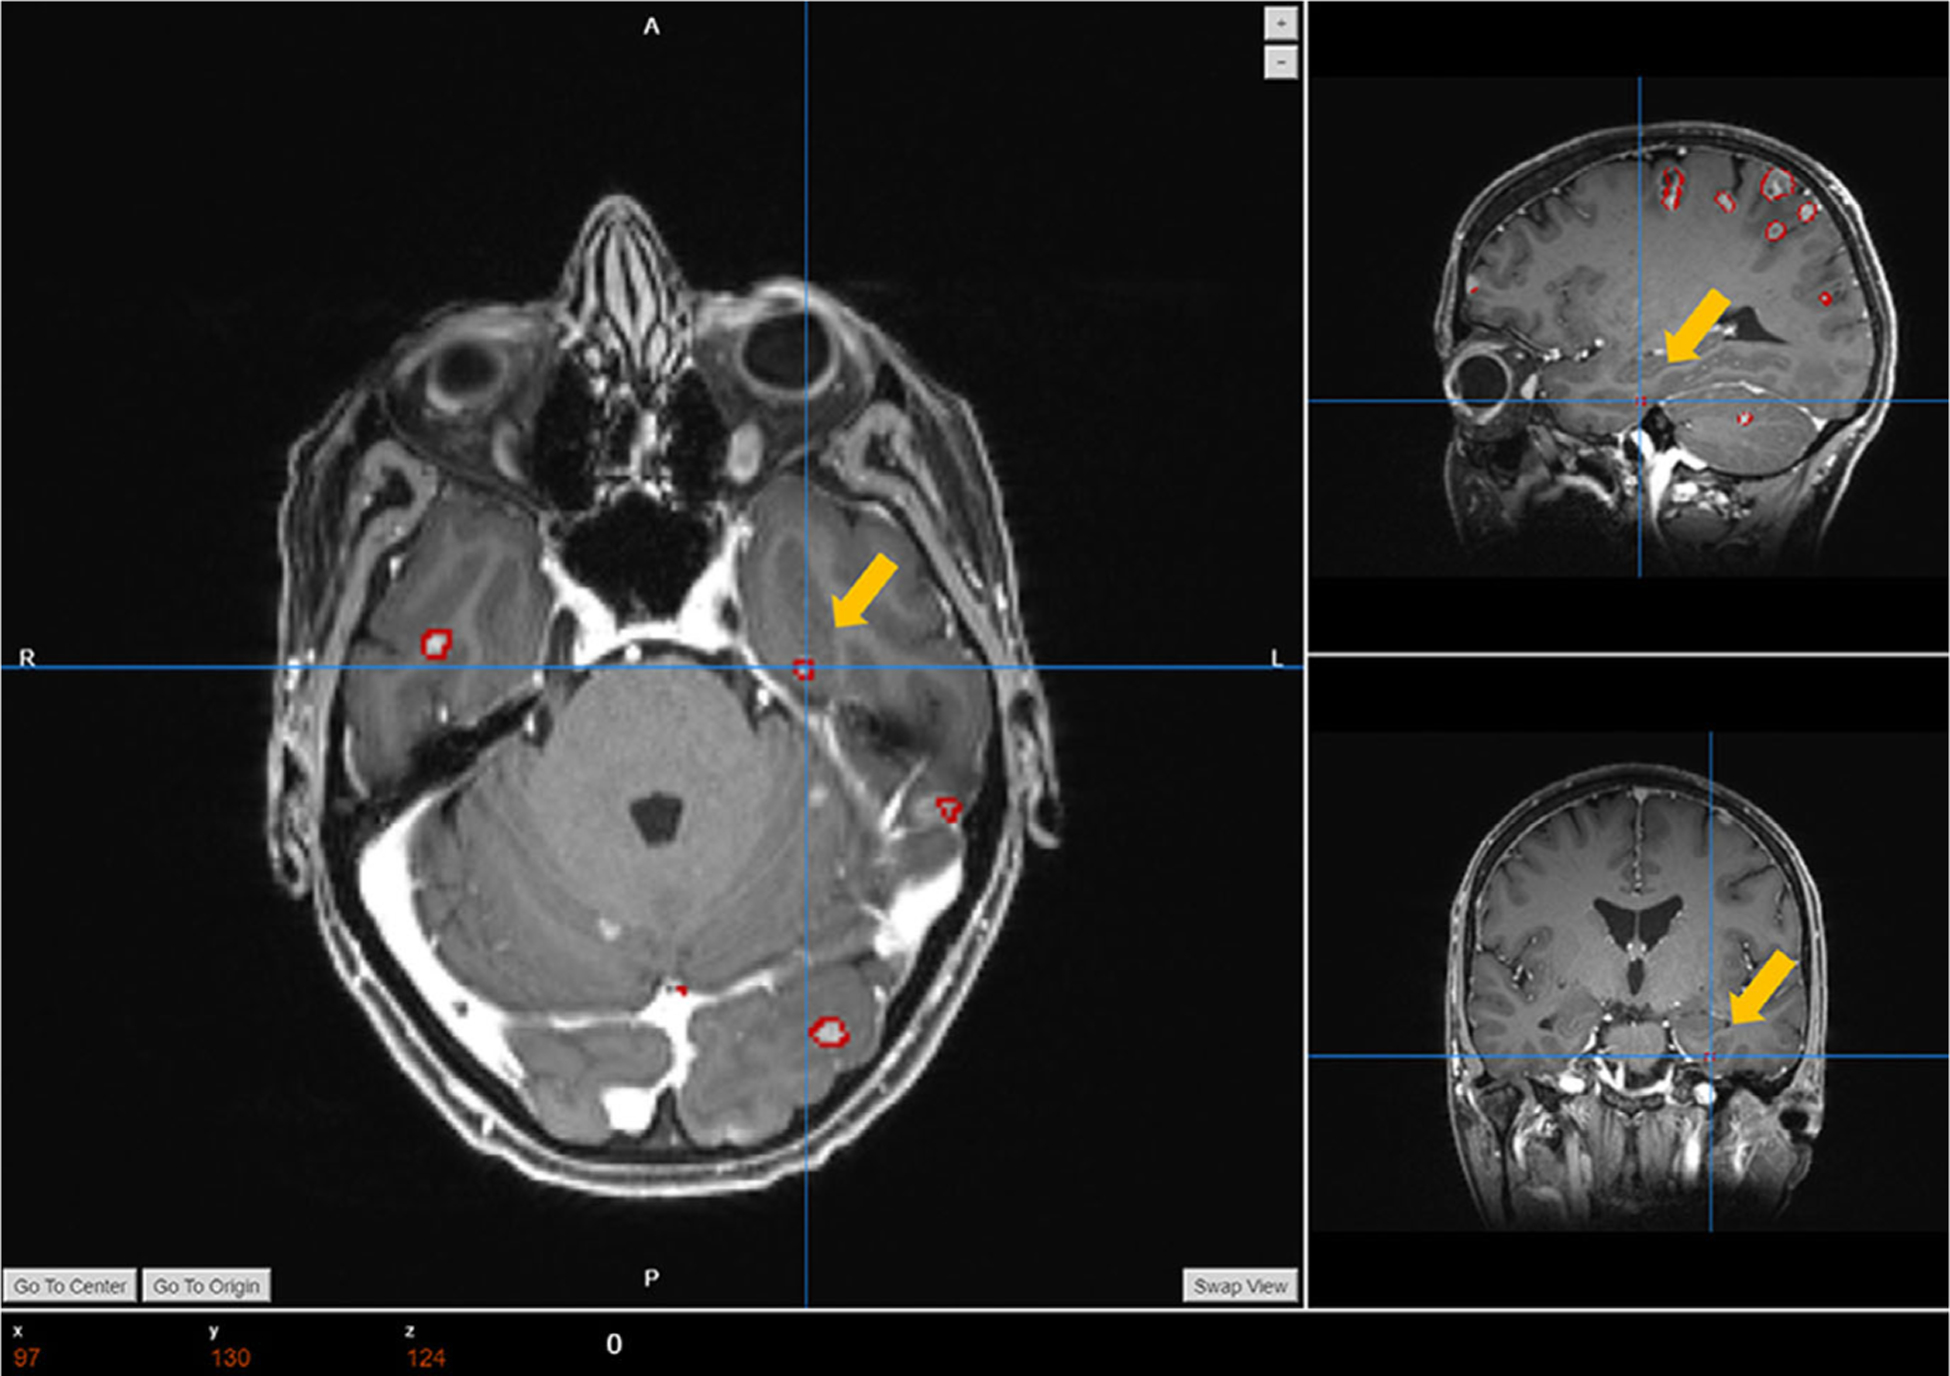
From Table III we can find that the averaged labeling accuracy among the 10 testing cases is 100%, which indicates that our platform can precisely label BMs based on their anatomical locations. By comparing the labeling results with manual labels in the Fig. 7, it can be found that the naming strategy of our auto-labels are following the same manner as the actual clinical practice, which indicates the lobe location and counts of the BMs. In addition to the similar format, we can also find that our labeling algorithm can accurately label each BMs with its atlas location information, and the results matches well with the clinical labels. Different physician has different strategy in labeling the BMs, and the data in a same clinic might have different naming standards due to different reviewers. Our methods can not only precisely label each segmentation, but also help to standardize the naming and labeling process to improve the patient data management. The accuracy of the labeling process highly depend on the registration accuracy. Although rarely happens, the BMs segmentation will not be assigned with an atlas label if it falls outside of the brain atlas after the registration process. The Fig. 10 shows one example of the failed labeling process, since this BMs locates at the bottom of the left temporal lobe and it falls outside from the temporal lobe region in the template after the registration. To further eliminate the failed cases, we will improve the implemented registration algorithm in the future.
FIG. 10.
One example of the failed labeling cases.
5. CONCLUSION
To conclude, our web-based platform can segment and label mBMs with high accuracy in only 4–5 min. In addition, it also incorporates multiple functions as follow-up comparison, postprocessing, and allows various user interactions. The implementation of this platform in clinic will greatly benefit the clinical efficiency of the brain metastases SRS treatment.
ACKNOWLEDGMENT
This work was supported by a seed grant from the Department of Radiation Oncology at the University of Texas Southwestern Medical Center and R01-CA235723 from the National Cancer Institute.
Footnotes
CONFLICTS OF INTEREST
The authors have no relevant conflicts of interest to disclose.
Contributor Information
Zi Yang, Department of Radiation Oncology, The University of Texas Southwestern Medical Center, Dallas, TX 75390, USA; Biomedical Engineering Graduate Program, The University of Texas Southwestern Medical Center, Dallas, TX 75390, USA.
Hui Liu, Department of Radiation Oncology, The University of Texas Southwestern Medical Center, Dallas, TX 75390, USA.
Yan Liu, College of Electrical Engineering, Sichuan University, Chengdu 610065, China.
REFERENCES
- 1.Nussbaum ES, Djalilian HR, Cho KH, Hall WA. Brain metastases: histology, multiplicity, surgery, and survival. Cancer. 1996;78:1781–1788. [PubMed] [Google Scholar]
- 2.Langer CJ, Mehta MP. Current management of brain metastases, with a focus on systemic options. J Clin Oncol. 2005;23:6207–6219. [DOI] [PubMed] [Google Scholar]
- 3.Khuntia D, Brown P, Li J, Mehta MP. Whole-brain radiotherapy in the management of brain metastasis. J Clin Oncol. 2006;24:1295–1304. [DOI] [PubMed] [Google Scholar]
- 4.Sturm V, Kober B, Hover K-H, et al. Stereotactic percutaneous single dose irradiation of brain metastases with a linear accelerator. Int J Radiat Oncol*Biol*Phys. 1987;13:279–282. [DOI] [PubMed] [Google Scholar]
- 5.Chang EL, Wefel JS, Hess KR, et al. Neurocognition in patients with brain metastases treated with radiosurgery or radiosurgery plus whole-brain irradiation: a randomised controlled trial. Lancet Oncol. 2009;10:1037–1044. [DOI] [PubMed] [Google Scholar]
- 6.Wu Q, Snyder KC, Liu C, et al. Optimization of treatment geometry to reduce normal brain dose in Radiosurgery of multiple brain metastases with single–Isocenter volumetric modulated arc therapy. Sci Rep. 2016;6:34511. [DOI] [PMC free article] [PubMed] [Google Scholar]
- 7.Thomas EM, Popple RA, Wu X, et al. Comparison of plan quality and delivery time between volumetric arc therapy (RapidArc) and Gamma Knife radiosurgery for multiple cranial metastases. Neurosurgery. 2014;75:409–418. [DOI] [PMC free article] [PubMed] [Google Scholar]
- 8.Brown P, Ballman K, Cerhan J, et al. N107C/CEC.3: A phase III trial of post-operative stereotactic radiosurgery (SRS) compared with whole brain radiotherapy (WBRT) for resected metastatic brain disease. Int J Radiat Oncol*Biol*Phys. 2016;96:937. [Google Scholar]
- 9.Aoyama H, Shirato H, Tago M, et al. Stereotactic radiosurgery plus whole-brain radiation therapy vs stereotactic radiosurgery alone for treatment of brain metastases: a randomized controlled trial. JAMA. 2006;295:2483–2491. [DOI] [PubMed] [Google Scholar]
- 10.Bauer S, Lu H, May CP, Nolte LP, Büchler P, Reyes M. Integrated segmentation of brain tumor images for radiotherapy and neurosurgery. Int J Imaging Syst Technol. 2013;23:59–63. [Google Scholar]
- 11.Gordillo N, Montseny E, Sobrevilla P. State of the art survey on MRI brain tumor segmentation. Magn Reson Imaging. 2013;31:1426–1438. [DOI] [PubMed] [Google Scholar]
- 12.Maier O, Menze BH, von der Gablentz J, et al. ISLES 2015-A public evaluation benchmark for ischemic stroke lesion segmentation from multispectral MRI. Med Image Anal. 2017;35:250–269. [DOI] [PMC free article] [PubMed] [Google Scholar]
- 13.Liu Y, Stojadinovic S, Hrycushko B, et al. Automatic metastatic brain tumor segmentation for stereotactic radiosurgery applications. Phys Med Biol. 2016;61:8440. [DOI] [PubMed] [Google Scholar]
- 14.Geremia E, Menze BH, Ayache N. Spatial decision forests for glioma segmentation in multi-channel MR images. MICCAI Challenge on Multimodal Brain Tumor Segmentation. 2012;34. [Google Scholar]
- 15.Bagci U, Udupa JK, Mendhiratta N, et al. Joint segmentation of anatomical and functional images: Applications in quantification of lesions from PET, PET-CT, MRI-PET, and MRI-PET-CT images. Med Image Anal. 2013;17:929–945. [DOI] [PMC free article] [PubMed] [Google Scholar]
- 16.Buendia P, Taylor T, Ryan M, John N. A grouping artificial immune network for segmentation of tumor images. Multimodal Brain Tumor Segmentation. 2013;1. [Google Scholar]
- 17.Shaw E, Scott C, Souhami L, et al. Single dose radiosurgical treatment of recurrent previously irradiated primary brain tumors and brain metastases: final report of RTOG protocol 90–05. Int J Radiat Oncol*Biol*- Phys. 2000;47:291–298. [DOI] [PubMed] [Google Scholar]
- 18.Cordier N, Menze B, Delingette H,Ayache NPatch-based segmentation of brain tissues. 2013. [Google Scholar]
- 19.Altman M, Kavanaugh J, Wooten H, et al. A framework for automated contour quality assurance in radiation therapy including adaptive techniques. Phys Med Biol. 2015;60:5199. [DOI] [PubMed] [Google Scholar]
- 20.Hamamci A, Unal G. Multimodal brain tumor segmentation using the tumor-cut method on the BraTS dataset. Proc MICCAI-BRATS. 2012. 19–23. [Google Scholar]
- 21.Guo X, Schwartz L, Zhao B. Semi-automatic segmentation of multimodal brain tumor using active contours. Multimodal Brain Tumor Segmentation. 2013;27. [Google Scholar]
- 22.Havaei M, Jodoin P-M, Larochelle H. Efficient interactive brain tumor segmentation as within-brain kNN classification. Paper presented at: 2014 22nd International Conference on Pattern Recognition; 2014 [Google Scholar]
- 23.Cui Z, Yang J, Qiao Y. Brain MRI segmentation with patch-based CNN approach. Paper presented at: 2016 35th Chinese Control Conference (CCC); 2016. [Google Scholar]
- 24.Charron O, Lallement A, Jarnet D, Noblet V, Clavier J-B, Meyer P. Automatic detection and segmentation of brain metastases on multimodal MR images with a deep convolutional neural network. Comput Biol Med. 2018;95:43–54. [DOI] [PubMed] [Google Scholar]
- 25.Chitphakdithai N, Chiang VL, Duncan JS. Tracking metastatic brain tumors in longitudinal scans via joint image registration and labeling. Paper presented at: International Workshop on Spatio-temporal Image Analysis for Longitudinal and Time-Series Image Data; 2012 [DOI] [PMC free article] [PubMed] [Google Scholar]
- 26.Losch M. Detection and segmentation of brain metastases with deep convolutional networks [Master of Science Thesis]: School of Computer Science and Communication, KTH Royal Institute of Technology; 2015. [Google Scholar]
- 27.Yu C-P, Ruppert G, Collins R, Nguyen D, Falcao A, Liu Y. 3D blob based brain tumor detection and segmentation in MR images. Paper presented at: 2014 IEEE 11th International Symposium on Biomedical Imaging (ISBI); 2014. [Google Scholar]
- 28.Yang S, Nam Y, Kim M-O, Kim EY, Park J, Kim D-H. Computer-aided detection of metastatic brain tumors using magnetic resonance black-blood imaging. Invest Radiol. 2013;48:113–119. [DOI] [PubMed] [Google Scholar]
- 29.Perez U, Arana E, Moratal D. Brain metastases detection algorithms in magnetic resonance imaging. IEEE Latin America Transactions. 2016;14:1109–1114. [Google Scholar]
- 30.Kamnitsas K, Ledig C, Newcombe VFJ, et al. Efficient multi-scale 3D CNN with fully connected CRF for accurate brain lesion segmentation. Med Image Anal. 2017;36:61–78. [DOI] [PubMed] [Google Scholar]
- 31.Liu Y, Stojadinovic S, Hrycushko B, et al. A deep convolutional neural network-based automatic delineation strategy for multiple brain metastases stereotactic radiosurgery. PLoS ONE. 2017;12:e0185844. [DOI] [PMC free article] [PubMed] [Google Scholar]
- 32.Holovaty A, Kaplan-Moss J. The definitive guide to Django: Web development done right. New York, NY: Apress; 2009. [Google Scholar]
- 33.Jodogne S, Bernard C, Devillers M, Lenaerts E, Coucke P. Orthanc-A lightweight, restful DICOM server for healthcare and medical research. Paper presented at: 2013 IEEE 10th International Symposium on Biomedical Imaging; 2013 [Google Scholar]
- 34.Chodorow K MongoDB: the definitive guide: powerful and scalable data storage. “O’Reilly, Media, Inc.”; 2013. [Google Scholar]
- 35.Iglesias JE, Liu C-Y, Thompson PM, Tu Z. Robust brain extraction across datasets and comparison with publicly available methods. IEEE Trans Med Imaging. 2011;30:1617–1634. [DOI] [PubMed] [Google Scholar]
- 36.Lancaster JL, Woldorff MG, Parsons LM, et al. Automated Talairach atlas labels for functional brain mapping. Hum Brain Mapp. 2000;10:120–131. [DOI] [PMC free article] [PubMed] [Google Scholar]
- 37.Evans AC, Collins DL, Mills S, Brown E, Kelly R, Peters TM. 3D statistical neuroanatomical models from 305 MRI volumes. Paper presented at: 1993 IEEE conference record nuclear science symposium and medical imaging conference; 1993. [Google Scholar]
- 38.Lancaster JL, Tordesillas-Guti errez D, Martinez M, et al. Bias between MNI and Talairach coordinates analyzed using the ICBM-152 brain template. Hum Brain Mapp. 2007;28:1194–1205. [DOI] [PMC free article] [PubMed] [Google Scholar]
- 39.Laird AR, Robinson JL, McMillan KM, et al. Comparison of the disparity between Talairach and MNI coordinates in functional neuroimaging data: validation of the Lancaster transform. NeuroImage. 2010;51:677–683. [DOI] [PMC free article] [PubMed] [Google Scholar]
- 40.Lacadie CM, Fulbright RK, Rajeevan N, Constable RT, Papademetris X. More accurate Talairach coordinates for neuroimaging using non-linear registration. NeuroImage. 2008;42:717–725. [DOI] [PMC free article] [PubMed] [Google Scholar]
- 41.Crum WR, Hartkens T, Hill D. Non-rigid image registration: theory and practice. Br J Radiol. 2004;77:S140–S153. [DOI] [PubMed] [Google Scholar]
- 42.Kirby N, Chuang C, Ueda U, Pouliot J. The need for application-based adaptation of deformable image registration. Med Phys. 2013;40:011702. [DOI] [PubMed] [Google Scholar]
- 43.Hoffmann C, Krause S, Stoiber EM, et al. Accuracy quantification of a deformable image registration tool applied in a clinical setting. J Appl Clin Med Phys. 2014;15:237–245. [DOI] [PMC free article] [PubMed] [Google Scholar]
- 44.Volume Wadell H., shape, and roundness of quartz particles. J Geol. 1935;43:250–280. [Google Scholar]
- 45.Lorensen WE, Cline HE. Marching cubes: A high resolution 3D surface construction algorithm. Paper presented at: ACM siggraph computer graphics; 1987. [Google Scholar]


