

Abstract
Background
We investigated the association between muscle strength and the prevalence of advanced fibrosis among individuals with non‐alcoholic fatty liver disease (NAFLD) using a nationwide cross‐sectional survey.
Methods
Individuals, 20 to 79 years of age, from the Korean National Health and Nutrition Examination Surveys (KNHANES) from 2014 to 2016 were selected (N = 14 861), with sample weights applied. Muscle strength was quantified as the handgrip strength divided by the body mass index (BMI); low muscle strength (LMS) was defined as the lowest quartile (Q1) of the handgrip strength/BMI for our sample population. NAFLD was defined as hepatic steatosis index >36. Advanced fibrosis was defined as a fibrosis‐4 index score ≥1.30 (FibrosisFIB4).
Results
The mean age of the study population was 45.6 ± 0.2 years, and 42.4% were male. As muscle strength increased, the mean BMI and age decreased accordingly, and the proportions of diabetes, dyslipidaemia, hypertension, and obesity decreased significantly (P < 0.001 for all). In a crude analysis, the LMS was associated with an increased prevalence of NAFLD (odds ratio [OR] 3.62, 95% confidence interval [CI] 3.25–4.03, P < 0.001), which remained significant even after adjustment for age, sex, obesity, insulin resistance, diabetes, hypertension, dyslipidaemia, and high‐sensitivity C‐reactive protein (OR 1.66, 95% CI 1.28–2.16, P < 0.001). In this logistic regression model, the prevalence of NAFLD decreased by 24% with each quartile increment in muscle strength (OR 0.76, 95% CI 0.68–0.85, P < 0.001). Among individuals with NAFLD (n = 2092), LMS was significantly associated with the presence of advanced fibrosis (FibrosisFIB4) independently of age, sex, obesity, diabetes, hypertension, dyslipidaemia, and high‐sensitivity C‐reactive protein (OR 1.66, 95% CI 1.01–2.49, P = 0.015), which lost its statistical significance after additional adjustment for insulin resistance.
Conclusions
Low muscle strength is independently associated with NAFLD. The significant association between LMS and advanced fibrosis in NAFLD may be mediated through insulin resistance.
Keywords: Hepatic steatosis, Hepatic fibrosis, Muscle strength, Sarcopenia, Insulin resistance
Introduction
Sarcopenia is defined as a progressive decrease in muscle mass and function. 1 Sarcopenia increases the risk for metabolic disease, physical disability, poor quality of life, and mortality. 2 , 3 , 4 Recently, an independent association between appendicular skeletal muscle mass and histological severity of non‐alcoholic fatty liver disease (NAFLD) has been reported. 5 Insulin resistance (IR), an important pathogenic mechanism of NAFLD, 6 also increases the risk of sarcopenia via reduction of protein synthesis and increased protein breakdown. 7 , 8
To date, the association between NAFLD and sarcopenia has been principally evaluated from a perspective of low skeletal muscle mass rather than the quality of muscle function. 5 , 9 However, recent studies have demonstrated that muscle strength is more important than muscle mass in predicting health outcomes in older adults. 10 , 11 Yet there have been few population‐based studies on the association between muscle strength and NAFLD.
In the current study, we investigated the association between muscle strength and the prevalence of NAFLD through an analysis of a nationwide representative cross‐sectional survey dataset. In addition, the association between muscle strength and advanced fibrosis among individuals with NAFLD was also analysed.
Materials and methods
Study participants
We performed a retrospective analysis of the 2014 to 2016 data from the Korean National Health and Nutrition Examination Surveys (KNHANES). The KNHANES involves a nationwide cross‐sectional health examination and survey performed by the Korea Centers for Disease Control and Prevention in the Ministry of Health and Welfare, with details having been previously reported. 9 Briefly, the KNHANES recruit participants using a stratified multistage probability‐based sampling design; sampling weights are assigned to each respondent to ensure that the results are representative of the whole Korean population.
Among a total of 23 080 participants enrolled in the KNHANES between 2014 and 2016, we included 14 861 individuals, 20 to 79 years old, whose handgrip strength (HGS) data were available. The exclusion criteria were as follows: alcohol consumption >210 g/week for men and >140 g/week for women, 12 and positive serological markers for hepatitis B or C virus. After screening for the exclusion criteria, 13 502 individuals were included in our analysis (Figure 1). The use of the KNHANES 2014 data was approved by the institutional review board (IRB) of the Korea Centers for Disease Control and Prevention (IRB No. 2013‐12EXP‐03‐5C). IRB approval was not required for use of the KNHANES data between 2015 and 2016 under the Bioethics Act. Our study was performed in accordance with the ethical standards laid down in the 1964 Declaration of Helsinki and its later amendments.
Figure 1.
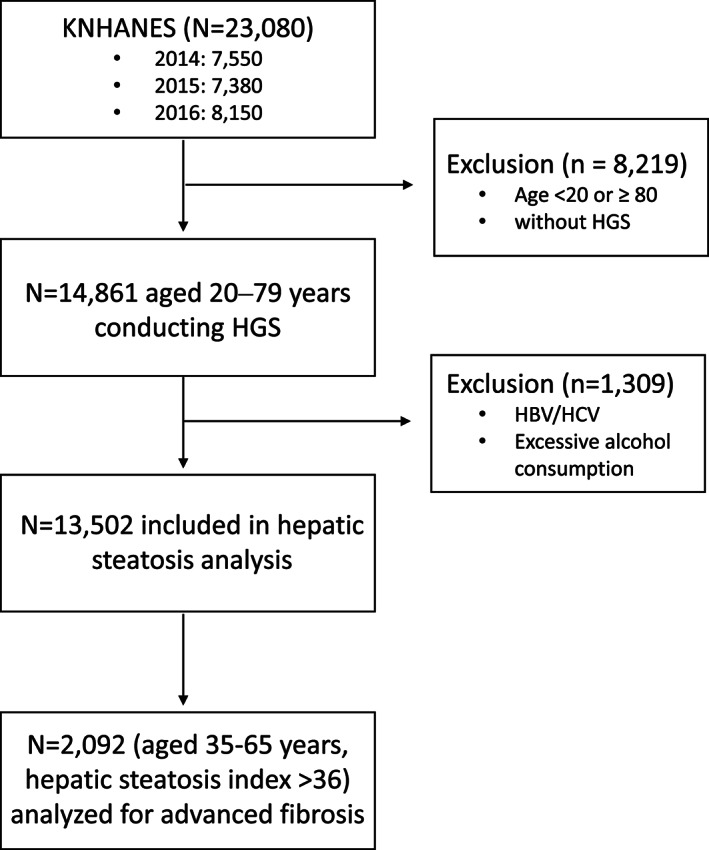
Flow diagram of participants for the study. Among a total of 23 080 participants in the Korean National Health and Nutrition Examination Surveys (KNHANES) 2014–2016, 13 502 individuals were included in our analysis. Individuals with non‐alcoholic fatty liver disease, defined by hepatic steatosis index, aged 35–65 years (n = 2092), were analysed for advanced fibrosis. HBV, hepatitis B virus; HCV, hepatitis C virus; HGS, handgrip strength.
Metabolic parameters measurement
Diabetes mellitus (DM) was defined as an 8 h fasting plasma glucose level ≥7.0 mmol/L (126 mg/dL) or glycated haemoglobin level ≥48 mmol/mol (6.5%), or use of anti‐diabetic medication including insulin. 13 Hypertension (HTN) was defined as a systolic blood pressure (BP) ≥ 140 mmHg, or diastolic BP ≥ 90 mmHg, or taking antihypertensive medications; dyslipidaemia (DL) was defined as non‐high‐density lipoprotein cholesterol ≥190 mg/dL or taking lipid‐lowering medication. 14 Obesity and abdominal obesity were defined as a body mass index (BMI) ≥ 25 kg/m2 15 and waist circumference ≥90 and ≥85 cm in men and women, respectively. 16 Homeostatic Model Assessment of Insulin Resistance (HOMA‐IR) was calculated as [fasting glucose (mg/dL) × fasting insulin (uU/mL)]/405; IR was defined as HOMA‐IR ≥ 2.5. 17 Elevated high‐sensitivity C‐reactive protein (hs‐CRP) was defined as ≥1 mg/L. 18
Assessment of muscle strength
Muscle strength was quantified by the HGS, assessed using a digital grip strength dynamometer (TKK 5401; Takei, Tokyo, Japan), as previously reported. 19 Briefly, HGS was measured with the individual standing upright, with the elbow in full extension. Participants were instructed to squeeze the dynamometer as strongly as possible, for at least 3 s. Three measures were obtained, with a 1 min rest period between each trial. Following the previous studies, muscle strength was calculated from mean HGS of a dominant arm adjusted by BMI: HGS/BMI. 20 , 21 The quartiles of muscle strength were calculated in each gender, with Q1 and Q4 being the lowest and highest quartiles of HGS/BMI, respectively. The Q1 was defined as the group of subjects with low muscle strength (LMS).
Assessment of non‐alcoholic fatty liver disease
Non‐alcoholic fatty liver disease was defined using previously well‐validated fatty liver prediction models: the hepatic steatosis index (HSI), 22 calculated as 8 × alanine aminotransferase (ALT)/aspartate aminotransferase (AST) + BMI (+2, if diabetes; +2 if female). NAFLD was defined as HSI > 36. 22 The sensitivity and specificity of HSI for prediction of NAFLD have been reported to be 86% and 66%, respectively, in Caucasians 23 and 93.1% and 92.4%, respectively, in the Korean population. 22
Assessment of advanced fibrosis in non‐alcoholic fatty liver disease
Among individuals with NAFLD, as defined by the HSI, advanced fibrosis was assessed using the following prediction models: (i) fibrosis‐4 index (FIB‐4) 24 = age (years) × AST [U/L]/(platelet [109/L] × (ALT [U/L])1/2 and (ii) BARD score 25 = the sum of the following scores (BMI ≥ 28 = 1 point; AST/ALT ratio ≥0.8 = 2 points; diabetes = 1 point). Advanced fibrosis was defined as either a FIB‐4 score ≥1.30 (FibrosisFIB4) 26 or a BARD score ≥2 (FibrosisBARD). 25 As the diagnostic performance of FIB‐4 for advanced fibrosis is unacceptably low in patients aged >65 or <35 years, 27 only subjects aged 35–65 years (n = 2092) were included in analysis for advanced fibrosis.
Statistical analyses
Variables are reported as the mean ± standard error (SE) or the prevalence ± SE (%). Linear regression or logistic linear regression analysis was used to compare the clinical variables according to muscle strength, adjusted for age, sex, obesity, IR, and other metabolic parameters. Sampling weights were applied to all analyses. Statistical analyses were performed using IBM SPSS Statistics (Version 22.0, IBM Corp., Armonk, NY, USA), with a P value <0.05 considered significant for all tests.
Results
Clinical characteristics according to muscle strength
The mean age of the study population was 45.6 ± 0.2 years, with 42.4% of the sample being male. Mean HGS was 23.7 kg (standard error [SE], 0.2 kg), 29.7 kg (SE, 0.2 kg), 33.4 kg (SE, 0.2 kg), and 37.5 kg (SE, 0.2 kg), and muscle strength (HGS/BMI) was 0.90 (SE, 0.0), 1.19 (SE, 0.0), 1.40 (SE, 0.0), and 1.71 (SE, 0.0) in the Q1, Q2, Q3, and Q4, respectively (P < 0.001; Table 1). As muscle strength increased, mean BMI and mean age were accordingly decreased (P < 0.001 in both; Table 1). Waist circumference, systolic BP, ALT, AST, triglycerides, glycated haemoglobin, hs‐CRP level, and HOMA‐IR also significantly decreased in order from the Q1 towards the Q4 (P < 0.001 in all; Table 1). As muscle strength increased, the proportions of cardio‐metabolic disorders including DM, DL, HTN, and obesity decreased significantly (P < 0.001 in all; Table 1).
Table 1.
Clinical characteristics according to muscle strength quartiles
| Total | Q1 | Q2 | Q3 | Q4 | P for trend a | |
|---|---|---|---|---|---|---|
| Unweighted N | 13 502 | 3193 | 3354 | 3456 | 3499 | |
| HGS (kg) b | 31.8 ± 0.1 | 23.7 ± 0.2 | 29.7 ± 0.2 | 33.4 ± 0.2 | 37.5 ± 0.2 | <0.001 |
| HGS/BMI | 1.35 ± 0.0 | 0.90 ± 0.0 | 1.19 ± 0.0 | 1.40 ± 0.0 | 1.71 ± 0.0 | <0.001 |
| Age (years) | 45.6 ± 0.2 | 54.1 ± 0.5 | 48.2 ± 0.4 | 43.7 ± 0.3 | 39.7 ± 0.3 | <0.001 |
| BMI (kg/m2) | 23.8 ± 0.0 | 26.2 ± 0.1 | 24.8 ± 0.1 | 23.6 ± 0.1 | 21.8 ± 0.1 | <0.001 |
| Waist circumference (cm) | 82.0 ± 0.1 | 88.4 ± 0.2 | 84.4 ± 0.2 | 81.2 ± 0.2 | 76.7 ± 0.2 | <0.001 |
| Systolic BP (mmHg) | 116.5 ± 0.2 | 121.9 ± 0.4 | 118.6 ± 0.3 | 115.4 ± 0.3 | 112.3 ± 0.3 | <0.001 |
| Diastolic BP (mmHg) | 75.3 ± 0.1 | 75.5 ± 0.2 | 76.1 ± 0.2 | 75.6 ± 0.2 | 74.3 ± 0.2 | <0.001 |
| AST (IU/L) | 22.0 ± 0.1 | 24.4 ± 0.3 | 23.0 ± 0.3 | 21.4 ± 0.2 | 20.2 ± 0.2 | <0.001 |
| ALT (IU/L) | 22.0 ± 0.2 | 26.5 ± 0.6 | 24.2 ± 0.5 | 21.2 ± 0.3 | 18.2 ± 0.2 | <0.001 |
| Total cholesterol (mg/dL) | 190.6 ± 0.4 | 192.1 ± 0.9 | 193.5 ± 0.8 | 191.3 ± 0.7 | 186.7 ± 0.7 | <0.001 |
| HDL (mg/dL) | 51.0 ± 0.1 | 47.6 ± 0.2 | 49.7 ± 0.3 | 51.0 ± 0.2 | 54.2 ± 0.2 | <0.001 |
| TG (mg/dL) | 138.2 ± 1.4 | 153.1 ± 2.6 | 150.5 ± 2.7 | 140.9 ± 2.6 | 117.0 ± 2.8 | <0.001 |
| LDL (mg/dL) | 116.0 ± 0.5 | 117.9 ± 1.0 | 118.4 ± 1.1 | 116.5 ± 0.9 | 111.8 ± 1.0 | <0.001 |
| HbA1c (%) | 5.6 ± 0.0 | 5.9 ± 0.0 | 5.7 ± 0.0 | 5.6 ± 0.0 | 5.5 ± 0.0 | <0.001 |
| HOMA‐IR | 2.2 ± 0.0 | 3.2 ± 0.2 | 2.5 ± 0.1 | 2.0 ± 0.1 | 1.5 ± 0.0 | <0.001 |
| hs‐CRP (mg/L) | 1.2 ± 0.0 | 1.7 ± 0.1 | 1.3 ± 0.1 | 1.1 ± 0.0 | 0.8 ± 0.0 | <0.001 |
| Diabetes mellitus (%) | 10.7 ± 0.3 | 21.9 ± 0.9 | 12.8 ± 0.7 | 8.7 ± 0.6 | 3.6 ± 0.3 | <0.001 |
| Dyslipidaemia (%) | 16.5 ± 0.4 | 23.0 ± 1.0 | 20.9 ± 0.8 | 15.8 ± 0.8 | 9.6 ± 0.6 | <0.001 |
| Hypertension (%) | 24.1 ± 0.5 | 41.2 ± 1.2 | 29.6 ± 0.9 | 19.9 ± 0.9 | 12.4 ± 0.6 | <0.001 |
| Obesity (%) | 33.6 ± 0.5 | 59.9 ± 1.1 | 44.8 ± 1.1 | 29.3 ± 0.9 | 11.6 ± 0.7 | <0.001 |
ALT, alanine aminotransferase; AST, aspartate aminotransferase; BMI, body mass index; BP, blood pressure; HbA1c, glycated haemoglobin; HDL, high‐density lipoprotein; HGS, handgrip strength; HOMA‐IR, Homeostatic Model Assessment of Insulin Resistance; hs‐CRP, high‐sensitivity C‐reactive protein; LDL, low‐density lipoprotein; Q, quartile; Q1, the lowest quartile; Q4, the highest quartile; TG, triglycerides.
Muscle strength was calculated from mean HGS divided by BMI. Values are presented as mean or prevalence ± standard error.
From logistic and linear regression without any adjustment.
Handgrip strength of dominant arm.
Association between non‐alcoholic fatty liver disease and low muscle strength
The prevalence of NAFLD was 45.0% (SE, 1.1%), 30.5% (SE, 1.0%), 20.3% (SE, 0.9%), and 7.5% (SE 0.5%) in the Q1, Q2, Q3, and Q4, respectively (P for trend <0.001; Figure 2A); LMS, defined as Q1, was associated with an increased prevalence of NAFLD (odds ratio [OR] 3.62, 95% confidence interval [CI] 3.25–4.03, P < 0.001). After adjustment for age, sex, obesity, DM, HTN, DL, and elevated hs‐CRP level, the association between LMS and NAFLD remained significant (OR 1.92, 95% CI 1.61–2.29, P < 0.001; Model 3 in Table 2). Even after additional adjustment for IR, LMS was associated with 1.66 times higher prevalence of NAFLD (OR 1.66, 95% CI 1.28–2.16, P < 0.001; Model 4 in Table 2).
Figure 2.
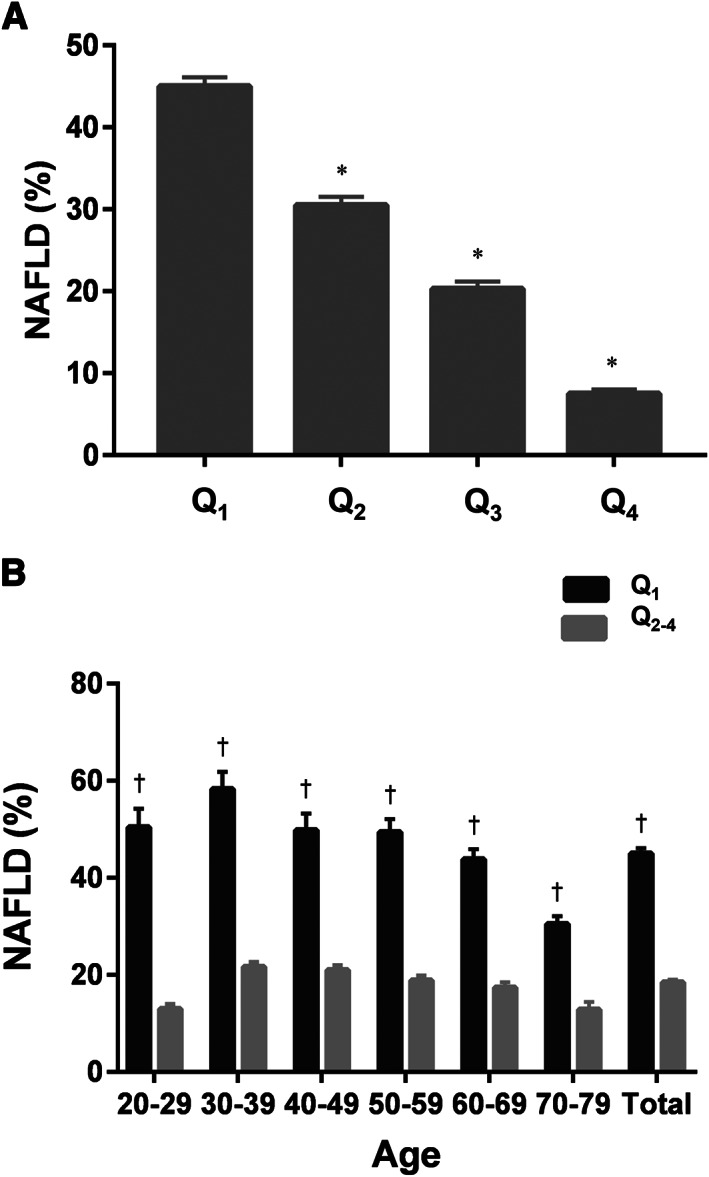
Prevalence of non‐alcoholic fatty liver disease (NAFLD) according to muscle strength. (A) The prevalence of NAFLD according to muscle strength quartiles in the entire study population. (B) The prevalence of NAFLD in 10 year age strata according to the presence of low muscle strength. *Significantly lower compared with the Q1 (P < 0.05). †Significantly higher compared with the rest of the groups (Q2, Q3, and Q4).
Table 2.
Association between NAFLD and low muscle strength
| NAFLD | |||
|---|---|---|---|
| OR | 95% CI | P | |
| Unadjusted | 3.62 | 3.25–4.03 | <0.001 |
| Model 1 | 3.93 | 3.50–4.41 | <0.001 |
| Model 2 | 2.03 | 1.76–2.34 | <0.001 |
| Model 3 | 1.92 | 1.61–2.29 | <0.001 |
| Model 4 | 1.66 | 1.28–2.16 | <0.001 |
CI, confidence interval; NAFLD, non‐alcoholic fatty liver disease; OR, odds ratio.
Low muscle strength was defined as the lowest quartile of muscle strength (handgrip strength/body mass index). Model 1, adjusted for age and sex; Model 2, adjusted for age, sex, and obesity; Model 3, with additional adjustment for the presence of diabetes mellitus, hypertension, dyslipidaemia, and elevated high‐sensitivity C‐reactive protein in addition to Model 2; Model 4, with additional adjustment for insulin resistance (Homeostatic Model Assessment of Insulin Resistance ≥2.5) in addition to Model 3.
Given a strong association between age and muscle strength, the prevalence of NAFLD according to muscle strength was investigated using a 10 year age stratification (Supporting Information, Table S1). We compared the prevalence of NAFLD in each quartile of muscle strength across each 10 year age strata in our sample group: 20–29, 30–39, 40–49, 50–59, 60–69, and 70–79 years. The prevalence of NAFLD in the LMS group (Q1) was significantly higher in all age strata groups than in the other groups (Q2, Q3, and Q4; P < 0.001 in all) (Figure 2B).
The quantitative association between muscle strength and non‐alcoholic fatty liver disease
A dose–response relationship was observed between muscle strength and NAFLD (Figure 2A); the prevalence of NAFLD significantly decreased as the quartiles of muscle strength increased, compared with that in the Q1 (Table 3; P < 0.001 in all quartiles). For every 1 quartile (1Q) increment in muscle strength, the prevalence of NAFLD decreased by 51% (OR per 1Q increment 0.49, 95% CI 0.47–0.51, P < 0.001). The prevalence of NAFLD was significantly lower even in the Q2 group (i.e., the second lowest muscle strength group) compared with the Q1 group (OR for NAFLD 0.54, 95% CI 0.47–0.61, P < 0.001). After adjustment for age, sex, obesity, DM, HTN, DL, elevated hs‐CRP level, and IR, this quantitative association between muscle strength and the prevalence of NAFLD remained significant (Model 4 in Table 3). In Model 4, the prevalence of NAFLD decreased by 24% per 1Q increment in muscle strength (OR per 1Q increment 0.76, 95% CI 0.68–0.85, P < 0.001).
Table 3.
Risk of NAFLD in each quartile of muscle strength
| NAFLD | |||
|---|---|---|---|
| OR | 95% CI | P | |
| Unadjusted | |||
| Q1 | (Reference) | ||
| Q2 | 0.54 | 0.47–0.61 | <0.001 |
| Q3 | 0.31 | 0.27–0.36 | <0.001 |
| Q4 | 0.10 | 0.08–0.12 | <0.001 |
| Per 1Q | 0.49 | 0.47–0.51 | <0.001 * |
| Model 1 | |||
| Q1 | (Reference) | ||
| Q2 | 0.49 | 0.43–0.56 | <0.001 |
| Q3 | 0.27 | 0.23–0.31 | <0.001 |
| Q4 | 0.08 | 0.07–0.10 | <0.001 |
| Per 1Q | 0.45 | 0.43–0.48 | <0.001 * |
| Model 2 | |||
| Q1 | (Reference) | ||
| Q2 | 0.63 | 0.54–0.73 | <0.001 |
| Q3 | 0.49 | 0.41–0.59 | <0.001 |
| Q4 | 0.26 | 0.21–0.31 | <0.001 |
| Per 1Q | 0.66 | 0.62–0.70 | <0.001 * |
| Model 3 | |||
| Q1 | (Reference) | ||
| Q2 | 0.60 | 0.49–0.74 | <0.001 |
| Q3 | 0.56 | 0.45–0.69 | <0.001 |
| Q4 | 0.30 | 0.23–0.39 | <0.001 |
| Per 1Q | 0.70 | 0.65–0.76 | <0.001 * |
| Model 4 | |||
| Q1 | (Reference) | ||
| Q2 | 0.66 | 0.48–0.89 | <0.001 |
| Q3 | 0.67 | 0.49–0.93 | 0.005 |
| Q4 | 0.38 | 0.27–0.54 | 0.003 |
| Per 1Q | 0.76 | 0.68–0.85 | <0.001 * |
CI, confidence interval; NAFLD, non‐alcoholic fatty liver disease; OR, odds ratio.
Muscle strength was calculated from mean handgrip strength divided by body mass index. Q1, the lowest quartile; Q4, the highest quartile. Model 1, adjusted for age and sex; Model 2, adjusted for age, sex, and obesity; Model 3, with additional adjustment for the presence of diabetes mellitus, hypertension, dyslipidaemia, and elevated high‐sensitivity C‐reactive protein in addition to Model 2; Model 4, with additional adjustment for insulin resistance (Homeostatic Model Assessment of Insulin Resistance ≥2.5) in addition to Model 3.
P value for the test of trend of odds.
Association between muscle strength and advanced fibrosis
To investigate the association between muscle strength and advanced fibrosis, only individuals with NAFLD were selected (n = 2092). For these patients with NAFLD, both FIB‐4 and BARD scores were calculated to detect advanced fibrosis. The prevalence of advanced fibrosis in each quartile (Q1–Q4) showed a decreasing trend as muscle strength increased (Figure 3): FibrosisFIB4, 18.0% (SE 1.6%), 11.2% (SE, 1.4%), 8.0% (SE, 1.4%), and 2.6% (SE, 1.0%) (P < 0.001); FibrosisBARD, 63.9% (SE, 2.3%), 50.3% (SE, 2.4%), 42.4% (SE, 2.6%), and 29.7% (SE, 4.6%) (P < 0.001).
Figure 3.
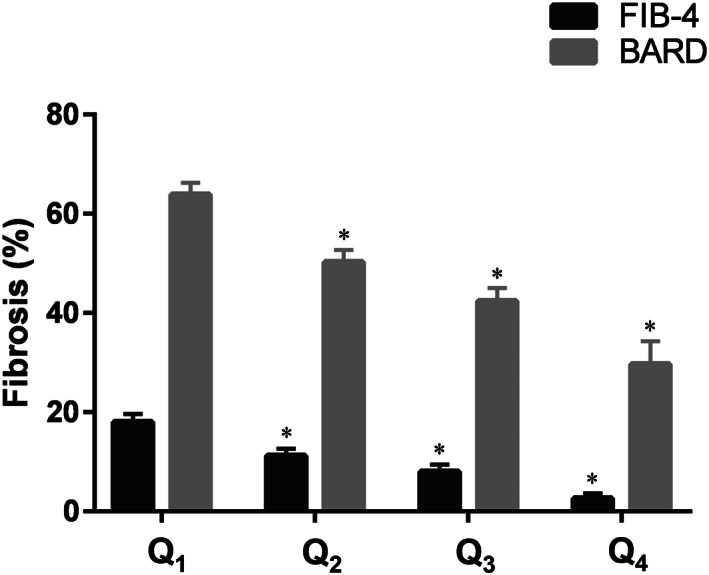
Prevalence of advanced fibrosis according to muscle strength. The prevalence of advanced fibrosis according to muscle strength quartiles. *Significantly lower compared with the Q1 (P < 0.05). BARD, BARD score for non‐alcoholic fatty liver disease fibrosis; FIB‐4, fibrosis‐4 index; low muscle strength was defined as the lowest quartile (Q1) of muscle strength (handgrip strength/body mass index).
Low muscle strength was found to be significantly associated with an increased risk of advanced fibrosis (FibrosisFIB4, OR 2.29, 95% CI 1.68–3.13, P < 0.001; FibrosisBARD, OR 2.22, 95% CI 1.76–2.81, P < 0.001), which remained statistically significant after adjustment for age, sex, and obesity (FibrosisFIB4, OR 1.50, 95% CI 1.06–2.12, P = 0.023; FibrosisBARD, OR 1.57, 95% CI 1.21–2.04, P = 0.001; Model 2 in Table 4). Additional adjustment for DM, HTN, DL, and elevated hs‐CRP level did not attenuate the significant association between LMS and advanced fibrosis (FibrosisFIB4, OR 1.66, 95% CI 1.01–2.49, P = 0.015; FibrosisBARD, OR 1.81, 95% CI 1.30–2.51, P < 0.001; Model 3 in Table 4). However, adding IR to multivariable‐adjusted analysis weakened the association between LMS and advanced fibrosis; statistical significance was maintained for FibrosisBARD but not for FibrosisFIB4 (Model 4 in Table 4).
Table 4.
Risk of advanced fibrosis stratified by low muscle strength in subjects with non‐alcoholic fatty liver disease
| FibrosisFIB4 | FibrosisBARD | |||||
|---|---|---|---|---|---|---|
| OR | 95% CI | P | OR | 95% CI | P | |
| Unadjusted | 2.29 | 1.68–3.13 | <0.001 | 2.22 | 1.76–2.81 | <0.001 |
| Model 1 | 1.56 | 1.11–2.20 | 0.011 | 1.90 | 1.48–2.44 | <0.001 |
| Model 2 | 1.50 | 1.06–2.12 | 0.023 | 1.57 | 1.21–2.04 | 0.001 |
| Model 3 | 1.66 | 1.01–2.49 | 0.015 | 1.81 | 1.30–2.51 | <0.001 |
| Model 4 | 1.35 | 0.75–2.45 | 0.314 | 1.68 | 1.07–2.62 | 0.024 |
CI, confidence interval; FibrosisBARD, BARD score ≥2; FibrosisFIB4, fibrosis‐4 index >1.30; OR, odds ratio.
Low muscle strength was defined as the lowest quartile of muscle strength (handgrip strength/body mass index). Model 1, adjusted for age and sex; Model 2, adjusted for age, sex, and obesity; Model 3, with additional adjustment for the presence of diabetes mellitus, hypertension, dyslipidaemia, and elevated high‐sensitivity C‐reactive protein in addition to Model 2; Model 4, with additional adjustment for insulin resistance (Homeostatic Model Assessment of Insulin Resistance ≥2.5) in addition to Model 3.
In the current study, HOMA‐IR was available only in 671 subjects with NAFLD. In a stratified analysis according to IR, the association between LMS and FibrosisFIB4 was more prominent in subjects with HOMA‐IR < 2.5 (unweighted N = 279; OR 3.05, 95% CI 1.27–7.30, P = 0.013) than in those with HOMA‐IR ≥ 2.5 (unweighted N = 392, OR 1.84, 95% CI 0.92–3.68, P = 0.085), and the same trend held true for FibrosisBARD (Table 5). Stratified analyses according to abdominal obesity, obesity, sex, or age did not reveal any differences in the association between LMS and advanced fibrosis (Table 5).
Table 5.
Stratified association between advanced fibrosis and low muscle strength in subjects with non‐alcoholic fatty liver disease
| FibrosisFIB4 | FibrosisBARD | |||||
|---|---|---|---|---|---|---|
| OR | 95% CI | P | OR | 95% CI | P | |
| HOMA‐IR | ||||||
| <2.5 | 3.05 | 1.27–7.30 | 0.013 | 4.21 | 2.04–8.70 | <0.001 |
| ≥2.5 | 1.84 | 0.92–3.68 | 0.085 | 1.71 | 1.09–2.67 | 0.019 |
| Abdominal obesity | ||||||
| No | 1.95 | 0.98–3.87 | 0.057 | 2.17 | 1.31–3.60 | 0.003 |
| Yes | 2.42 | 1.72–3.41 | <0.001 | 1.85 | 1.41–2.42 | <0.001 |
| Obesity | ||||||
| No | 2.42 | 0.86–6.81 | 0.092 | 2.40 | 1.01–5.43 | 0.036 |
| Yes | 2.20 | 1.58–3.06 | <0.001 | 1.90 | 1.49–2.43 | <0.001 |
| Sex | ||||||
| Male | 2.43 | 1.51–3.90 | <0.001 | 1.74 | 1.26–2.41 | 0.001 |
| Female | 2.05 | 1.35–3.10 | 0.001 | 2.73 | 1.88–3.97 | <0.001 |
| Age (years) | ||||||
| <50 | 2.58 | 1.12–5.93 | 0.026 | 1.94 | 1.36–2.76 | <0.001 |
| ≥50 | 1.60 | 1.12–2.28 | 0.010 | 2.11 | 1.52–2.94 | <0.001 |
CI, confidence interval; FibrosisBARD, BARD score ≥2; FibrosisFIB4, fibrosis‐4 index >1.30; HOMA‐IR, Homeostatic Model Assessment of Insulin Resistance; OR, odds ratio.
Low muscle strength was defined as the lowest quartile of muscle strength (handgrip strength/body mass index). Each stratified analysis was performed using logistic regression without adjustment.
Discussion
In the current study, muscle strength was inversely associated with the prevalence of NAFLD, irrespective of age. LMS was an independent risk factor for NAFLD regardless of age, sex, obesity, DM, HTN, DL, hs‐CRP level, and IR with the odds of NAFLD among individuals with LMS reaching 1.66. Moreover, there was a dose–response relationship between muscle strength and the prevalence of NAFLD; even individuals in the second lowest muscle strength group (Q2) had a significantly lower risk of NAFLD than those with LMS. Among those with NAFLD, LMS showed a significant association with advanced fibrosis independent of age, sex, and other metabolic derangements. However, additional adjustment for IR attenuated this association; LMS was not associated with FibrosisFIB4 after adjustment for IR.
Sarcopenia is a syndrome characterized by loss of skeletal muscle mass and strength with an increased risk of adverse metabolic outcomes. 28 Recently, LMS has become more widely recognized as a principal determinant of sarcopenia than low muscle mass, based on recent evidence that muscle strength may be more important to predict fracture, falling, 29 cardiovascular disease, and all‐cause mortality. 30 The most updated guideline from the European Working Group on Sarcopenia in Older People 31 defined LMS as the key characteristic of sarcopenia. Diagnosis of sarcopenia can be made when LMS coexists with low muscle quantity, and the European Working Group on Sarcopenia in Older People recommends grip strength for a proxy measure of whole‐body strength. Grip strength measurement is also a quick and easy‐to‐obtain test and has been well validated as a tool to predict all causes of death. 30
Several mechanisms may influence an inverse association between sarcopenia and NAFLD, including IR, inflammation, myokines, and decreased physical activity. 28 In the current study, HOMA‐IR and hs‐CRP levels, as well as the prevalence of NAFLD, significantly increased as muscle strength decreased. Although obesity has been considered as the main pathophysiological factor leading to metabolic syndrome, including NAFLD, non‐obese individuals may also develop NAFLD. 32 Skeletal muscle is the primary target organ of insulin‐mediated glucose disposal, and therefore, sarcopenia itself, independent of obesity, may aggravate IR. 33 In the current study, the significant association between LMS and FibrosisFIB4 lost its statistical significance after adjustment for IR, implicating that IR plays an important role in the relationship between LMS and advanced fibrosis in NAFLD. Interestingly, the stratified analysis showed that there was an association between LMS and advanced fibrosis in patients without IR compared with those with IR. Although IR plays a main pathogenic role in developing both NAFLD 34 , 35 and sarcopenia, 33 the latter may increase the severity of NAFLD through IR‐independent mechanisms such as systemic inflammation. 36 , 37
Although several pharmacotherapeutic agents, such as vitamin E, 38 thiazolidinedione, 39 glucagon like peptide‐1 analogues, 40 and farnesoid X receptor agonists, 41 have shown positive results on the treatment of non‐alcoholic steatohepatitis, currently, there are no approved medications for NAFLD. The mainstay treatment is lifestyle intervention, focusing on weight loss. However, the achievement of the treatment goal (viz. a weight reduction of >10% of body weight 42 ) to regress fibrosis is difficult to obtain for most patients with NAFLD. Considering the paucity in the effective treatment for NAFLD and the substantial NAFLD‐related morbidities, resistance training can be a promising treatment strategy against non‐alcoholic steatohepatitis and advanced fibrosis.
Resistance training has been shown to improve hepatic steatosis 43 , 44 and inflammation 45 in patients with NAFLD, independently of weight loss. Resistance training may increase glycolysis and improve insulin sensitivity through hypertrophy of type II muscle fibres, 46 increasing glucose transporter 4 expression, 47 up‐regulation of AMP‐activated protein kinase and caveolins in type II muscle fibres, 48 and increasing myokines that are beneficial to hepatic steatosis. 49 , 50 Irisin has been reported to have a protective effect on hepatic steatosis, 50 and its level significantly increased after 8 weeks of initiating exercise in the resistance training group compared with that in the aerobic exercise group. 49
There are several limitations in our study. First, data from liver imaging, such as ultrasonography and magnetic resonance imaging, as well as histological information, were not available in the current, population‐based study. Because only liver biopsy can distinguish steatohepatitis from simple steatosis, liver biopsy is considered a gold standard method but is hard to perform in primary centres due to its invasiveness and expensiveness. In addition, only a relatively small number of NAFLD subjects (671/2092, 32%) were subjected to HOMA‐IR tests, which might account for the lack of statistical significance in the association between LMS and advanced fibrosis adjusted for IR. Second, because of the cross‐sectional nature of the current study, causality cannot be determined between LMS and incident NAFLD or advanced fibrosis. Therefore, further prospective longitudinal cohort studies should be conducted to validate whether LMS is the real culprit of NAFLD and advanced fibrosis. Finally, because of insufficient muscle mass data in the current KNHANES analysis, we could not confirm whether the association between LMS and NAFLD persists independently of muscle mass. Although a previous study investigated the association between muscle mass and liver fibrosis using the KNHANES data between 2008 and 2011, 9 it measured only muscle mass using dual‐energy X‐ray absorptiometry but not muscle strength. On the contrary, we used the KNHANES data between 2014 and 2016, which measured sarcopenia through the other way.
Collectively, we demonstrated the association between LMS and NAFLD or advanced fibrosis from the nationwide survey representing Korean population. LMS was significantly associated with an increased prevalence of NAFLD independently of age and BMI and was also closely associated with increased IR and higher prevalence of metabolic diseases. The association between LMS and advanced fibrosis in NAFLD subjects was found to be independent of metabolic diseases, such as DM, DL, and obesity, which seemed to be mediated through IR. Considering the cross‐sectional nature of the current study, further investigations using a large‐scale, histologically confirmed NAFLD cohort are warranted to draw a definite conclusion on the association between LMS and advanced fibrosis in NAFLD. Given that a substantial number of NAFLD subjects are non‐obese and there has been no approved pharmacotherapy, our study suggests the therapeutic role of resistance training, especially in lean subjects with NAFLD.
Funding
This work was supported by a public healthcare research grant‐in‐aid from the Seoul Metropolitan Government Seoul National University Boramae Medical Center (04‐2019‐1), the National Research Foundation of Korea (NRF) grant funded by the Korean government [Ministry of Education, Science, and Technology (MEST)] (2016R1D1A1B04934590), and the Korea Health Technology R&D Project through the Korea Health Industry Development Institute (KHIDI) funded by the Ministry of Health and Welfare, Korea (HI17C0912).
Author contributions
S.K. and B.K.K. designed the study and collected and analysed the data. S.K., M.K.M., W.K., and B.K.K. interpreted the data and wrote the manuscript. W.K. and B.K.K. critically reviewed and approved the final version of the manuscript.
Conflict of interest
None declared.
Supporting information
Table S1. Prevalence of nonalcoholic fatty liver disease according to muscle strength quartiles in 10‐year age strata
Acknowledgement
The authors of this manuscript certify that they comply with the ethical guidelines for authorship and publishing in the Journal of Cachexia, Sarcopenia and Muscle. 51
Kang S., Moon M. K., Kim W., and Koo B. K. (2020) Association between muscle strength and advanced fibrosis in non‐alcoholic fatty liver disease: a Korean nationwide survey, Journal of Cachexia, Sarcopenia and Muscle, 11, 1232–1241, doi: 10.1002/jcsm.12598
Contributor Information
Won Kim, Email: drwon1@snu.ac.kr.
Bo Kyung Koo, Email: bokyungkoomd@gmail.com.
References
- 1. Cruz‐Jentoft AJ, Baeyens JP, Bauer JM, Boirie Y, Cederholm T, Landi F, et al. Sarcopenia: European consensus on definition and diagnosis: report of the European Working Group on Sarcopenia in Older People. Age Ageing 2010;39:412–423. [DOI] [PMC free article] [PubMed] [Google Scholar]
- 2. Beaudart C, Zaaria M, Pasleau F, Reginster JY, Bruyere O, et al. Health outcomes of sarcopenia: a systematic review and meta‐analysis. PLoS One 2017;12:e0169548. [DOI] [PMC free article] [PubMed] [Google Scholar]
- 3. Kelley GA, Kelley KS. Is sarcopenia associated with an increased risk of all‐cause mortality and functional disability? Exp Gerontol 2017;96:100–103. [DOI] [PMC free article] [PubMed] [Google Scholar]
- 4. Yuki A, Ando F, Otsuka R, Shimokata H. Sarcopenia based on the Asian Working Group for Sarcopenia criteria and all‐cause mortality risk in older Japanese adults. Geriatr Gerontol Int 2017;17:1642–1647. [DOI] [PubMed] [Google Scholar]
- 5. Koo BK, Kim D, Joo SK, Kim JH, Chang MS, Kim BG, et al. Sarcopenia is an independent risk factor for non‐alcoholic steatohepatitis and significant fibrosis. J Hepatol 2017;66:123–131. [DOI] [PubMed] [Google Scholar]
- 6. Jelenik T, Kaul K, Sequaris G, Flogel U, Phielix E, Kotzka J, et al. Mechanisms of insulin resistance in primary and secondary nonalcoholic fatty liver. Diabetes 2017;66:2241–2253. [DOI] [PMC free article] [PubMed] [Google Scholar]
- 7. Fujita S, Glynn EL, Timmerman KL, Rasmussen BB, Volpi E, et al. Supraphysiological hyperinsulinaemia is necessary to stimulate skeletal muscle protein anabolism in older adults: evidence of a true age‐related insulin resistance of muscle protein metabolism. Diabetologia 2009;52:1889–1898. [DOI] [PMC free article] [PubMed] [Google Scholar]
- 8. Wilkes EA, Selby AL, Atherton PJ, Patel R, Rankin D, Smith K, et al. Blunting of insulin inhibition of proteolysis in legs of older subjects may contribute to age‐related sarcopenia. Am J Clin Nutr 2009;90:1343–1350. [DOI] [PubMed] [Google Scholar]
- 9. Lee YH, Kim SU, Song K, Park JY, Kim DY, Ahn SH, et al. Sarcopenia is associated with significant liver fibrosis independently of obesity and insulin resistance in nonalcoholic fatty liver disease: nationwide surveys (KNHANES 2008–2011). Hepatology 2016;63:776–786. [DOI] [PubMed] [Google Scholar]
- 10. Newman AB, Kupelian V, Visser M, Simonsick EM, Goodpaster BH, Kritchevsky SB, et al. Strength, but not muscle mass, is associated with mortality in the health, aging and body composition study cohort. J Gerontol A Biol Sci Med Sci 2006;61:72–77. [DOI] [PubMed] [Google Scholar]
- 11. Li R, Xia J, Zhang XI, Gathirua‐Mwangi WG, Guo J, Li Y, et al. Associations of muscle mass and strength with all‐cause mortality among US older adults. Med Sci Sports Exerc 2018;50:458–467. [DOI] [PMC free article] [PubMed] [Google Scholar]
- 12. Chalasani N, Younossi Z, Lavine JE, Diehl AM, Brunt EM, Cusi K, et al. The diagnosis and management of non‐alcoholic fatty liver disease: practice guideline by the American Gastroenterological Association, American Association for the Study of Liver Diseases, and American College of Gastroenterology. Gastroenterology 2012;142:1592–1609. [DOI] [PubMed] [Google Scholar]
- 13. American Diabetes Association 2. Classification and diagnosis of diabetes: standards of medical care in diabetes—2019. Diabetes Care 2019; 42: S13‐S28. [DOI] [PubMed] [Google Scholar]
- 14. Grundy SM, Stone NJ, Bailey AL, Beam C, Birtcher KK, Blumenthal RS, et al. 2018 AHA/ACC/AACVPR/AAPA/ABC/ACPM/ADA/AGS/APhA/ASPC/NLA/PCNA guideline on the management of blood cholesterol: executive summary: a report of the American College of Cardiology/American Heart Association Task Force on Clinical Practice Guidelines. J Am Coll Cardiol 2019;73:3168–3209. [DOI] [PubMed] [Google Scholar]
- 15. Pacific WHOROftW . The Asia‐Pacific Perspective: Redefining Obesity and Its Treatment. Australia: Health Communications Australia; 2000. [Google Scholar]
- 16. Lee SY, Park HS, Kim DJ, Han JH, Kim SM, Cho GJ, et al. Appropriate waist circumference cutoff points for central obesity in Korean adults. Diabetes Res Clin Pract 2007;75:72–80. [DOI] [PubMed] [Google Scholar]
- 17. Kuk JL, Ardern CI. Are metabolically normal but obese individuals at lower risk for all‐cause mortality? Diabetes Care 2009;32:2297–2299. [DOI] [PMC free article] [PubMed] [Google Scholar]
- 18. Ridker PM, Wilson PW, Grundy SM. Should C‐reactive protein be added to metabolic syndrome and to assessment of global cardiovascular risk? Circulation 2004;109:2818–2825. [DOI] [PubMed] [Google Scholar]
- 19. Koo BK. The differential association between muscle strength and diabetes mellitus according to the presence or absence of obesity. J Obes Metab Syndr 2019;28:46–52. [DOI] [PMC free article] [PubMed] [Google Scholar]
- 20. Lawman HG, Troiano RP, Perna FM, Wang CY, Fryar CD, Ogden CL. Associations of relative handgrip strength and cardiovascular disease biomarkers in U.S. adults, 2011–2012. Am J Prev Med 2016;50:677–683. [DOI] [PMC free article] [PubMed] [Google Scholar]
- 21. McLean RR, Shardell MD, Alley DE, Cawthon PM, Fragala MS, Harris TB, et al. Criteria for clinically relevant weakness and low lean mass and their longitudinal association with incident mobility impairment and mortality: the foundation for the National Institutes of Health (FNIH) sarcopenia project. J Gerontol A Biol Sci Med Sci 2014;69:576–583. [DOI] [PMC free article] [PubMed] [Google Scholar]
- 22. Lee JH, Kim D, Kim HJ, Lee CH, Yang JI, Kim W, et al. Hepatic steatosis index: a simple screening tool reflecting nonalcoholic fatty liver disease. Dig Liver Dis 2010;42:503–508. [DOI] [PubMed] [Google Scholar]
- 23. Sviklane L, Olmane E, Dzerve Z, Kupčs K, Pīrāgs V, Sokolovska J. Fatty liver index and hepatic steatosis index for prediction of non‐alcoholic fatty liver disease in type 1 diabetes. J Gastroenterol Hepatol 2018;33:270–276. [DOI] [PubMed] [Google Scholar]
- 24. Vallet‐Pichard A, Mallet V, Nalpas B, Verkarre V, Nalpas A, Dhalluin‐Venier V, et al. FIB‐4: an inexpensive and accurate marker of fibrosis in HCV infection. Comparison with liver biopsy and fibrotest. Hepatology 2007;46:32–36. [DOI] [PubMed] [Google Scholar]
- 25. Harrison SA, Oliver D, Arnold HL, Gogia S, Neuschwander‐Tetri BA. Development and validation of a simple NAFLD clinical scoring system for identifying patients without advanced disease. Gut 2008;57:1441–1447. [DOI] [PubMed] [Google Scholar]
- 26. Shah AG, Lydecker A, Murray K, Tetri BN, Contos MJ, Sanyal AJ. Comparison of noninvasive markers of fibrosis in patients with nonalcoholic fatty liver disease. Clin Gastroenterol Hepatol 2009;7:1104–1112. [DOI] [PMC free article] [PubMed] [Google Scholar]
- 27. McPherson S, Hardy T, Dufour JF, Petta S, Romero‐Gomez M, Allison M, et al. Age as a confounding factor for the accurate non‐invasive diagnosis of advanced NAFLD fibrosis. Am J Gastroenterol 2017;112:740–751. [DOI] [PMC free article] [PubMed] [Google Scholar]
- 28. Merli M, Dasarathy S. Sarcopenia in non‐alcoholic fatty liver disease: targeting the real culprit? J Hepatol 2015;63:309–311. [DOI] [PubMed] [Google Scholar]
- 29. Schaap LA, van Schoor NM, Lips P, Visser M. Associations of sarcopenia definitions, and their components, with the incidence of recurrent falling and fractures: the Longitudinal Aging Study Amsterdam. J Gerontol A Biol Sci Med Sci 2018;73:1199–1204. [DOI] [PubMed] [Google Scholar]
- 30. Leong DP, Teo KK, Rangarajan S, Lopez‐Jaramillo P, Avezum A Jr, Orlandini A, et al. Prognostic value of grip strength: findings from the Prospective Urban Rural Epidemiology (PURE) study. Lancet 2015;386:266–273. [DOI] [PubMed] [Google Scholar]
- 31. Cruz‐Jentoft AJ, Bahat G, Bauer J, Boirie Y, Bruyère O, Cederholm T, et al. Sarcopenia: revised European consensus on definition and diagnosis. Age Ageing 2019;48:16–31. [DOI] [PMC free article] [PubMed] [Google Scholar]
- 32. Kim D, Kim W, Joo SK, Kim JH, Harrison SA, Younossi ZM, et al. Predictors of nonalcoholic steatohepatitis and significant fibrosis in non‐obese nonalcoholic fatty liver disease. Liver Int 2019;39:332–341. [DOI] [PubMed] [Google Scholar]
- 33. Srikanthan P, Hevener AL, Karlamangla AS. Sarcopenia exacerbates obesity‐associated insulin resistance and dysglycemia: findings from the National Health and Nutrition Examination Survey III. PLoS One 2010;5:e10805. [DOI] [PMC free article] [PubMed] [Google Scholar]
- 34. Chalasani N, Younossi Z, Lavine JE, Diehl AM, Brunt EM, Cusi K, et al. The diagnosis and management of non‐alcoholic fatty liver disease: practice guideline by the American Association for the Study of Liver Diseases, American College of Gastroenterology, and the American Gastroenterological Association. Hepatology 2012;55:2005–2023. [DOI] [PubMed] [Google Scholar]
- 35. Samuel VT, Liu ZX, Qu X, Elder BD, Bilz S, Befroy D, et al. Mechanism of hepatic insulin resistance in non‐alcoholic fatty liver disease. J Biol Chem 2004;279:32345–32353. [DOI] [PubMed] [Google Scholar]
- 36. Payette H, Roubenoff R, Jacques PF, Dinarello CA, Wilson PW, Abad LW, et al. Insulin‐like growth factor‐1 and interleukin 6 predict sarcopenia in very old community‐living men and women: the Framingham Heart Study. J Am Geriatr Soc 2003;51:1237–1243. [DOI] [PubMed] [Google Scholar]
- 37. Ferrucci L, Penninx BW, Volpato S, Harris TB, Bandeen‐Roche K, Balfour J, et al. Change in muscle strength explains accelerated decline of physical function in older women with high interleukin‐6 serum levels. J Am Geriatr Soc 2002;50:1947–1954. [DOI] [PubMed] [Google Scholar]
- 38. Sanyal AJ, Chalasani N, Kowdley KV, McCullough A, Diehl AM, Bass NM, et al. Pioglitazone, vitamin E, or placebo for nonalcoholic steatohepatitis. N Engl J Med 2010;362:1675–1685. [DOI] [PMC free article] [PubMed] [Google Scholar]
- 39. Belfort R, Harrison SA, Brown K, Darland C, Finch J, Hardies J, et al. A placebo‐controlled trial of pioglitazone in subjects with nonalcoholic steatohepatitis. N Engl J Med 2006;355:2297–2307. [DOI] [PubMed] [Google Scholar]
- 40. Armstrong MJ, Gaunt P, Aithal GP, Barton D, Hull D, Parker R, et al. Liraglutide safety and efficacy in patients with non‐alcoholic steatohepatitis (LEAN): a multicentre, double‐blind, randomised, placebo‐controlled phase 2 study. Lancet 2016;387:679–690. [DOI] [PubMed] [Google Scholar]
- 41. Neuschwander‐Tetri BA, Loomba R, Sanyal AJ, Lavine JE, Van Natta ML, Abdelmalek MF, et al. Farnesoid X nuclear receptor ligand obeticholic acid for non‐cirrhotic, non‐alcoholic steatohepatitis (FLINT): a multicentre, randomised, placebo‐controlled trial. Lancet 2015;385:956–965. [DOI] [PMC free article] [PubMed] [Google Scholar]
- 42. Vilar‐Gomez E, Martinez‐Perez Y, Calzadilla‐Bertot L, Torres‐Gonzalez A, Gra‐Oramas B, Gonzalez‐Fabian L, et al. Weight loss through lifestyle modification significantly reduces features of nonalcoholic steatohepatitis. Gastroenterology 2015;149:367, e365–378, quiz e314–365. [DOI] [PubMed] [Google Scholar]
- 43. Zelber‐Sagi S, Buch A, Yeshua H, Vaisman N, Webb M, Harari G, et al. Effect of resistance training on non‐alcoholic fatty‐liver disease a randomized‐clinical trial. World J Gastroenterol 2014;20:4382–4392. [DOI] [PMC free article] [PubMed] [Google Scholar]
- 44. Hallsworth K, Fattakhova G, Hollingsworth KG, Thoma C, Moore S, Taylor R, et al. Resistance exercise reduces liver fat and its mediators in non‐alcoholic fatty liver disease independent of weight loss. Gut 2011;60:1278–1283. [DOI] [PMC free article] [PubMed] [Google Scholar]
- 45. Pereira RM, Rodrigues K, Anaruma CP, Sant'Ana MR, de Campos TD, Gaspar RS, et al. Short‐term strength training reduces gluconeogenesis and NAFLD in obese mice. J Endocrinol 2019;241:59–70. [DOI] [PubMed] [Google Scholar]
- 46. Verdijk LB, Gleeson BG, Jonkers RA, Meijer K, Savelberg HH, Dendale P, et al. Skeletal muscle hypertrophy following resistance training is accompanied by a fiber type‐specific increase in satellite cell content in elderly men. J Gerontol A Biol Sci Med Sci 2009;64:332–339. [DOI] [PMC free article] [PubMed] [Google Scholar]
- 47. Gallagher PM, Touchberry CD, Teson K, McCabe E, Tehel M, Wacker MJ. Effects of an acute bout of resistance exercise on fiber‐type specific to GLUT4 and IGF‐1R expression. Appl Physiol Nutr Metab 2013;38:581–586. [DOI] [PubMed] [Google Scholar]
- 48. Oh YS, Kim HJ, Ryu SJ, Cho KA, Park YS, Park H, et al. Exercise type and muscle fiber specific induction of caveolin‐1 expression for insulin sensitivity of skeletal muscle. Exp Mol Med 2007;39:395–401. [DOI] [PubMed] [Google Scholar]
- 49. Kim HJ, Lee HJ, So B, Son JS, Yoon D, Song W. Effect of aerobic training and resistance training on circulating irisin level and their association with change of body composition in overweight/obese adults: a pilot study. Physiol Res 2016;65:271–279. [DOI] [PubMed] [Google Scholar]
- 50. Park MJ, Kim DI, Choi JH, Heo YR, Park SH. New role of irisin in hepatocytes: the protective effect of hepatic steatosis in vitro. Cell Signal 2015;27:1831–1839. [DOI] [PubMed] [Google Scholar]
- 51. von Haehling S, Morley JE, Coats AJS, Anker SD. Ethical guidelines for publishing in the Journal of Cachexia, Sarcopenia and Muscle: update 2019. J Cachexia Sarcopenia Muscle 2019;10:1143–1145. [DOI] [PMC free article] [PubMed] [Google Scholar]
Associated Data
This section collects any data citations, data availability statements, or supplementary materials included in this article.
Supplementary Materials
Table S1. Prevalence of nonalcoholic fatty liver disease according to muscle strength quartiles in 10‐year age strata